Home > Comparison > Technology > FTNT vs CCCS
The strategic rivalry between Fortinet, Inc. and CCC Intelligent Solutions Holdings Inc. shapes the evolution of the technology sector’s software infrastructure landscape. Fortinet, a capital-intensive cybersecurity powerhouse, contrasts sharply with CCC’s cloud-based, AI-driven SaaS model for the insurance economy. This analysis explores a contest between established scale and innovative niche specialization, aiming to identify which trajectory offers superior risk-adjusted returns for a diversified portfolio in 2026.
Table of contents
Companies Overview
Fortinet and CCC Intelligent Solutions stand as pivotal players in the software infrastructure landscape, shaping cybersecurity and insurance technology markets respectively.
Fortinet, Inc.: Cybersecurity Powerhouse
Fortinet commands the cybersecurity sector with its integrated and automated security solutions. Its revenue stems from hardware and software sales, including FortiGate firewalls and endpoint protection services. In 2026, the company sharpened its focus on broadening security subscriptions and enhancing centralized management to defend complex digital environments.
CCC Intelligent Solutions Holdings Inc.: Insurance Technology Innovator
CCC Intelligent Solutions dominates the property and casualty insurance software space with its AI-driven SaaS platform. It monetizes through digital workflows and commerce facilitation across insurance carriers, repairers, and parts suppliers. Its 2026 strategy emphasizes expanding AI analytics and ecosystem connectivity to streamline insurance operations globally.
Strategic Collision: Similarities & Divergences
Both companies leverage software infrastructure to address distinct market needs but differ in approach: Fortinet builds a closed cybersecurity ecosystem, while CCC champions an open, AI-enabled insurance platform. They compete primarily on innovation and scalability within their verticals. Their investment profiles diverge sharply—Fortinet offers stability from cybersecurity’s critical demand, whereas CCC presents growth potential in a niche, evolving insurance economy.
Income Statement Comparison
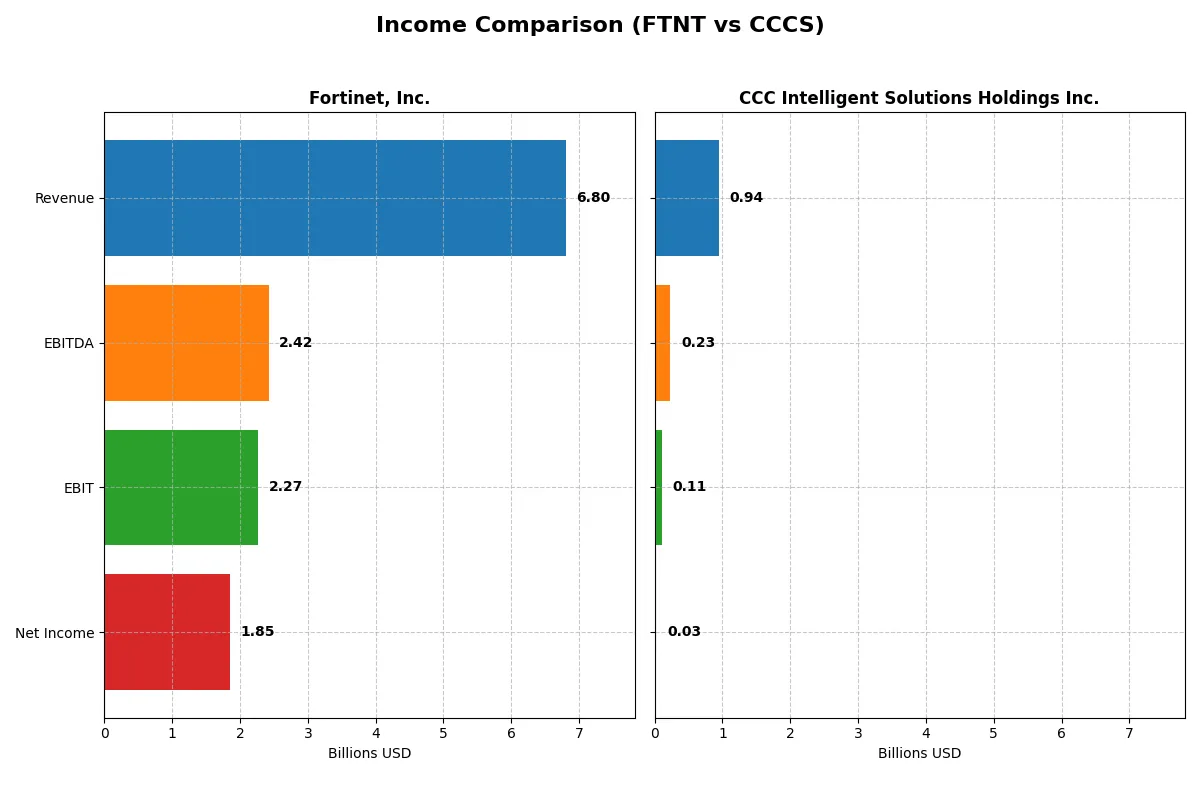
The following data dissects the core profitability and scalability of both corporate engines to reveal who dominates the bottom line:
| Metric | Fortinet, Inc. (FTNT) | CCC Intelligent Solutions Holdings Inc. (CCCS) |
|---|---|---|
| Revenue | 6.8B | 945M |
| Cost of Revenue | 1.3B | 231M |
| Operating Expenses | 3.4B | 634M |
| Gross Profit | 5.5B | 714M |
| EBITDA | 2.4B | 233M |
| EBIT | 2.3B | 109M |
| Interest Expense | 20M | 65M |
| Net Income | 1.9B | 26M |
| EPS | 2.44 | 0.043 |
| Fiscal Year | 2025 | 2024 |
Income Statement Analysis: The Bottom-Line Duel
This income statement comparison exposes how efficiently each company converts sales into profit, revealing their corporate engines’ true strength.
Fortinet, Inc. Analysis
Fortinet’s revenue surged from 3.3B in 2021 to nearly 6.8B in 2025, with net income tripling to 1.85B. Its gross margin remains robust at 80.8%, while net margin holds a strong 27.3%. The 2025 figures display solid momentum, with expanding operating income and disciplined cost control fueling sustained profitability.
CCC Intelligent Solutions Holdings Inc. Analysis
CCC’s revenue climbed steadily from 633M in 2020 to 945M in 2024, while net income swung from losses to a modest 26M profit. Gross margin stands healthy at 75.6%, though net margin is thin at 2.8%. The 2024 results indicate a turnaround in profitability, supported by sharp EBIT growth and improving operational efficiency.
Margin Strength vs. Profit Scale
Fortinet dominates with superior margins and a far larger profit base, reflecting a scalable and efficient business model. CCC shows impressive profit recovery and growth rates but remains a smaller player with slim net returns. For investors, Fortinet’s profile offers established margin power and scale, while CCC presents a higher-risk, growth-focused opportunity.
Financial Ratios Comparison
These vital ratios act as a diagnostic tool to expose the underlying fiscal health, valuation premiums, and capital efficiency of the companies compared below:
| Ratios | Fortinet, Inc. (FTNT) | CCC Intelligent Solutions Holdings Inc. (CCCS) |
|---|---|---|
| ROE | 1.50 | 0.01 |
| ROIC | 0.29 | 0.02 |
| P/E | 32.48 | 274.02 |
| P/B | 48.64 | 3.59 |
| Current Ratio | 1.17 | 3.65 |
| Quick Ratio | 1.09 | 3.65 |
| D/E (Debt-to-Equity) | 0.81 | 0.42 |
| Debt-to-Assets | 0.10 | 0.27 |
| Interest Coverage | 103.72 | 1.24 |
| Asset Turnover | 0.65 | 0.30 |
| Fixed Asset Turnover | 4.20 | 4.68 |
| Payout ratio | 0 | 0 |
| Dividend yield | 0 | 0 |
| Fiscal Year | 2025 | 2024 |
Efficiency & Valuation Duel: The Vital Signs
Financial ratios act as a company’s DNA, revealing hidden risks and operational excellence that raw numbers alone cannot expose.
Fortinet, Inc.
Fortinet delivers exceptional profitability with a 150% ROE and a strong 27% net margin, signaling operational efficiency. However, its valuation appears stretched, with a P/E of 32.5 and a high P/B of 48.6. The company offers no dividend, instead reinvesting aggressively in R&D, fueling growth and maintaining a robust moat.
CCC Intelligent Solutions Holdings Inc.
Data for CCC Intelligent Solutions’ key ratios is unavailable, preventing a direct comparison of profitability and valuation metrics. This lack of transparency hinders a clear assessment of operational efficiency or shareholder returns, increasing uncertainty for investors relying on fundamental analysis.
Premium Valuation vs. Data Opacity
Fortinet’s high profitability justifies its premium valuation despite stretched multiples, offering a clearer risk-reward balance. CCC’s missing ratio data raises red flags, limiting confidence in its financial health. Investors seeking transparent fundamentals may favor Fortinet’s proven operational strength.
Which one offers the Superior Shareholder Reward?
Fortinet delivers no dividends but reinvests robustly, with a free cash flow per share of 2.94 and an aggressive buyback program enhancing shareholder value. CCC Intelligent Solutions pays no dividends either and shows weaker free cash flow at 0.38 per share, with modest buybacks. Fortinet’s higher operating margins, solid cash flow coverage, and capital allocation discipline make its shareholder reward model far more sustainable and attractive than CCCS’s riskier growth approach. In 2026, I find Fortinet superior for total return investors focused on balance sheet strength and capital efficiency.
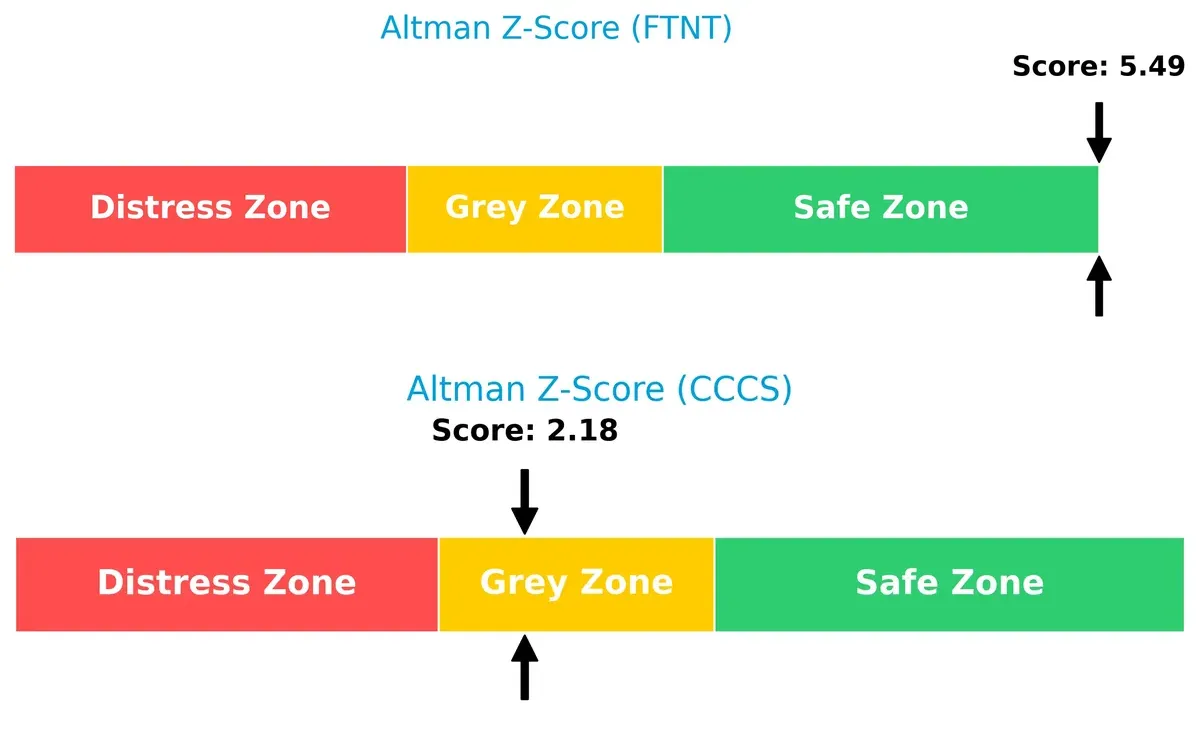
Bankruptcy Risk Duel (Altman Z-Score)
Bankruptcy Risk: Solvency Showdown
I observe that Fortinet’s Altman Z-Score of 5.49 places it firmly in the safe zone, signaling strong long-term solvency. In contrast, CCC Intelligent Solutions’ score of 2.18 lands in the grey zone, indicating moderate bankruptcy risk in this cycle:
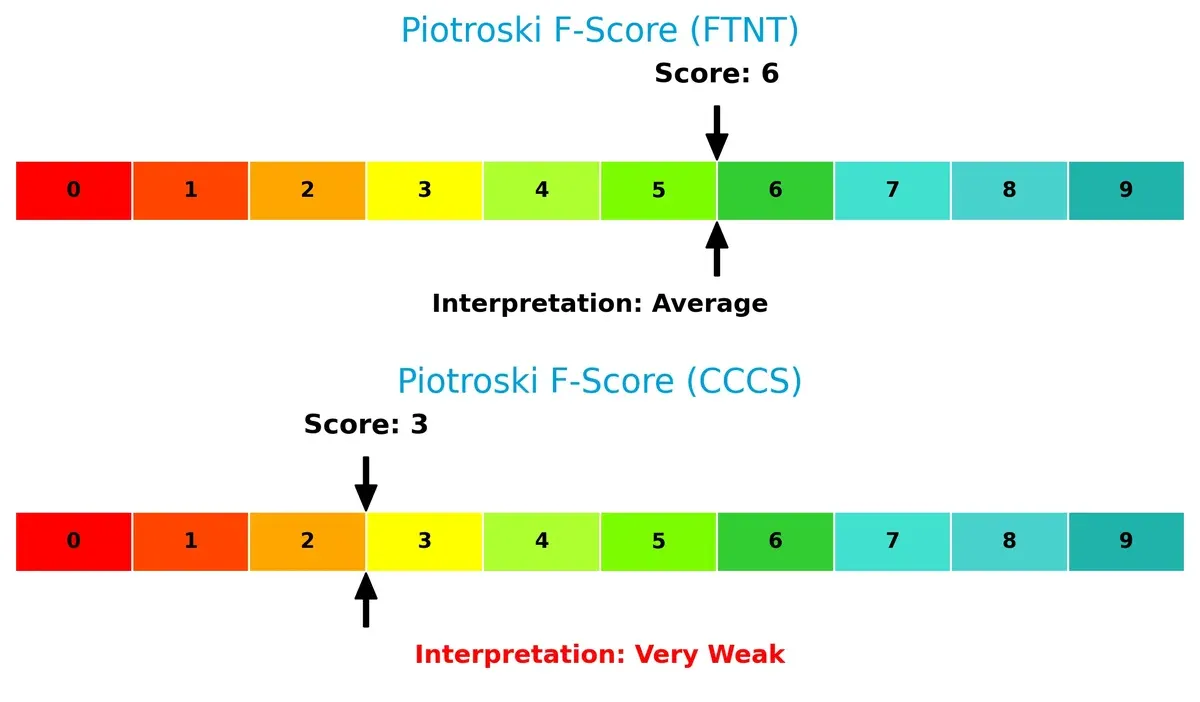
Financial Strength Showdown (Piotroski F-Score)
Financial Health: Quality of Operations
Fortinet scores a solid 6 on the Piotroski scale, reflecting average but stable financial health. CCC Intelligent Solutions lags with a weak 3, revealing red flags in operational efficiency and financial quality:
How are the two companies positioned?
This section dissects Fortinet and CCC Intelligent Solutions’ operational DNA by comparing revenue distribution and internal dynamics. The goal is to confront their economic moats and reveal which model sustains the strongest competitive advantage today.
Revenue Segmentation: The Strategic Mix
This visual comparison dissects how Fortinet, Inc. and CCC Intelligent Solutions diversify their income streams and where their primary sector bets lie:
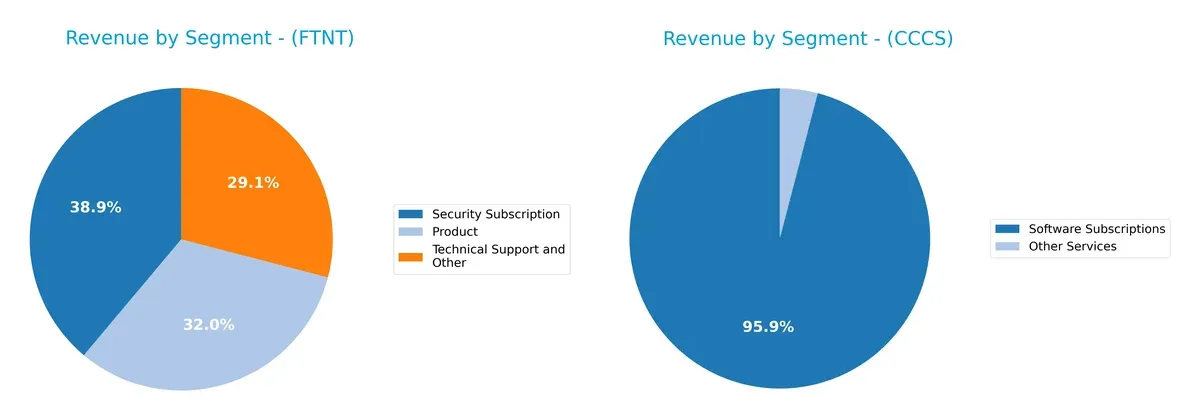
Fortinet anchors its revenue in Security Subscription at $2.3B in 2024, supported by $1.9B in Product sales and $1.7B in Technical Support. This mix reflects a balanced ecosystem lock-in. CCC Intelligent Solutions pivots heavily on Software Subscriptions, generating $906M, while Other Services lag at $38M. Fortinet’s broader spread reduces concentration risk, while CCC’s reliance on a dominant software segment intensifies dependency on subscription growth.
Strengths and Weaknesses Comparison
This table compares the strengths and weaknesses of Fortinet, Inc. and CCC Intelligent Solutions Holdings Inc.:
Fortinet Strengths
- Diversified revenue streams across products, subscriptions, and support
- Strong profitability with 27.26% net margin and 149.77% ROE
- Global presence spanning Americas, EMEA, and Asia Pacific
- Favorable debt metrics with low debt-to-assets (9.59%)
- High asset turnover indicating operational efficiency
CCC Intelligent Solutions Strengths
- Revenue growth concentrated in software subscriptions
- Significant Americas market presence with 938M revenue in 2024
- Consistent revenue increase in software subscriptions from 662M in 2021 to 906M in 2024
Fortinet Weaknesses
- High valuation multiples with unfavorable PE (32.48) and PB (48.64)
- Lack of dividend yield limits income appeal
- Neutral liquidity ratios may pose short-term risk
CCC Intelligent Solutions Weaknesses
- Lack of available financial ratios and key metrics limits transparency
- Geographic revenue highly concentrated in Americas with minimal presence in China
- Limited diversification with heavy reliance on software subscriptions
Overall, Fortinet demonstrates robust financial strength and global diversification but faces valuation and dividend yield concerns. CCC Intelligent Solutions shows growth in subscription revenue and Americas dominance but lacks comprehensive financial data and geographic diversity, posing transparency and concentration risks.
The Moat Duel: Analyzing Competitive Defensibility
A structural moat is the only reliable barrier protecting long-term profits from relentless competition pressures and market disruption:
Fortinet, Inc.: Integrated Security Platform Moat
Fortinet’s moat arises from its broad, integrated cybersecurity solutions creating high switching costs. Its 33% EBIT margin and 20%+ ROIC above WACC confirm strong value creation. Expansion into AI-powered threat detection in 2026 should deepen this moat.
CCC Intelligent Solutions Holdings Inc.: AI-Driven Insurance Ecosystem Moat
CCC’s moat centers on its AI-enabled SaaS platform connecting multiple insurance economy players. Though margins are thinner than Fortinet’s, rapid revenue and EBIT growth indicate strengthening competitive positioning. Scaling into new insurance verticals could accelerate moat widening.
Integrated Security vs. AI Ecosystem: Which Moat Defends Market Leadership?
Fortinet’s wider moat stems from a durable technology platform and superior capital efficiency. CCC’s moat is promising but less proven and narrower in scope. I see Fortinet better equipped to defend and expand its market share into 2026.
Which stock offers better returns?
Over the past 12 months, Fortinet, Inc. and CCC Intelligent Solutions Holdings Inc. exhibited contrasting price trajectories, with Fortinet showing solid gains and CCC facing sharp declines.
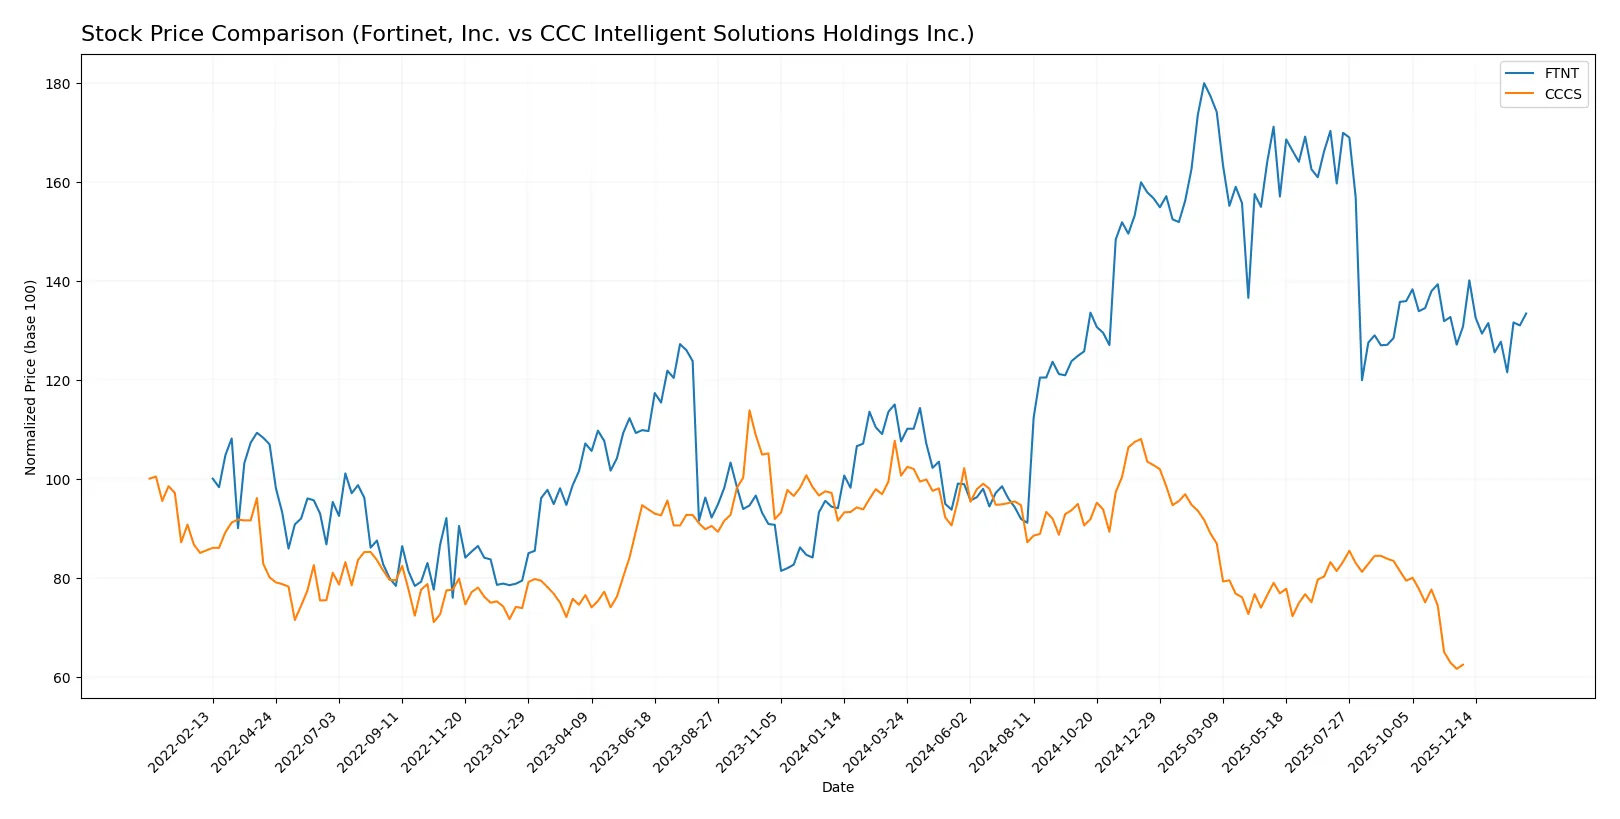
Trend Comparison
Fortinet’s stock gained 24.04% over the past year, marking a bullish trend despite decelerating momentum. Price ranged between 56.51 and 111.64, with moderate volatility (15.07%).
CCC Intelligent Solutions declined 31.78% over 12 months, reflecting a bearish trend with decelerating losses. The price fluctuated narrowly from 7.22 to 12.67, showing low volatility (1.24%).
Fortinet outperformed CCC significantly, delivering robust upward returns while CCC’s stock suffered marked depreciation and weaker market sentiment.
Target Prices
Analysts show a moderately bullish consensus on Fortinet and a steady view on CCC Intelligent Solutions.
| Company | Target Low | Target High | Consensus |
|---|---|---|---|
| Fortinet, Inc. (FTNT) | 70 | 90 | 85 |
| CCC Intelligent Solutions Holdings Inc. (CCCS) | 11 | 11 | 11 |
Fortinet’s target consensus at $85 slightly exceeds its current $82.76 price, suggesting modest upside potential. CCC’s fixed target at $11 stands well above its $8.75 market price, indicating analysts expect a significant rebound.

Don’t Let Luck Decide Your Entry Point
Optimize your entry points with our advanced ProRealTime indicators. You’ll get efficient buy signals with precise price targets for maximum performance. Start outperforming now!
How do institutions grade them?
The following summarizes the latest institutional grades for Fortinet, Inc. and CCC Intelligent Solutions Holdings Inc.:
Fortinet, Inc. Grades
This table shows recent grade updates from recognized financial institutions for Fortinet, Inc.:
| Grading Company | Action | New Grade | Date |
|---|---|---|---|
| Mizuho | Maintain | Underperform | 2026-02-06 |
| RBC Capital | Maintain | Sector Perform | 2026-02-06 |
| JP Morgan | Maintain | Underweight | 2026-02-06 |
| Rosenblatt | Maintain | Buy | 2026-02-06 |
| Wedbush | Maintain | Outperform | 2026-02-06 |
| Scotiabank | Downgrade | Sector Perform | 2026-02-02 |
| JP Morgan | Maintain | Underweight | 2026-01-30 |
| Rosenblatt | Upgrade | Buy | 2026-01-29 |
| TD Cowen | Upgrade | Buy | 2026-01-23 |
| Citigroup | Maintain | Neutral | 2026-01-13 |
Which company has the best grades?
Only Fortinet, Inc. has received institutional grades, which range from Underperform to Buy. This mixed but generally positive outlook may influence investor sentiment and portfolio positioning. CCC Intelligent Solutions lacks available grade data.
Risks specific to each company
The following categories identify the critical pressure points and systemic threats facing Fortinet, Inc. and CCC Intelligent Solutions Holdings Inc. in the 2026 market environment:
1. Market & Competition
Fortinet, Inc.
- Operates in a highly competitive cybersecurity sector with strong demand but aggressive rivals.
CCC Intelligent Solutions Holdings Inc.
- Faces intense competition in AI-driven insurance tech with rapid innovation and evolving client needs.
2. Capital Structure & Debt
Fortinet, Inc.
- Moderate debt-to-equity ratio (0.81), favorable interest coverage at 113x; solid financial footing.
CCC Intelligent Solutions Holdings Inc.
- Detailed debt metrics unavailable, increasing uncertainty about financial leverage risks.
3. Stock Volatility
Fortinet, Inc.
- Beta of 1.05 indicates market-level volatility; stock price range moderately wide (70.12-114.82).
CCC Intelligent Solutions Holdings Inc.
- Lower beta at 0.72 suggests less volatility, but less active trading may impact liquidity.
4. Regulatory & Legal
Fortinet, Inc.
- Cybersecurity regulations and data privacy laws pose ongoing compliance challenges globally.
CCC Intelligent Solutions Holdings Inc.
- Insurance tech faces regulatory scrutiny around data use and AI, with evolving standards in multiple jurisdictions.
5. Supply Chain & Operations
Fortinet, Inc.
- Relies on hardware and software supply chains susceptible to global semiconductor and logistics disruptions.
CCC Intelligent Solutions Holdings Inc.
- Cloud-based SaaS model reduces physical supply risk but depends heavily on data center and network infrastructure.
6. ESG & Climate Transition
Fortinet, Inc.
- Faces pressure to improve energy efficiency in data centers and reduce hardware manufacturing footprint.
CCC Intelligent Solutions Holdings Inc.
- ESG disclosures limited; AI and cloud operations require sustainable energy use to align with investor expectations.
7. Geopolitical Exposure
Fortinet, Inc.
- Global operations expose it to geopolitical tensions, particularly US-China tech restrictions.
CCC Intelligent Solutions Holdings Inc.
- Primarily US-focused, lower direct geopolitical risk but vulnerable to cross-border insurance regulations.
Which company shows a better risk-adjusted profile?
Fortinet’s strongest risk is market competition amid rapid cybersecurity innovation. CCC’s biggest concern is financial opacity, heightening leverage and credit risks. Fortinet’s robust Altman Z-score (5.49, safe zone) and proven capital structure give it a superior risk-adjusted profile. CCC’s grey-zone Z-score (2.18) and weak Piotroski score (3) flag caution. Fortinet’s favorable interest coverage ratio and diversified global presence justify confidence despite valuation premiums.
Final Verdict: Which stock to choose?
Fortinet’s superpower lies in its ability to generate outstanding returns on invested capital, showcasing a durable moat through consistent value creation. Its high valuation multiples are a point of vigilance, signaling that future growth must justify the premium. It suits aggressive growth portfolios willing to pay for leadership in cybersecurity innovation.
CCC Intelligent Solutions benefits from a strategic moat rooted in its niche software offerings and recurring revenue streams. Compared to Fortinet, CCC presents a safer balance sheet profile but suffers from weaker profitability and financial distress signals. It fits portfolios focused on GARP—growth at a reasonable price—where stability and gradual improvement matter.
If you prioritize high-growth leadership and can tolerate valuation risk, Fortinet outshines with its proven economic moat and robust profitability. However, if you seek steadier cash flow and a more conservative risk profile, CCC could offer better stability despite near-term financial challenges. Both require careful risk assessment aligned with your investment horizon.
Disclaimer: Investment carries a risk of loss of initial capital. The past performance is not a reliable indicator of future results. Be sure to understand risks before making an investment decision.
Go Further
I encourage you to read the complete analyses of Fortinet, Inc. and CCC Intelligent Solutions Holdings Inc. to enhance your investment decisions: