Home > Comparison > Technology > CPAY vs CCCS
The strategic rivalry between Corpay, Inc. and CCC Intelligent Solutions Holdings Inc. shapes the evolution of the technology sector’s software infrastructure niche. Corpay operates as a global payments platform with a broad operational footprint, while CCC focuses on AI-driven SaaS solutions for the insurance economy. This analysis contrasts their distinct growth trajectories to determine which offers superior risk-adjusted returns for a diversified portfolio in 2026.

Table of contents
Companies Overview
Corpay, Inc. and CCC Intelligent Solutions Holdings Inc. shape critical niches within the software infrastructure sector.
Corpay, Inc.: Payments Solutions Powerhouse
Corpay stands as a leading payments company specializing in vehicle-related and corporate payment solutions. It generates revenue through fuel, toll, parking, fleet maintenance services, and corporate accounts payable automation. In 2026, Corpay focuses strategically on expanding cross-border payment technologies and enhancing virtual card offerings to support global business clients.
CCC Intelligent Solutions Holdings Inc.: AI-Driven Insurance Software
CCC Intelligent Solutions dominates with its AI-enabled SaaS platform tailored for the property and casualty insurance economy. Its revenue stems from cloud-based workflows, telematics, and analytics connecting insurers, repairers, and manufacturers. In 2026, the company prioritizes deepening AI analytics capabilities and expanding ecosystem integrations within insurance and automotive sectors.
Strategic Collision: Similarities & Divergences
Both firms leverage software infrastructure but target distinct verticals—Corpay targets payments across transportation and corporate sectors, while CCC focuses on AI-driven insurance workflows. Their battleground lies in digital transformation, with Corpay emphasizing financial automation and CCC augmenting insurance operations. These differences carve unique risk and growth profiles for investors aligned with payment innovation or insurance technology advancements.
Income Statement Comparison
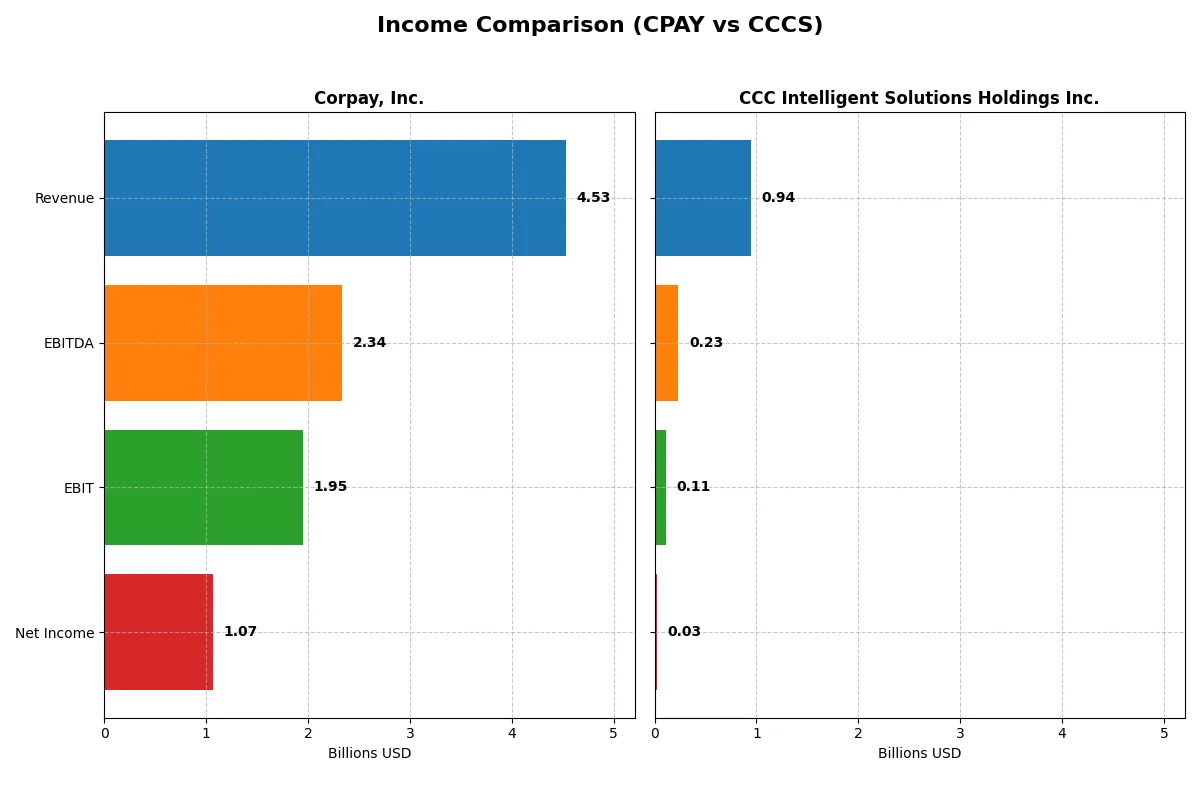
The following data dissects the core profitability and scalability of both corporate engines to reveal who dominates the bottom line:
| Metric | Corpay, Inc. (CPAY) | CCC Intelligent Solutions Holdings Inc. (CCCS) |
|---|---|---|
| Revenue | 4.53B | 945M |
| Cost of Revenue | 1.36B | 231M |
| Operating Expenses | 1.21B | 634M |
| Gross Profit | 3.17B | 714M |
| EBITDA | 2.34B | 233M |
| EBIT | 1.95B | 109M |
| Interest Expense | 404M | 65M |
| Net Income | 1.07B | 26M |
| EPS | 15.25 | 0.0428 |
| Fiscal Year | 2025 | 2024 |
Income Statement Analysis: The Bottom-Line Duel
This income statement comparison reveals which company operates with greater efficiency and sustainable profit generation in their respective markets.
Corpay, Inc. Analysis
Corpay’s revenue grew steadily from 2.8B in 2021 to 4.5B in 2025, with net income rising from 839M to 1.07B. The company maintains strong gross margins near 70% and an impressive EBIT margin above 43%, showcasing operational efficiency. Despite a slight dip in net margin growth recently, Corpay’s overall trajectory reflects solid earnings momentum and disciplined cost control.
CCC Intelligent Solutions Holdings Inc. Analysis
CCC’s revenue climbed from 633M in 2020 to 945M in 2024, while net income swung from a loss of 17M to a positive 26M. The company boasts a higher gross margin of 75.5% but a modest EBIT margin around 11.5%. CCC’s rapid EBIT and net margin growth over the last year signal improving profitability and operational leverage, although absolute profits remain small compared to revenue scale.
Scale and Margin Leadership: Corpay’s Efficiency vs. CCC’s Turnaround
Corpay dominates in absolute revenue and net income with robust margins and consistent growth. CCC impresses with margin expansion and turnaround momentum but from a lower profit base. For investors prioritizing steady profit generation and scale, Corpay’s profile offers a clearer fundamental win. CCC appeals more to those seeking high-growth potential in an improving margin story.
Financial Ratios Comparison
These vital ratios act as a diagnostic tool to expose the underlying fiscal health, valuation premiums, and capital efficiency of the companies compared below:
| Ratios | Corpay, Inc. (CPAY) | CCC Intelligent Solutions Holdings Inc. (CCCS) |
|---|---|---|
| ROE | 27.5% | 1.31% |
| ROIC | 8.78% | 1.86% |
| P/E | 19.7 | 274.0 |
| P/B | 5.43 | 3.59 |
| Current Ratio | 0.98 | 3.65 |
| Quick Ratio | 0.98 | 3.65 |
| D/E (Debt-to-Equity) | 2.58 | 0.42 |
| Debt-to-Assets | 37.9% | 26.7% |
| Interest Coverage | 4.83 | 1.24 |
| Asset Turnover | 0.17 | 0.30 |
| Fixed Asset Turnover | 9.59 | 4.68 |
| Payout ratio | 0 | 0 |
| Dividend yield | 0 | 0 |
| Fiscal Year | 2025 | 2024 |
Efficiency & Valuation Duel: The Vital Signs
Financial ratios act as a company’s DNA, exposing hidden risks and operational excellence that shape investor confidence and valuation.
Corpay, Inc.
Corpay delivers robust profitability with a 27.55% ROE and a strong 23.62% net margin, signaling operational efficiency. Its P/E of 19.73 is fair, but a high P/B of 5.43 suggests valuation pressure. The company pays no dividend, indicating reinvestment into growth or strategic initiatives. However, a weak current ratio at 0.98 raises liquidity concerns.
CCC Intelligent Solutions Holdings Inc.
CCCS lacks available ratio data, leaving profitability and valuation unclear. This opacity complicates assessment of operational efficiency or risk. Without dividends or disclosed buybacks, shareholder returns remain uncertain. The absence of key financial metrics limits visibility into capital allocation and sustainability.
Robust Profitability vs. Data Opacity
Corpay offers clear insights with favorable profitability and a balanced valuation despite some liquidity red flags. CCCS’s missing data creates uncertainty that heightens risk. Investors favoring transparency and operational strength may lean toward Corpay, while those comfortable with unknowns might watch CCCS for future clarity.
Which one offers the Superior Shareholder Reward?
I observe Corpay, Inc. (CPAY) delivers superior shareholder rewards compared to CCC Intelligent Solutions Holdings Inc. (CCCS). CPAY pays no dividends but generates strong free cash flow (18.5/share in 2025), supporting robust buybacks that enhance total returns. CCCS also pays no dividends and posts minimal free cash flow (0.38/share in 2024), with a weaker profit margin (2.8%) and aggressive valuation (P/E over 270). CPAY’s capital allocation prioritizes sustainable buybacks backed by solid cash flows and margins, while CCCS’s model relies heavily on growth investments amid volatile profitability. For a 2026 investor, CPAY’s distribution philosophy and financial health signal a more attractive and durable total return profile.
Bankruptcy Risk Duel (Altman Z-Score)
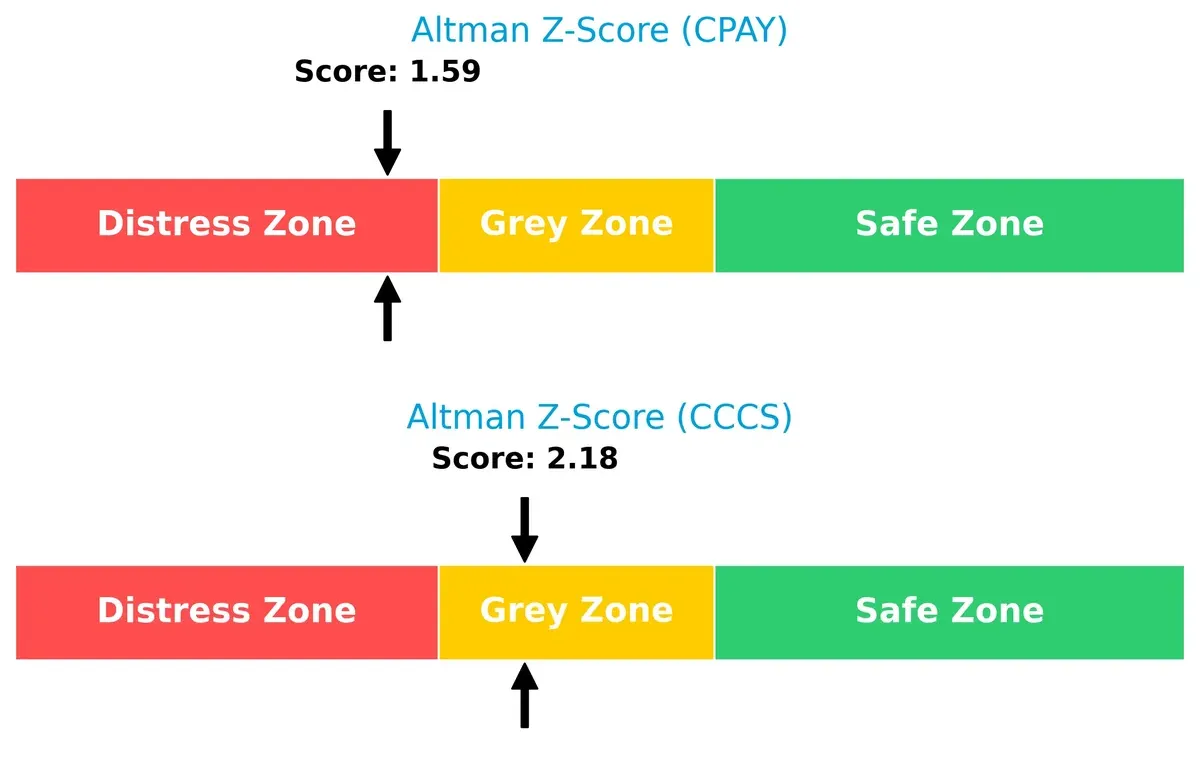
Bankruptcy Risk: Solvency Showdown
I observe that Corpay, Inc. (CPAY) scores 1.59, placing it in the distress zone, while CCC Intelligent Solutions Holdings Inc. (CCCS) scores 2.18, in the grey zone. This implies CPAY faces higher bankruptcy risk in this cycle:
Financial Strength Showdown (Piotroski F-Score)
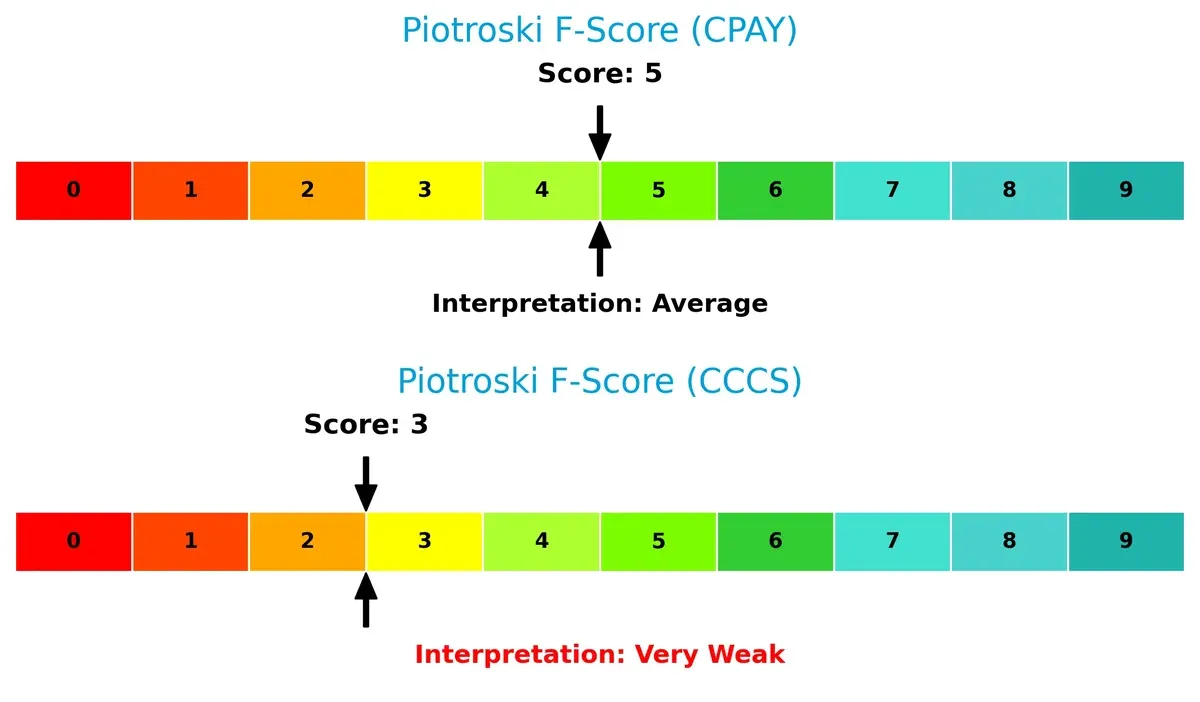
Financial Health: Quality of Operations
CPAY shows a Piotroski F-Score of 5, indicating average financial health. CCCS scores 3, signaling weak internal metrics and red flags for operational strength:
How are the two companies positioned?
This section dissects the operational DNA of Corpay and CCCS by comparing their revenue distribution and internal dynamics. The objective is to confront their economic moats and identify which model offers the most resilient, sustainable competitive advantage today.
Revenue Segmentation: The Strategic Mix
This visual comparison dissects how Corpay, Inc. and CCC Intelligent Solutions Holdings Inc. diversify their income streams and where their primary sector bets lie:
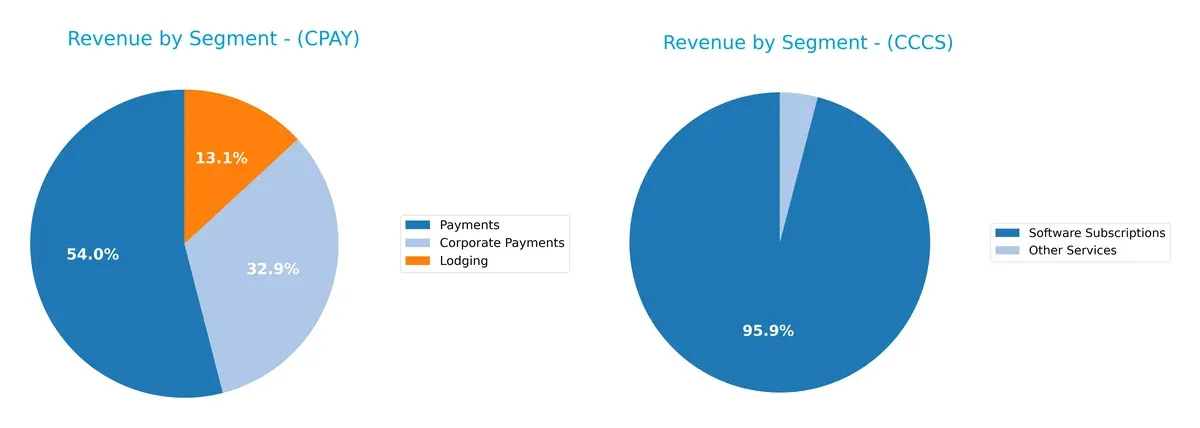
Corpay anchors its revenue in Payments at $2B, with Corporate Payments and Lodging trailing at $1.22B and $489M. This concentration signals strength in transaction processing but poses concentration risk. CCCS, by contrast, pivots on Software Subscriptions at $906M, supplemented by $38M in Other Services. CCCS’s narrower but focused software model suggests an ecosystem lock-in, while Corpay leverages broader transactional infrastructure dominance.
Strengths and Weaknesses Comparison
This table compares the Strengths and Weaknesses of Corpay, Inc. and CCC Intelligent Solutions Holdings Inc.:
Corpay Strengths
- Diversified revenue streams across Payments, Corporate Payments, Lodging
- Favorable net margin (23.62%) and ROE (27.55%)
- Strong presence in US, UK, Brazil
- Favorable fixed asset turnover (9.59)
CCC Intelligent Solutions Strengths
- Strong growth in Software Subscriptions revenue reaching 906M in 2024
- Increasing geographic revenue in Americas over recent years
- Focus on software innovation through subscription model
Corpay Weaknesses
- Unfavorable current ratio (0.98) and debt-to-equity (2.58) ratios
- Unfavorable price-to-book (5.43) and asset turnover (0.17)
- No dividend yield
- Slightly unfavorable overall financial ratio profile
CCC Intelligent Solutions Weaknesses
- Limited geographic diversification concentrated mainly in Americas
- No available financial ratios for profitability or leverage analysis
- Lower revenue scale compared to Corpay with limited segment diversification
Corpay shows solid profitability and geographic reach but faces liquidity and leverage concerns. CCC leads with strong subscription revenue growth but lacks financial transparency and geographic breadth. These differences shape their strategic focus areas.
The Moat Duel: Analyzing Competitive Defensibility
A structural moat shields long-term profits from competitive erosion. Without it, market share and margins erode swiftly:
Corpay, Inc.: Switching Costs Fortified by Payment Ecosystem
Corpay’s primary moat stems from high switching costs embedded in vehicle and corporate payment solutions. Its financials show a strong 2.5% ROIC premium over WACC, though profitability slightly declines. Expansion in international travel payments could deepen this moat in 2026.
CCC Intelligent Solutions Holdings Inc.: AI-Driven Network Effects
CCC’s moat relies on AI-enhanced workflow integration across the insurance economy, creating sticky network effects. While lacking detailed ROIC data, its rapid net margin and revenue growth suggest a strengthening moat. Opportunities lie in expanding cloud and telematics solutions globally.
Switching Costs vs. AI Network Effects: The Moat Showdown
Corpay holds a slightly favorable moat through entrenched switching costs, but its ROIC decline signals caution. CCC’s accelerating growth and AI-driven network effects hint at a potentially wider moat. I view CCC as better positioned to defend and expand market share in a tech-driven landscape.
Which stock offers better returns?
Over the past 12 months, CPAY surged nearly 20%, showing accelerating bullish momentum. CCCS declined sharply by over 31%, with decelerating bearish pressure dominating its price action.
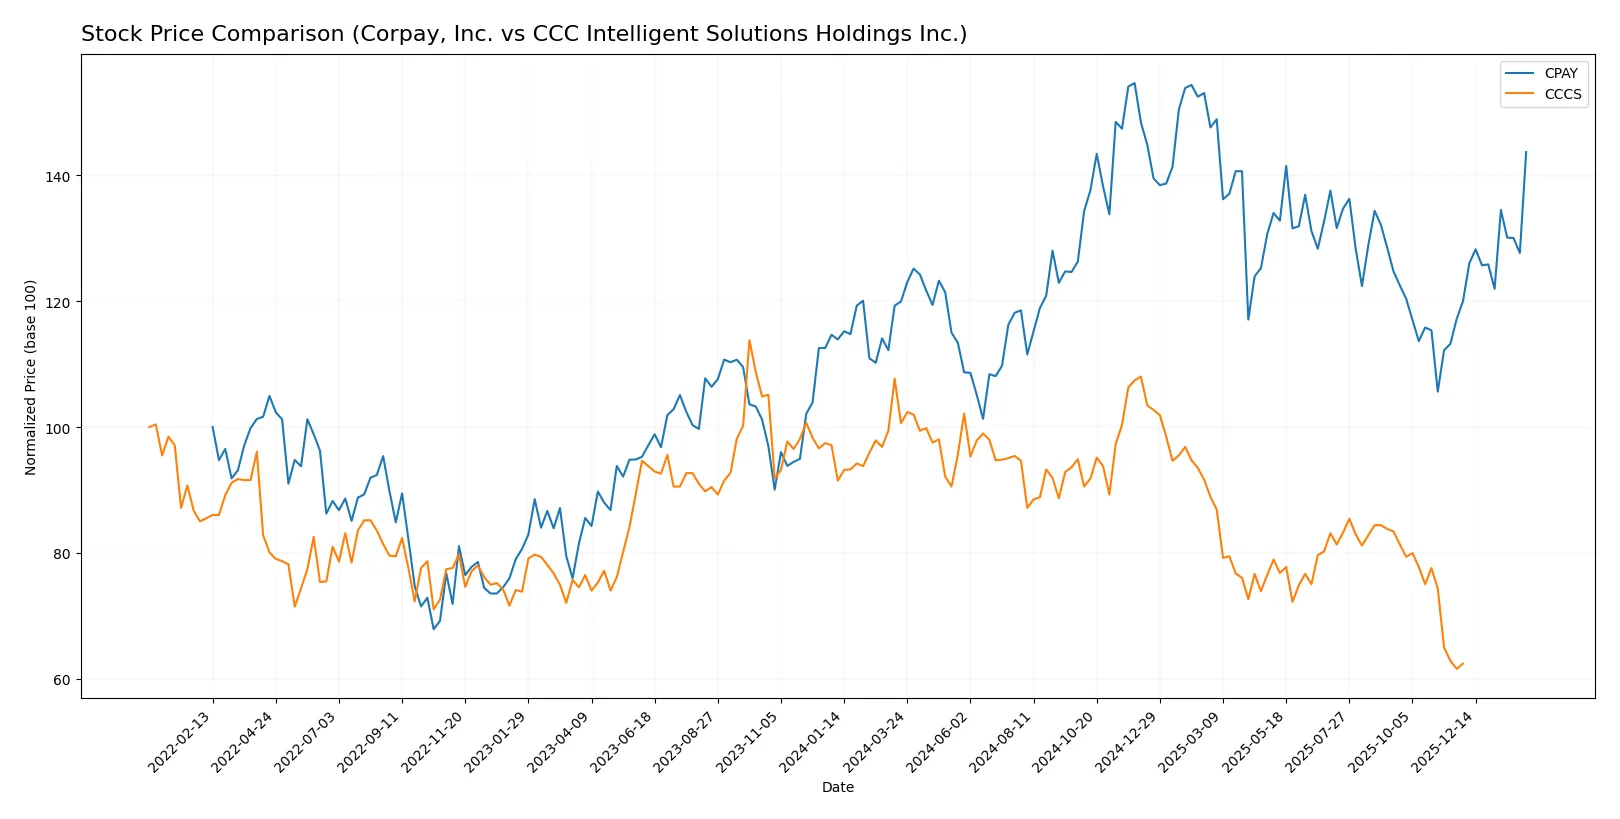
Trend Comparison
CPAY’s stock price rose 19.8% over the past year, marking a bullish trend with accelerating gains and a high volatility of 31.25%. It reached a peak of 381.18 and a low of 249.66.
CCCS fell 31.78% in the same period, reflecting a bearish trend with deceleration. Volatility remained low at 1.24%, with prices ranging between 7.22 and 12.67.
Comparing both, CPAY delivered the highest market performance, outperforming CCCS by nearly 52 percentage points in total price change.
Target Prices
Analysts present a clear consensus on target prices for Corpay, Inc. and CCC Intelligent Solutions Holdings Inc.
| Company | Target Low | Target High | Consensus |
|---|---|---|---|
| Corpay, Inc. | 300 | 390 | 359.33 |
| CCC Intelligent Solutions | 11 | 11 | 11 |
Corpay’s target consensus of 359.33 USD sits just above its current price of 354.19 USD, signaling modest upside. CCC’s flat target at 11 USD contrasts with its current 8.75 USD, indicating meaningful upside potential.

Don’t Let Luck Decide Your Entry Point
Optimize your entry points with our advanced ProRealTime indicators. You’ll get efficient buy signals with precise price targets for maximum performance. Start outperforming now!
How do institutions grade them?
The following grades reflect recent institutional assessments of each company:
Corpay, Inc. Grades
Below is a summary of recent grade actions from recognized financial institutions for Corpay, Inc.
| Grading Company | Action | New Grade | Date |
|---|---|---|---|
| Mizuho | Maintain | Neutral | 2026-02-06 |
| JP Morgan | Maintain | Overweight | 2026-02-05 |
| RBC Capital | Maintain | Sector Perform | 2026-02-05 |
| Morgan Stanley | Maintain | Overweight | 2026-02-05 |
| Morgan Stanley | Upgrade | Overweight | 2026-01-26 |
| Oppenheimer | Maintain | Outperform | 2026-01-12 |
| Oppenheimer | Upgrade | Outperform | 2025-12-05 |
| UBS | Maintain | Neutral | 2025-11-06 |
| RBC Capital | Maintain | Sector Perform | 2025-11-06 |
| JP Morgan | Maintain | Overweight | 2025-11-06 |
CCC Intelligent Solutions Holdings Inc. Grades
No reliable institutional grades were available for CCC Intelligent Solutions Holdings Inc.
Which company has the best grades?
Corpay, Inc. holds a range of grades mostly from “Neutral” to “Outperform,” with multiple upgrades recently. CCC Intelligent Solutions Holdings Inc. has no grades to compare. Investors may view Corpay’s consistent coverage and upward revisions as signals of institutional confidence.
Risks specific to each company
The following categories identify the critical pressure points and systemic threats facing both firms in the 2026 market environment:
1. Market & Competition
Corpay, Inc. (CPAY)
- Operates globally in payments with diversified solutions but faces intense competition in corporate and vehicle payment sectors.
CCC Intelligent Solutions Holdings Inc. (CCCS)
- Focuses on AI and SaaS for insurance economy, a niche with strong growth but increasing rivalry from tech disruptors.
2. Capital Structure & Debt
Corpay, Inc. (CPAY)
- High debt-to-equity ratio (2.58) signals leverage risk; interest coverage is moderate at 4.83.
CCC Intelligent Solutions Holdings Inc. (CCCS)
- Data unavailable; inability to assess leverage increases uncertainty on financial stability.
3. Stock Volatility
Corpay, Inc. (CPAY)
- Beta at 0.808 indicates moderate stock volatility, less than the market average.
CCC Intelligent Solutions Holdings Inc. (CCCS)
- Beta at 0.721 suggests slightly lower volatility, but heavy volume swings raise liquidity risk.
4. Regulatory & Legal
Corpay, Inc. (CPAY)
- Operates across multiple jurisdictions, exposing it to complex payments regulations and compliance costs.
CCC Intelligent Solutions Holdings Inc. (CCCS)
- Insurance economy focus entails regulatory risks tied to data privacy, AI use, and insurance laws.
5. Supply Chain & Operations
Corpay, Inc. (CPAY)
- Extensive operational footprint in payments and travel sectors could face disruptions amid economic shocks.
CCC Intelligent Solutions Holdings Inc. (CCCS)
- Heavy reliance on cloud and AI infrastructure makes it vulnerable to tech outages and cybersecurity threats.
6. ESG & Climate Transition
Corpay, Inc. (CPAY)
- Limited direct ESG impact disclosed; climate transition risks in logistics and fleet payments sectors may increase.
CCC Intelligent Solutions Holdings Inc. (CCCS)
- AI and cloud focus entails moderate ESG risks; energy use and data centers’ carbon footprint require monitoring.
7. Geopolitical Exposure
Corpay, Inc. (CPAY)
- Global operations in US, UK, Brazil expose it to trade tensions, currency fluctuations, and political risks.
CCC Intelligent Solutions Holdings Inc. (CCCS)
- Primarily US-based but global insurance clients may create indirect exposure to geopolitical instability.
Which company shows a better risk-adjusted profile?
Corpay’s critical risk is its high leverage, placing it in financial distress with an Altman Z-Score of 1.59. CCC Intelligent Solutions lacks sufficient financial data but shows moderate bankruptcy risk (Z-Score 2.18) and weaker operational health (Piotroski 3). Corpay’s diversified global presence and moderate volatility offer relative resilience despite debt concerns. CCC’s data gaps and weaker scores raise red flags on transparency and financial stability. I view Corpay as having a better risk-adjusted profile with caution on its leverage, while CCC’s opaque financials and operational weaknesses demand close monitoring.
Final Verdict: Which stock to choose?
Corpay, Inc. (CPAY) excels as a cash machine with robust profitability and a solid economic moat. Its strength lies in efficient capital allocation and high return on equity. A point of vigilance remains its stretched leverage and below-par liquidity. CPAY suits aggressive growth investors willing to tolerate balance sheet risks.
CCC Intelligent Solutions Holdings Inc. (CCCS) offers a strategic moat in recurring revenue and niche market presence. It shows improving income statement metrics and a safer liquidity profile than CPAY. However, it faces operational challenges and slower profitability. CCCS fits investors seeking GARP—growth at a reasonable price—with a focus on stability.
If you prioritize aggressive growth and can accept higher financial risk, CPAY outshines with superior return metrics and market momentum. However, if you seek a more stable investment anchored by recurring revenue and manageable leverage, CCCS offers better stability despite recent bearish trends. Each presents a distinct analytical scenario tailored to different investor profiles.
Disclaimer: Investment carries a risk of loss of initial capital. The past performance is not a reliable indicator of future results. Be sure to understand risks before making an investment decision.
Go Further
I encourage you to read the complete analyses of Corpay, Inc. and CCC Intelligent Solutions Holdings Inc. to enhance your investment decisions: