In the competitive realm of real estate services, CBRE Group, Inc. and CoStar Group, Inc. stand as two influential players driving innovation and market evolution. Both companies operate within overlapping sectors but distinguish themselves through unique service offerings—CBRE with its comprehensive property management and investment services, and CoStar with its cutting-edge real estate data analytics and online marketplaces. This article will guide you in discerning which company holds the most promise for your investment portfolio.

Table of contents
Companies Overview
I will begin the comparison between CBRE Group, Inc. and CoStar Group, Inc. by providing an overview of these two companies and their main differences.
CBRE Overview
CBRE Group, Inc. operates as a global commercial real estate services and investment company. It offers advisory services, global workplace solutions, and real estate investments, serving owners, investors, and occupiers of office, industrial, and retail properties. Founded in 1906 and headquartered in Dallas, Texas, CBRE is a leading player with extensive property management and investment management capabilities worldwide.
CoStar Overview
CoStar Group, Inc. provides information, analytics, and online marketplace services to commercial real estate and related industries across multiple regions, including the US, Europe, and Asia Pacific. Its offerings include property databases, market analytics, lease administration software, and various online marketing platforms. Founded in 1987 and based in Washington, DC, CoStar focuses on data-driven real estate intelligence and digital marketplaces.
Key similarities and differences
Both companies operate within the real estate services sector, targeting commercial real estate markets. CBRE emphasizes comprehensive real estate services including advisory, management, and investment, with a large workforce of 140K employees. CoStar, with 6.6K employees, concentrates on technology-driven solutions such as data analytics, online marketplaces, and software services. CBRE’s business is broader in physical asset management, while CoStar specializes in digital and data services.
Income Statement Comparison
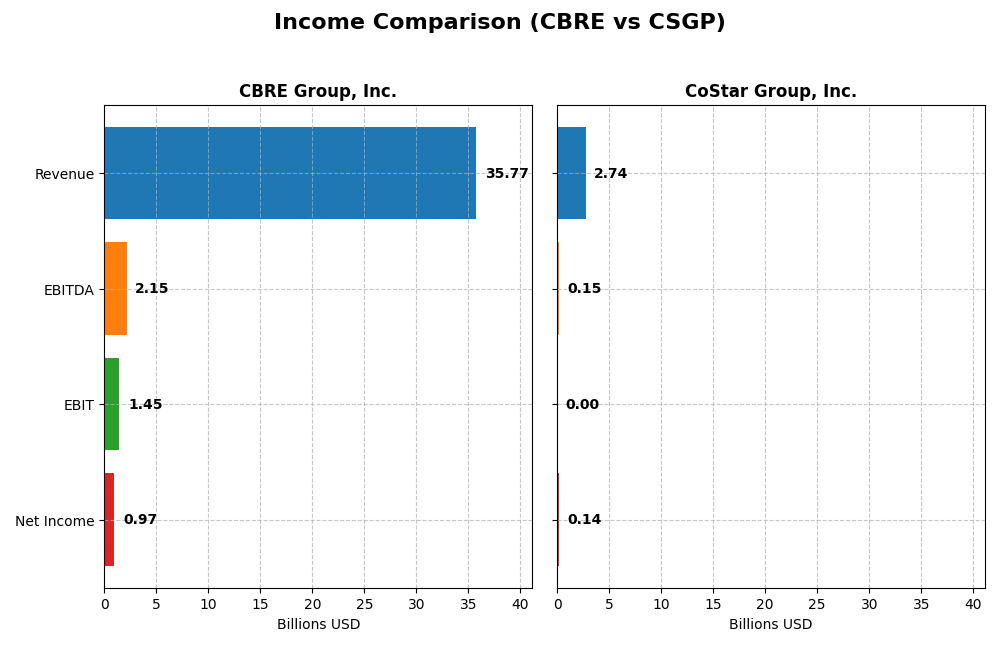
The table below presents a side-by-side comparison of key income statement metrics for CBRE Group, Inc. and CoStar Group, Inc. for the fiscal year 2024.
| Metric | CBRE Group, Inc. | CoStar Group, Inc. |
|---|---|---|
| Market Cap | 49.4B | 26.0B |
| Revenue | 35.8B | 2.7B |
| EBITDA | 2.15B | 152M |
| EBIT | 1.45B | 4.7M |
| Net Income | 968M | 139M |
| EPS | 3.16 | 0.34 |
| Fiscal Year | 2024 | 2024 |
Income Statement Interpretations
CBRE Group, Inc.
CBRE’s revenue steadily increased from $23.8B in 2020 to $35.8B in 2024, with net income rising from $752M to $968M over the same period. Margins remained mostly stable, with a gross margin near 19.6% and a slight decline in net margin to 2.71%. In 2024, revenue growth was strong at 12%, although net margin and EPS slightly declined, indicating margin pressure despite higher sales.
CoStar Group, Inc.
CoStar’s revenue grew from $1.66B in 2020 to $2.74B in 2024, but net income fell significantly from $227M to $139M. The company maintained a high gross margin near 79.6%, yet EBIT margin dropped sharply to 0.17%. In 2024, revenue growth of 11.5% was offset by a drastic decline in EBIT and net margin, reflecting increased expenses and pressure on profitability.
Which one has the stronger fundamentals?
CBRE demonstrates stronger fundamentals with consistent revenue and net income growth over five years and a generally stable margin profile. Conversely, CoStar shows robust revenue growth but suffers from substantial net income and margin declines, indicating operational challenges. CBRE’s income statement evaluation is favorable overall, whereas CoStar’s is unfavorable, reflecting more solid earnings quality at CBRE.
Financial Ratios Comparison
The table below presents a side-by-side comparison of key financial ratios for CBRE Group, Inc. and CoStar Group, Inc., based on their most recent fiscal year data ending 2024.
| Ratios | CBRE Group, Inc. (CBRE) | CoStar Group, Inc. (CSGP) |
|---|---|---|
| ROE | 11.5% | 1.8% |
| ROIC | 7.4% | 0.04% |
| P/E | 41.5 | 209.7 |
| P/B | 4.77 | 3.85 |
| Current Ratio | 1.07 | 8.96 |
| Quick Ratio | 1.07 | 8.96 |
| D/E (Debt-to-Equity) | 0.68 | 0.14 |
| Debt-to-Assets | 23.4% | 11.3% |
| Interest Coverage | 6.57 | 0.17 |
| Asset Turnover | 1.47 | 0.30 |
| Fixed Asset Turnover | 16.9 | 2.45 |
| Payout ratio | 0 | 0 |
| Dividend yield | 0% | 0% |
Interpretation of the Ratios
CBRE Group, Inc.
CBRE shows a slightly favorable overall ratio profile, with strengths in quick ratio, debt to assets, interest coverage, and asset turnover indicating operational efficiency and manageable leverage. However, concerns arise from unfavorable net margin, price-to-earnings, and price-to-book ratios, suggesting valuation and profitability pressures. The company does not pay dividends, reflecting a possible reinvestment strategy or focus on growth rather than shareholder payouts.
CoStar Group, Inc.
CoStar Group’s ratios reflect an unfavorable financial position with weak returns on equity and invested capital, combined with a very high price-to-earnings ratio raising valuation concerns. The company’s strong quick ratio and low debt level contrast with poor interest coverage and asset turnover, indicating operational challenges. Like CBRE, CoStar does not pay dividends, likely prioritizing reinvestment and expansion in a competitive market.
Which one has the best ratios?
CBRE presents a more balanced set of financial ratios, with a higher proportion of favorable metrics and better operational efficiency compared to CoStar Group. CoStar’s unfavorable profitability indicators and extreme valuation metrics weigh heavily against it. Overall, CBRE’s slightly favorable profile contrasts with CoStar’s unfavorable ratio evaluation in this period.
Strategic Positioning
This section compares the strategic positioning of CBRE and CSGP, including market position, key segments, and exposure to technological disruption:
CBRE
- Leading global commercial real estate services provider facing intense competitive pressure.
- Diversified segments: Advisory, Global Workplace Solutions, and Real Estate Investments.
- Moderate exposure to technology with traditional real estate services complemented by tech.
CSGP
- Major real estate information and analytics provider with competitive pressure in digital services.
- Focused on information services, online marketplaces, and multifamily residential sectors.
- High exposure to technological disruption through data analytics and online marketplace platforms.
CBRE vs CSGP Positioning
CBRE adopts a diversified approach across real estate services and investments, offering stability but facing broad market pressures. CSGP concentrates on technology-driven information and marketplace solutions, with potential vulnerability from tech trends and competition.
Which has the best competitive advantage?
Both companies are shedding value, but CBRE shows a slightly unfavorable moat with improving profitability, whereas CSGP faces a very unfavorable moat with declining profitability, indicating weaker competitive advantage.
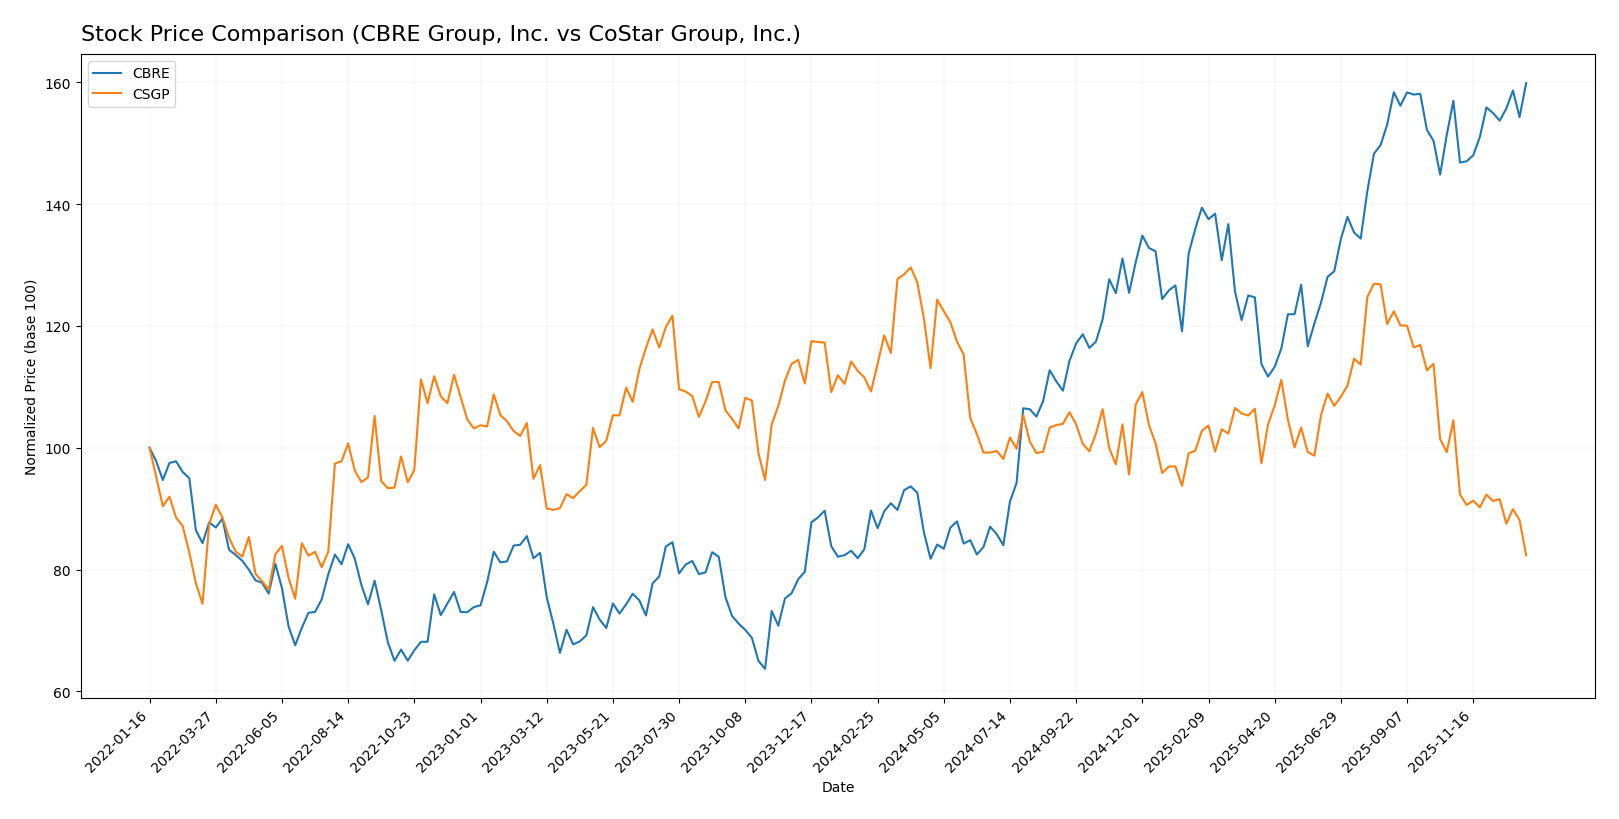
Stock Comparison
The stock price chart highlights significant divergence over the past 12 months, with CBRE Group, Inc. showing a strong upward trajectory and CoStar Group, Inc. experiencing a marked decline, reflecting contrasting trading dynamics.
Trend Analysis
CBRE Group, Inc. demonstrated a bullish trend over the past year with a 78.2% price increase, an acceleration in trend, and notable volatility at a 24.74 std deviation, peaking at 165.96 and bottoming at 84.9.
CoStar Group, Inc. exhibited a bearish trend over the same period, with a 24.62% price decrease and deceleration, accompanied by lower volatility at a 7.76 std deviation and price fluctuating between 96.6 and 61.36.
Comparing both, CBRE outperformed CoStar substantially in market performance over the past year, showing strong growth while CoStar declined, revealing contrasting investor sentiment and trading outcomes.
Target Prices
The current analyst consensus presents a cautiously optimistic outlook for both CBRE Group, Inc. and CoStar Group, Inc.
| Company | Target High | Target Low | Consensus |
|---|---|---|---|
| CBRE Group, Inc. | 185 | 175 | 180 |
| CoStar Group, Inc. | 105 | 55 | 74.33 |
Analysts expect CBRE’s price to rise modestly above the current 166 USD, while CoStar’s consensus target suggests potential upside from its current 61.36 USD, though with higher volatility risk given the wide target range.
Analyst Opinions Comparison
This section compares analysts’ ratings and grades for CBRE and CSGP:
Rating Comparison
CBRE Rating
- Rating: CBRE holds a B rating, indicating a very favorable status.
- Discounted Cash Flow Score: Moderate score of 3 reflects balanced valuation based on future cash flows.
- ROE Score: Very favorable score of 5 indicates efficient profit generation from equity.
- ROA Score: Favorable score of 4 indicates effective asset utilization.
- Debt To Equity Score: Moderate score of 2 suggests a balanced but moderate financial risk.
- Overall Score: Moderate score of 3 summarizes overall financial standing.
CSGP Rating
- Rating: CSGP holds a B- rating, also considered very favorable.
- Discounted Cash Flow Score: Favorable score of 4 shows a stronger valuation outlook.
- ROE Score: Moderate score of 2 shows less efficiency in generating equity profit.
- ROA Score: Moderate score of 2 shows weaker asset utilization.
- Debt To Equity Score: Favorable score of 4 indicates stronger balance sheet health.
- Overall Score: Moderate score of 2 reflects a slightly lower overall financial position.
Which one is the best rated?
Based on the provided data, CBRE has a higher overall score (3 vs. 2) and outperforms CSGP in ROE and ROA scores, while CSGP scores better on discounted cash flow and debt-to-equity metrics. CBRE is generally better rated overall.
Scores Comparison
Here is a comparison of the Altman Z-Score and Piotroski Score for CBRE and CSGP:
CBRE Scores
- Altman Z-Score: 3.5, indicating a safe zone with low bankruptcy risk.
- Piotroski Score: 7, assessed as strong financial health.
CSGP Scores
- Altman Z-Score: 8.53, well within the safe zone, showing very low bankruptcy risk.
- Piotroski Score: 5, indicating average financial strength.
Which company has the best scores?
Based on the provided data, CSGP has a notably higher Altman Z-Score, indicating stronger financial stability, while CBRE has a higher Piotroski Score, reflecting better overall financial health.
Grades Comparison
The grades comparison for CBRE Group, Inc. and CoStar Group, Inc. is as follows:
CBRE Group, Inc. Grades
Below is a summary of recent grades issued by recognized grading companies for CBRE Group, Inc.:
| Grading Company | Action | New Grade | Date |
|---|---|---|---|
| Keefe, Bruyette & Woods | Upgrade | Outperform | 2025-12-15 |
| UBS | Maintain | Neutral | 2025-10-24 |
| UBS | Maintain | Neutral | 2025-10-10 |
| Keefe, Bruyette & Woods | Maintain | Market Perform | 2025-10-09 |
| Morgan Stanley | Maintain | Overweight | 2025-10-07 |
| JP Morgan | Maintain | Overweight | 2025-08-26 |
| Evercore ISI Group | Maintain | Outperform | 2025-08-25 |
| Evercore ISI Group | Maintain | Outperform | 2025-07-30 |
| Keefe, Bruyette & Woods | Maintain | Market Perform | 2025-07-24 |
| Raymond James | Maintain | Outperform | 2025-07-24 |
The overall trend for CBRE shows a stable to positive outlook, with multiple “Outperform” and “Overweight” ratings and a recent upgrade to “Outperform.”
CoStar Group, Inc. Grades
Below is a summary of recent grades issued by recognized grading companies for CoStar Group, Inc.:
| Grading Company | Action | New Grade | Date |
|---|---|---|---|
| Needham | Maintain | Buy | 2025-12-08 |
| Wells Fargo | Maintain | Underweight | 2025-11-17 |
| RBC Capital | Maintain | Sector Perform | 2025-10-09 |
| Citigroup | Maintain | Buy | 2025-07-24 |
| Baird | Maintain | Outperform | 2025-07-23 |
| BMO Capital | Maintain | Market Perform | 2025-07-23 |
| RBC Capital | Maintain | Sector Perform | 2025-07-23 |
| JP Morgan | Maintain | Overweight | 2025-07-23 |
| Needham | Maintain | Buy | 2025-07-23 |
| Keefe, Bruyette & Woods | Maintain | Outperform | 2025-07-17 |
CoStar Group’s grading reflects a mixed but generally positive position, including several “Buy” and “Outperform” ratings counterbalanced by some “Underweight” and “Sector Perform.”
Which company has the best grades?
Both CBRE and CoStar Group have received predominantly positive grades, with CBRE showing a recent upgrade to “Outperform” and consistent “Outperform” and “Overweight” ratings. CoStar Group displays a broader range of ratings, including some cautionary “Underweight” calls. Investors may interpret CBRE’s grades as slightly more favorable, potentially indicating a stronger consensus on growth prospects.
Strengths and Weaknesses
Below is a comparative table highlighting key strengths and weaknesses of CBRE Group, Inc. and CoStar Group, Inc. based on their diversification, profitability, innovation, global presence, and market share as of 2026.
| Criterion | CBRE Group, Inc. | CoStar Group, Inc. |
|---|---|---|
| Diversification | Strong across advisory, workplace solutions (25B), and investments (1B) segments | Moderate; focused on information services and online marketplaces totaling about 1.7B |
| Profitability | Slightly unfavorable net margin (2.7%), neutral ROIC (7.4%), but growing profitability trend | Unfavorable profitability; very low ROIC (0.04%), declining trend, high PE (210) |
| Innovation | Established in traditional real estate services with digital enhancements | Strong innovation in digital real estate data and marketplaces |
| Global presence | Extensive global operations with broad service offerings | Primarily US-focused but expanding digital footprint |
| Market Share | Leading in global real estate services with diversified revenue streams | Significant in real estate data and online marketplaces, but narrower scope |
Key takeaways: CBRE offers diversified services with improving profitability despite current slight value destruction, making it relatively stable. CoStar shows innovative digital offerings but suffers from declining profitability and value loss, posing higher risk for investors.
Risk Analysis
Below is a comparative table highlighting key risk factors for CBRE Group, Inc. and CoStar Group, Inc. based on the most recent 2024 data:
| Metric | CBRE Group, Inc. | CoStar Group, Inc. |
|---|---|---|
| Market Risk | Moderate (Beta 1.345) | Lower (Beta 0.841) |
| Debt level | Moderate (Debt/Equity 0.68) | Low (Debt/Equity 0.14) |
| Regulatory Risk | Moderate (Real estate services) | Moderate (Data & analytics sector) |
| Operational Risk | Moderate (Large, complex operations) | Moderate (Tech and data dependency) |
| Environmental Risk | Moderate (Real estate exposure) | Low to Moderate (Digital focus) |
| Geopolitical Risk | Moderate (Global presence) | Moderate (International markets) |
The most likely and impactful risks are CBRE’s higher market volatility and operational complexity, while CoStar faces challenges from its high P/E valuation and lower profitability metrics. Both companies maintain safe financial zones, but investors should watch CBRE’s leverage and CoStar’s operational efficiency closely.
Which Stock to Choose?
CBRE Group, Inc. shows a favorable income statement with 57% positive metrics and 12% revenue growth in the last year. Its financial ratios are slightly favorable overall, with solid profitability and manageable debt. The company carries a very favorable “B” rating and demonstrates a slightly unfavorable economic moat due to ROIC below WACC but improving profitability.
CoStar Group, Inc. presents an unfavorable income evaluation, with significant declines in net income and EPS despite strong revenue growth. Its financial ratios are largely unfavorable, reflecting low returns and high valuation multiples. The firm holds a very favorable “B-” rating, yet its economic moat is very unfavorable, exhibiting value destruction and declining profitability.
For investors prioritizing stable income growth and moderate financial health, CBRE may appear more favorable given its improving profitability and stronger ratio profile. Conversely, those focusing on high growth potential despite profitability challenges might find CoStar’s profile suggestive of a more risk-tolerant, growth-oriented strategy. Overall, CBRE’s rating and income trends suggest a more balanced financial standing compared to CoStar’s uneven performance.
Disclaimer: Investment carries a risk of loss of initial capital. The past performance is not a reliable indicator of future results. Be sure to understand risks before making an investment decision.
Go Further
I encourage you to read the complete analyses of CBRE Group, Inc. and CoStar Group, Inc. to enhance your investment decisions: