Home > Comparison > Financial Services > SPGI vs CBOE
The strategic rivalry between S&P Global Inc. and Cboe Global Markets, Inc. shapes the financial data and exchange landscape. S&P Global operates as a diversified financial services powerhouse, offering credit ratings, indices, and analytics. In contrast, Cboe focuses on options and derivatives trading with broad geographic reach. This analysis explores which company’s operational model delivers superior risk-adjusted returns for a diversified portfolio in an evolving market environment.
Table of contents
Companies Overview
S&P Global Inc. and Cboe Global Markets, Inc. stand as pivotal players in financial data and trading infrastructure.
S&P Global Inc.: The Benchmark and Analytics Powerhouse
S&P Global Inc. dominates the financial data and analytics sector through credit ratings, indices, and market intelligence. It generates revenue by providing credit ratings, benchmarks, and workflow solutions across global markets. In 2026, its strategic focus remains on expanding data-driven insights to empower capital, commodity, and automotive sectors.
Cboe Global Markets, Inc.: The Options and Exchange Specialist
Cboe Global Markets, Inc. leads in options and derivatives trading worldwide. It earns primarily from trading options, equities, futures, and FX across multiple regions. In 2026, Cboe emphasizes broadening its global exchange services and leveraging strategic partnerships to enhance its multi-asset trading platforms.
Strategic Collision: Similarities & Divergences
Both companies excel in financial market infrastructure but differ fundamentally. S&P Global builds a data-centric ecosystem focused on analytics and benchmarks, while Cboe operates an exchange-driven model prioritizing market liquidity and trading volumes. Their rivalry centers on serving institutional investors’ need for market transparency versus execution. Each offers a distinct risk-return profile shaped by their unique operational moats.
Income Statement Comparison
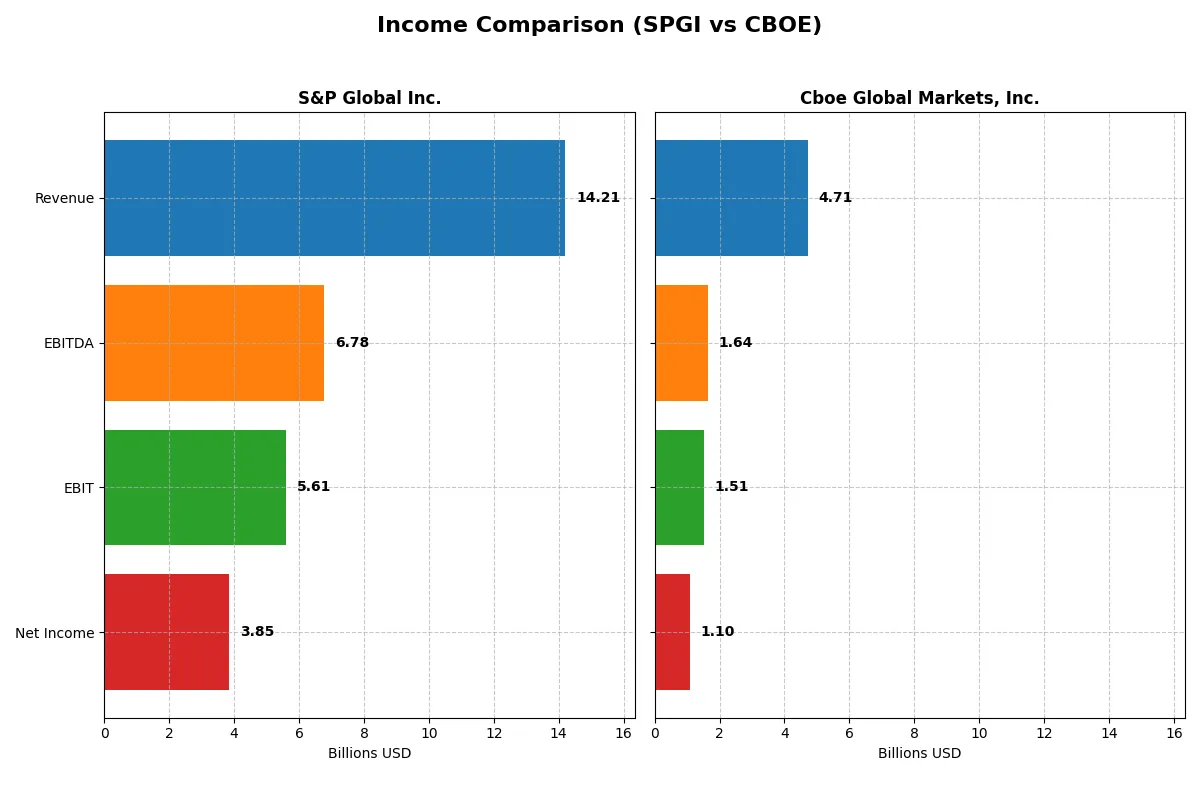
The following data dissects the core profitability and scalability of both corporate engines to reveal who dominates the bottom line:
| Metric | S&P Global Inc. (SPGI) | Cboe Global Markets, Inc. (CBOE) |
|---|---|---|
| Revenue | 14.2B | 4.7B |
| Cost of Revenue | 4.4B | 2.4B |
| Operating Expenses | 4.2B | 0.7B |
| Gross Profit | 9.8B | 2.3B |
| EBITDA | 6.8B | 1.6B |
| EBIT | 5.6B | 1.5B |
| Interest Expense | 0.3B | -0.05B |
| Net Income | 3.9B | 1.1B |
| EPS | 12.36 | 10.46 |
| Fiscal Year | 2024 | 2025 |
Income Statement Analysis: The Bottom-Line Duel
This income statement comparison reveals which company drives superior efficiency and profitability through its core business operations.
S&P Global Inc. Analysis
S&P Global’s revenue surged from 7.4B in 2020 to 14.2B in 2024, with net income growing from 2.3B to 3.9B. The firm sustains a robust gross margin around 69%, and a net margin exceeding 27%. In 2024, operating income jumped 39.9%, signaling strong momentum and operational leverage.
Cboe Global Markets, Inc. Analysis
Cboe’s revenue rose steadily from 3.5B in 2021 to 4.7B in 2025, with net income expanding from 529M to 1.1B. Its gross margin improved to nearly 49%, and net margin reached 23.3%. The 2025 results show a 15.1% revenue growth paired with a 33.4% increase in EBIT, reflecting accelerated profitability.
Margin Leadership vs. Growth Momentum
S&P Global commands superior margins, with a gross margin 20 points higher than Cboe’s, driving higher absolute profits. However, Cboe exhibits faster net income growth and margin expansion, doubling its net income since 2021. For investors, S&P’s profile suits those prioritizing margin dominance and scale, while Cboe appeals to growth-focused portfolios.
Financial Ratios Comparison
These vital ratios act as a diagnostic tool to expose the underlying fiscal health, valuation premiums, and capital efficiency of the companies compared below:
| Ratios | S&P Global Inc. (SPGI) | Cboe Global Markets, Inc. (CBOE) |
|---|---|---|
| ROE | 11.6% | 21.4% |
| ROIC | 8.1% | 15.3% |
| P/E | 40.3 | 23.9 |
| P/B | 4.68 | 5.11 |
| Current Ratio | 0.85 | 1.87 |
| Quick Ratio | 0.85 | 1.87 |
| D/E | 0.36 | 0.33 |
| Debt-to-Assets | 19.8% | 18.1% |
| Interest Coverage | 18.8 | -29.0 (negative) |
| Asset Turnover | 0.24 | 0.51 |
| Fixed Asset Turnover | 21.0 | 19.3 |
| Payout ratio | 29.4% | 25.7% |
| Dividend yield | 0.73% | 1.08% |
| Fiscal Year | 2024 | 2025 |
Efficiency & Valuation Duel: The Vital Signs
Financial ratios act as a company’s DNA, revealing hidden risks and operational strengths that drive long-term value creation.
S&P Global Inc.
S&P Global posts a solid 27.11% net margin but a modest 11.62% ROE, indicating average profitability. Its 40.29 P/E ratio signals an expensive valuation relative to earnings. The company returns value modestly with a 0.73% dividend yield, balancing dividends and reinvestment amid neutral ROIC and WACC dynamics.
Cboe Global Markets, Inc.
Cboe demonstrates robust profitability with a 21.41% ROE and a healthy 23.33% net margin. Its 23.89 P/E ratio suggests a fairly valued stock compared to peers. The firm maintains a 1.08% dividend yield and a strong capital efficiency profile, supported by favorable ROIC and low WACC, pointing to effective shareholder returns.
Premium Valuation vs. Operational Safety
Cboe offers a superior blend of profitability, valuation, and financial health, with more favorable ratios overall. S&P Global’s premium valuation carries higher risk with average returns. Growth-oriented investors may prefer S&P, while those seeking operational safety and balanced returns might lean toward Cboe.
Which one offers the Superior Shareholder Reward?
I compare S&P Global Inc. (SPGI) and Cboe Global Markets, Inc. (CBOE) on shareholder distributions. SPGI yields 0.73% with a 29% payout ratio, covered comfortably by FCF (98%). Its buybacks are robust, supporting total returns. CBOE pays a higher 1.08% yield with a 26% payout ratio, also sustainable. However, CBOE’s buyback data is limited, slightly obscuring total return impact. SPGI’s distribution combines dividends and aggressive buybacks, backed by strong FCF margins and operating cash. CBOE delivers a steadier dividend yield but invests less visibly in buybacks. I see SPGI’s model as more sustainable and rewarding for 2026 investors seeking growth plus income.
Comparative Score Analysis: The Strategic Profile
The radar chart reveals the fundamental DNA and trade-offs of both firms, highlighting their strategic strengths and vulnerabilities:
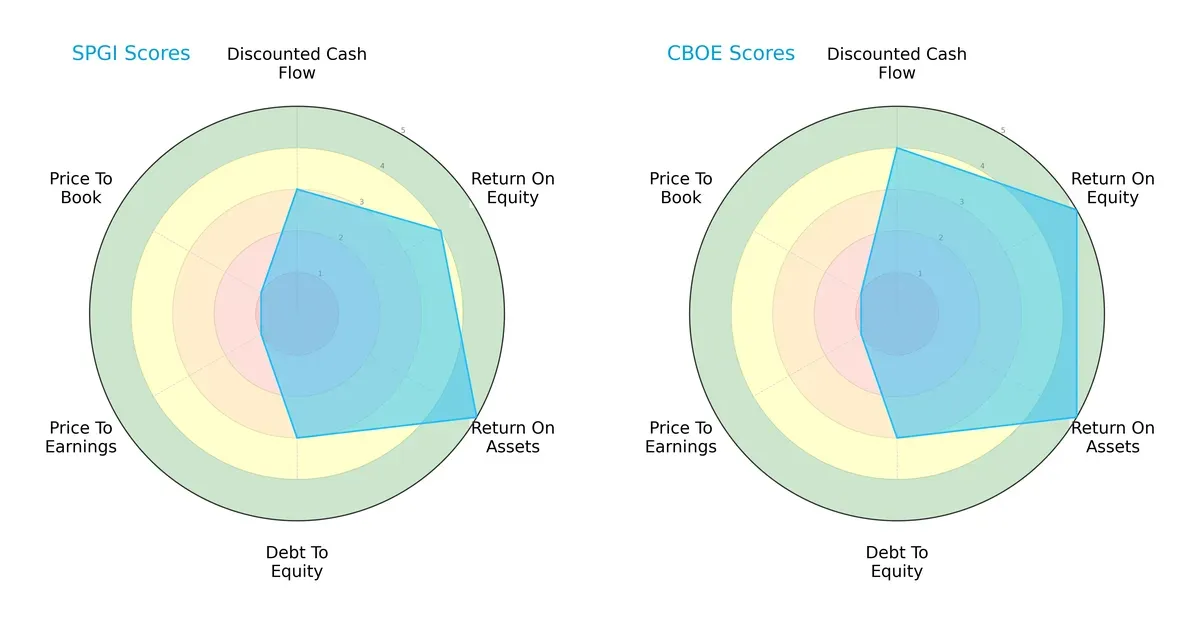
S&P Global Inc. presents a balanced profile with strong asset utilization (ROA score 5) and solid return on equity (ROE score 4). Cboe Global Markets, Inc. edges ahead with superior profitability (ROE 5) and discounted cash flow scores (4), indicating a sharper growth outlook. Both firms share moderate leverage (Debt/Equity 3) but suffer from very unfavorable valuation metrics (PE/PB scores 1), reflecting market skepticism or overvaluation risk.
Bankruptcy Risk: Solvency Showdown
The Altman Z-Score difference favors Cboe, indicating a marginally stronger solvency position and lower bankruptcy risk in this economic cycle:
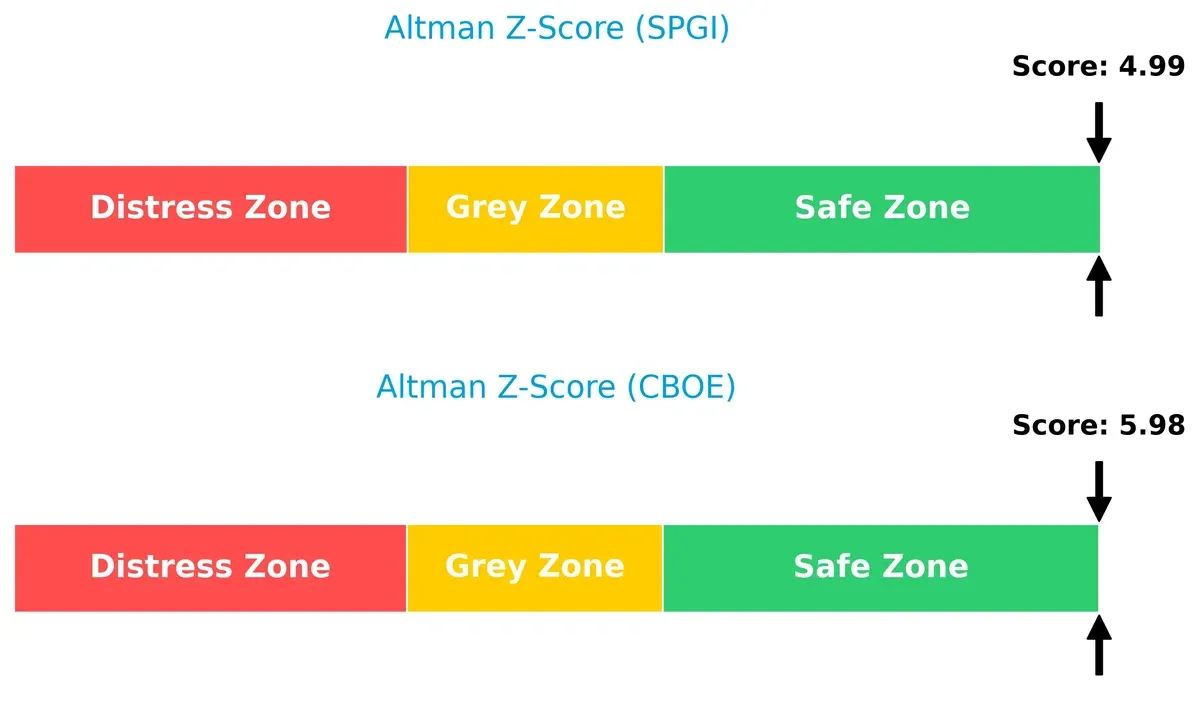
Cboe scores 5.98, comfortably in the safe zone, while S&P Global scores 4.99, also safe but with slightly higher financial risk. Both companies demonstrate strong long-term survival potential, but Cboe’s higher score suggests a firmer buffer against economic downturns.
Financial Health: Quality of Operations
S&P Global’s Piotroski F-Score of 9 signals peak financial health, outperforming Cboe’s strong but lower score of 7:
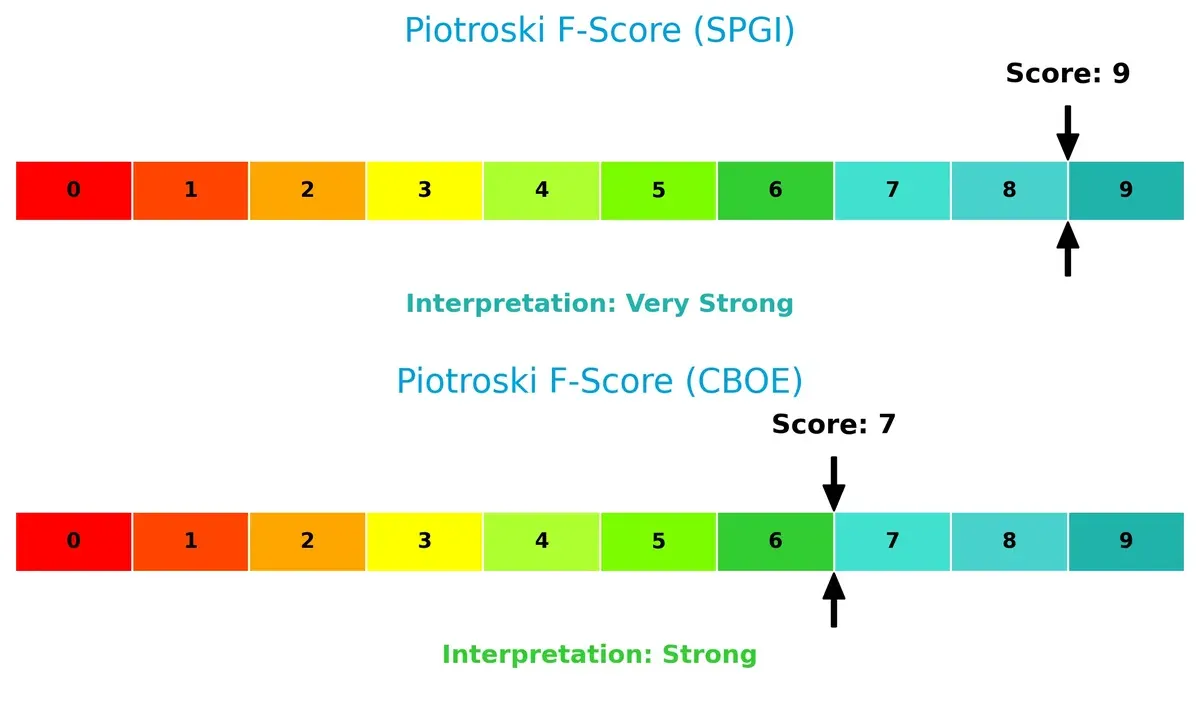
S&P Global excels in operational efficiency and profitability metrics, showing no red flags. Cboe’s score, while robust, indicates some room for improvement in internal financial controls or asset management. Investors should weigh S&P Global’s superior financial quality against Cboe’s growth advantages.
How are the two companies positioned?
This section dissects the operational DNA of S&P Global and Cboe by comparing their revenue distribution by segment alongside internal strengths and weaknesses. The goal is to confront their economic moats to identify which model delivers the most resilient, sustainable competitive advantage today.
Revenue Segmentation: The Strategic Mix
This visual comparison dissects how S&P Global Inc. and Cboe Global Markets diversify income streams and reveals their primary sector bets:
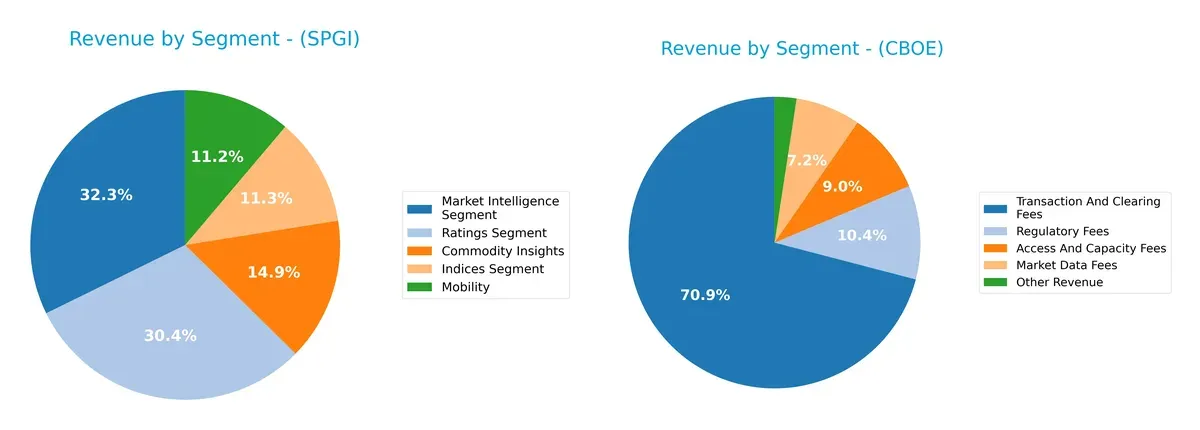
S&P Global anchors revenue in Market Intelligence at $4.65B and Ratings at $4.37B, showing a balanced portfolio across five segments. Cboe relies heavily on Transaction and Clearing Fees at $2.9B, dwarfing its other streams. S&P’s diversified mix reduces concentration risk, fostering resilience. Cboe’s dominant segment signals infrastructure dominance but raises exposure to regulatory or market volatility impacts.
Strengths and Weaknesses Comparison
This table compares the Strengths and Weaknesses of S&P Global Inc. and Cboe Global Markets, Inc.:
S&P Global Inc. Strengths
- Diverse revenue streams across five segments
- Favorable net margin at 27.11%
- Strong debt management with low debt-to-assets at 19.82%
- High interest coverage ratio at 18.87
- Significant US and Europe revenue base
Cboe Global Markets Strengths
- Favorable profitability metrics: ROE 21.41%, ROIC 15.31%, WACC 5.28%
- Strong current and quick ratios at 1.87
- Favorable fixed asset turnover at 19.31
- Lower PE ratio at 23.89 supports valuation neutrality
S&P Global Inc. Weaknesses
- Unfavorable valuation multiples: PE 40.29, PB 4.68
- Low current ratio at 0.85 signals liquidity risk
- Neutral ROE and ROIC near cost of capital
- Unfavorable asset turnover at 0.24
- Low dividend yield at 0.73%
Cboe Global Markets Weaknesses
- Negative interest coverage ratio at -28.95 indicates potential financial distress
- Unfavorable PB ratio at 5.11
- Moderate asset turnover at 0.51 flagged as neutral
- Dividend yield neutral at 1.08%
S&P Global shows diversified revenue and solid debt metrics but faces liquidity and valuation challenges. Cboe excels in profitability and liquidity but must address its negative interest coverage. These factors shape each company’s strategic financial priorities going forward.
The Moat Duel: Analyzing Competitive Defensibility
A structural moat is the only thing protecting long-term profits from the erosion of competition. Let’s dissect the moats of these two financial data giants:
S&P Global Inc.: Intangible Assets and Brand Authority
S&P Global’s moat stems from its trusted credit ratings and benchmarks, reflected in stable margins near 40% EBIT and strong revenue growth. However, declining ROIC signals a weakening moat in 2026 amid intensifying competition.
Cboe Global Markets, Inc.: Network Effects and Market Liquidity
Cboe leverages network effects through its options and futures exchanges, driving a rising ROIC over WACC by 10%, with profitability and market share expanding in 2026. This moat deepens as global derivatives trading grows.
Verdict: Intangible Assets vs. Network Effects
Cboe’s growing ROIC and expanding network effects create a wider, more durable moat than S&P Global’s eroding intangible asset advantage. Cboe is better positioned to defend and grow its market share.
Which stock offers better returns?
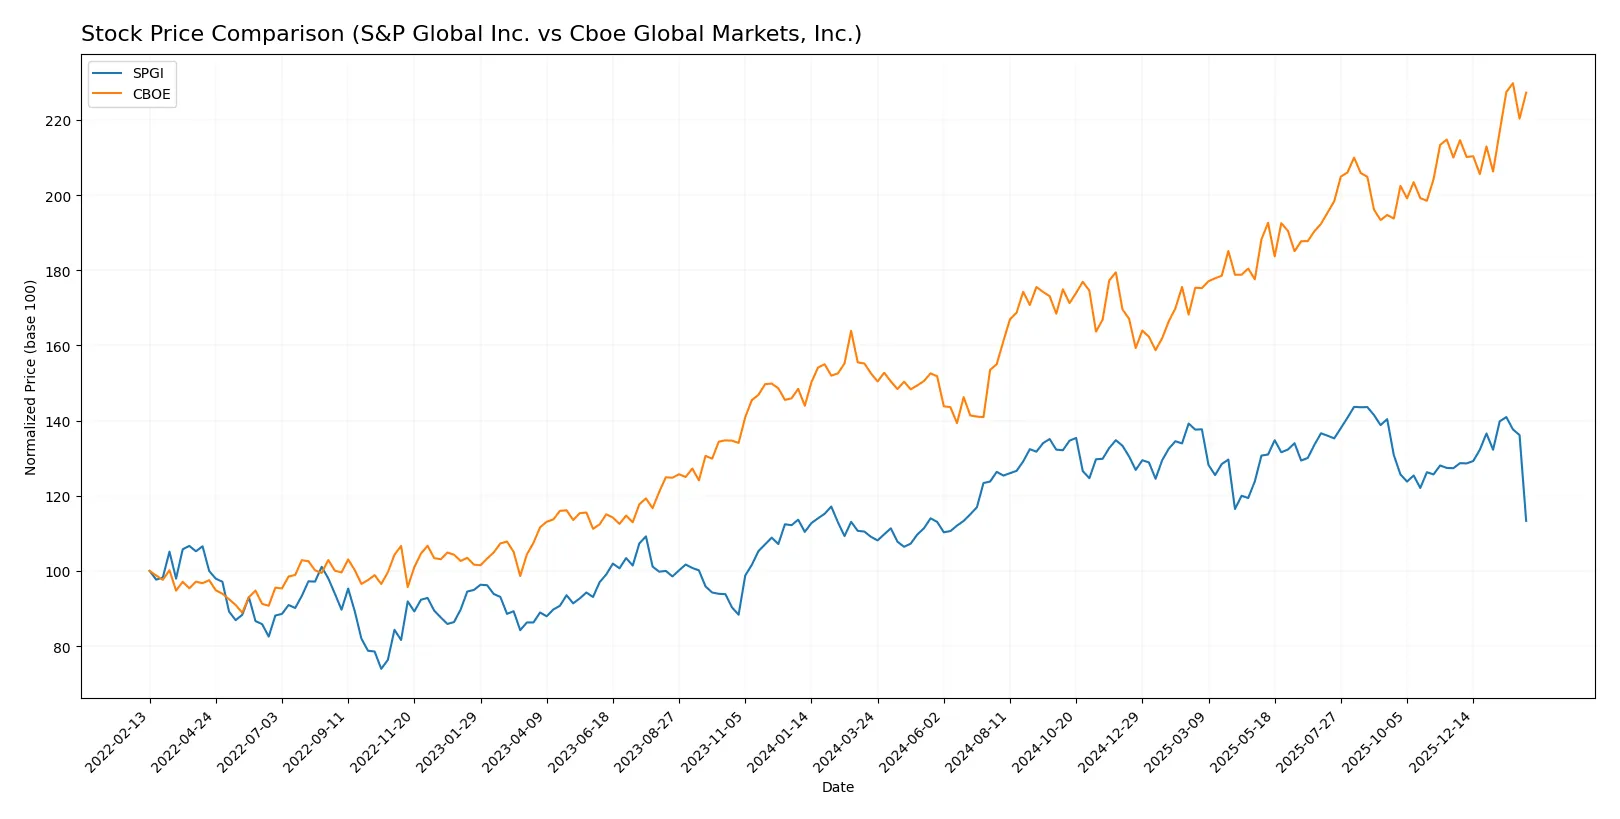
Over the past year, both stocks showed strong upward momentum, with Cboe Global Markets accelerating significantly and S&P Global decelerating after initial gains.
Trend Comparison
S&P Global’s stock rose 3.9% over the past year, indicating a bullish trend with decelerating momentum. The price ranged between 412.56 and 556.87, showing moderate volatility (std. dev. 36.57).
Cboe Global Markets surged 48.95% in the same period, demonstrating a bullish trend with accelerating momentum. Its price fluctuated between 167.6 and 276.39, with lower volatility (std. dev. 27.47).
Cboe Global Markets outperformed S&P Global, delivering the highest market return and stronger upward acceleration over the past year.
Target Prices
Analysts present a bullish consensus for both S&P Global Inc. and Cboe Global Markets, Inc., suggesting upside potential from current prices.
| Company | Target Low | Target High | Consensus |
|---|---|---|---|
| S&P Global Inc. | 540 | 643 | 604.67 |
| Cboe Global Markets, Inc. | 240 | 295 | 274 |
The consensus target for S&P Global exceeds its current price of 439.28 by nearly 38%, signaling strong growth expectations. Cboe’s target consensus slightly surpasses its 273.09 price, implying modest upside potential.

Don’t Let Luck Decide Your Entry Point
Optimize your entry points with our advanced ProRealTime indicators. You’ll get efficient buy signals with precise price targets for maximum performance. Start outperforming now!
How do institutions grade them?
S&P Global Inc. Grades
The following table summarizes recent institutional grades for S&P Global Inc.:
| Grading Company | Action | New Grade | Date |
|---|---|---|---|
| Morgan Stanley | Maintain | Overweight | 2026-01-13 |
| Evercore ISI Group | Maintain | Outperform | 2026-01-08 |
| JP Morgan | Maintain | Overweight | 2025-10-31 |
| Stifel | Maintain | Buy | 2025-10-31 |
| Evercore ISI Group | Maintain | Outperform | 2025-10-31 |
| BMO Capital | Maintain | Outperform | 2025-10-16 |
| Mizuho | Maintain | Outperform | 2025-10-16 |
| Evercore ISI Group | Maintain | Outperform | 2025-10-14 |
| Morgan Stanley | Maintain | Overweight | 2025-10-09 |
| Wells Fargo | Maintain | Overweight | 2025-09-19 |
Cboe Global Markets, Inc. Grades
The following table summarizes recent institutional grades for Cboe Global Markets, Inc.:
| Grading Company | Action | New Grade | Date |
|---|---|---|---|
| TD Cowen | Maintain | Hold | 2026-01-14 |
| Piper Sandler | Maintain | Overweight | 2026-01-14 |
| Barclays | Maintain | Overweight | 2026-01-08 |
| UBS | Maintain | Neutral | 2026-01-07 |
| Morgan Stanley | Maintain | Underweight | 2025-12-22 |
| Barclays | Upgrade | Overweight | 2025-12-12 |
| Barclays | Maintain | Equal Weight | 2025-11-03 |
| Keefe, Bruyette & Woods | Maintain | Market Perform | 2025-11-03 |
| Citigroup | Maintain | Neutral | 2025-11-03 |
| UBS | Maintain | Neutral | 2025-11-03 |
Which company has the best grades?
S&P Global consistently receives higher grades, mostly “Outperform,” “Overweight,” and “Buy,” reflecting stronger analyst confidence. Cboe’s grades are mixed, with several “Hold” and “Neutral” ratings, indicating more cautious sentiment. This disparity may influence investor perception and portfolio weighting decisions.
Risks specific to each company
The following categories identify the critical pressure points and systemic threats facing both firms in the 2026 market environment:
1. Market & Competition
S&P Global Inc.
- Faces intense competition in data analytics and credit ratings, with pressure on pricing and market share.
Cboe Global Markets, Inc.
- Operates in niche derivatives and options markets but competes with global exchanges and fintech entrants.
2. Capital Structure & Debt
S&P Global Inc.
- Maintains moderate leverage (D/E 0.36) with strong interest coverage (18.87x), signaling financial stability.
Cboe Global Markets, Inc.
- Similar leverage (D/E 0.33) but negative interest coverage (-28.95) raises red flags on debt servicing capability.
3. Stock Volatility
S&P Global Inc.
- Beta of 1.20 indicates higher sensitivity to market swings, increasing volatility risk.
Cboe Global Markets, Inc.
- Low beta of 0.36 suggests defensive characteristics and lower stock price volatility.
4. Regulatory & Legal
S&P Global Inc.
- Subject to stringent regulations in credit ratings and market data dissemination.
Cboe Global Markets, Inc.
- Faces regulatory scrutiny on derivatives and options trading, with evolving global compliance demands.
5. Supply Chain & Operations
S&P Global Inc.
- Relies on data integrity and technology infrastructure; operational disruptions could harm client trust.
Cboe Global Markets, Inc.
- Technology-dependent exchange operations require robust risk management to prevent trading system failures.
6. ESG & Climate Transition
S&P Global Inc.
- Invests heavily in ESG data solutions, aligning with client demand but facing transition risks.
Cboe Global Markets, Inc.
- ESG integration is growing but less central; may face pressure as investor focus intensifies.
7. Geopolitical Exposure
S&P Global Inc.
- Global footprint exposes it to geopolitical tensions affecting capital markets and data services.
Cboe Global Markets, Inc.
- More regionally focused but expanding internationally, facing risks from trade policies and sanctions.
Which company shows a better risk-adjusted profile?
Cboe’s most pressing risk is its negative interest coverage, threatening financial flexibility. S&P Global’s valuation multiples and liquidity ratios raise caution. However, Cboe’s lower volatility and stronger operational scores suggest a more resilient risk-adjusted profile. I note Cboe’s negative interest coverage as a critical red flag despite its favorable leverage, while S&P’s tight current ratio (0.85) signals potential liquidity stress. Overall, Cboe balances risks more effectively in 2026’s volatile environment.
Final Verdict: Which stock to choose?
S&P Global Inc. excels as a cash-generating powerhouse with robust income growth and operational efficiency. Its main point of vigilance lies in a weaker liquidity position, which could challenge short-term flexibility. This stock suits an aggressive growth portfolio willing to tolerate some balance sheet tightness for strong earnings momentum.
Cboe Global Markets, Inc. boasts a strategic moat rooted in sustainable value creation with a growing ROIC well above its cost of capital. It offers better financial stability and a healthier liquidity profile compared to S&P Global. This stock fits a GARP approach, balancing growth potential with solid fundamentals.
If you prioritize aggressive expansion and cash flow strength, S&P Global stands out due to its dynamic revenue and profit growth. However, if you seek a more stable investment with a durable competitive advantage and cleaner balance sheet, Cboe Global Markets offers better stability and a clear value-creation edge. Each choice maps to distinct investor profiles, emphasizing the importance of aligning risk tolerance with strategic goals.
Disclaimer: Investment carries a risk of loss of initial capital. The past performance is not a reliable indicator of future results. Be sure to understand risks before making an investment decision.
Go Further
I encourage you to read the complete analyses of S&P Global Inc. and Cboe Global Markets, Inc. to enhance your investment decisions: