Home > Comparison > Financial Services > NDAQ vs CBOE
The strategic rivalry between Nasdaq, Inc. and Cboe Global Markets, Inc. defines the current trajectory of financial data and stock exchanges. Nasdaq operates as a diversified technology-driven market platform, while Cboe focuses on specialized options and futures trading. This head-to-head contrasts broad market technology integration against niche derivatives expertise. This analysis will determine which corporate model delivers superior risk-adjusted returns for a diversified financial services portfolio.

Table of contents
Companies Overview
Nasdaq and Cboe stand as pivotal players in global financial market infrastructure, shaping capital flows across multiple asset classes.
Nasdaq, Inc.: Global Market Technology Powerhouse
Nasdaq dominates as a technology-driven market operator, generating revenue through diverse segments including Market Technology SaaS, Investment Intelligence, and Market Services. Its strategic focus in 2021 emphasized expanding anti-financial crime solutions and broadening multi-asset trading platforms. Nasdaq’s ecosystem spans equities, derivatives, commodities, and digital currencies, reinforcing its competitive advantage in integrated market services.
Cboe Global Markets, Inc.: Options and Derivatives Specialist
Cboe operates primarily as a leading options exchange with global derivatives reach. Its revenue stems from five segments: Options, North American Equities, Futures, Europe and Asia Pacific, and Global FX. In 2021, Cboe concentrated on enhancing international equities and derivatives trading, alongside expanding FX services. This focus underlines its strength in options and futures markets with a growing global footprint.
Strategic Collision: Similarities & Divergences
Both companies excel in financial market infrastructure but adopt different philosophies. Nasdaq leverages an integrated technology platform across asset classes, while Cboe specializes in options and derivatives with regional market diversification. Their fiercest competition lies in derivatives trading and data services where market share battles intensify. Nasdaq offers broad multi-asset exposure; Cboe delivers focused options expertise, creating distinct investment profiles for portfolio diversification.
Income Statement Comparison
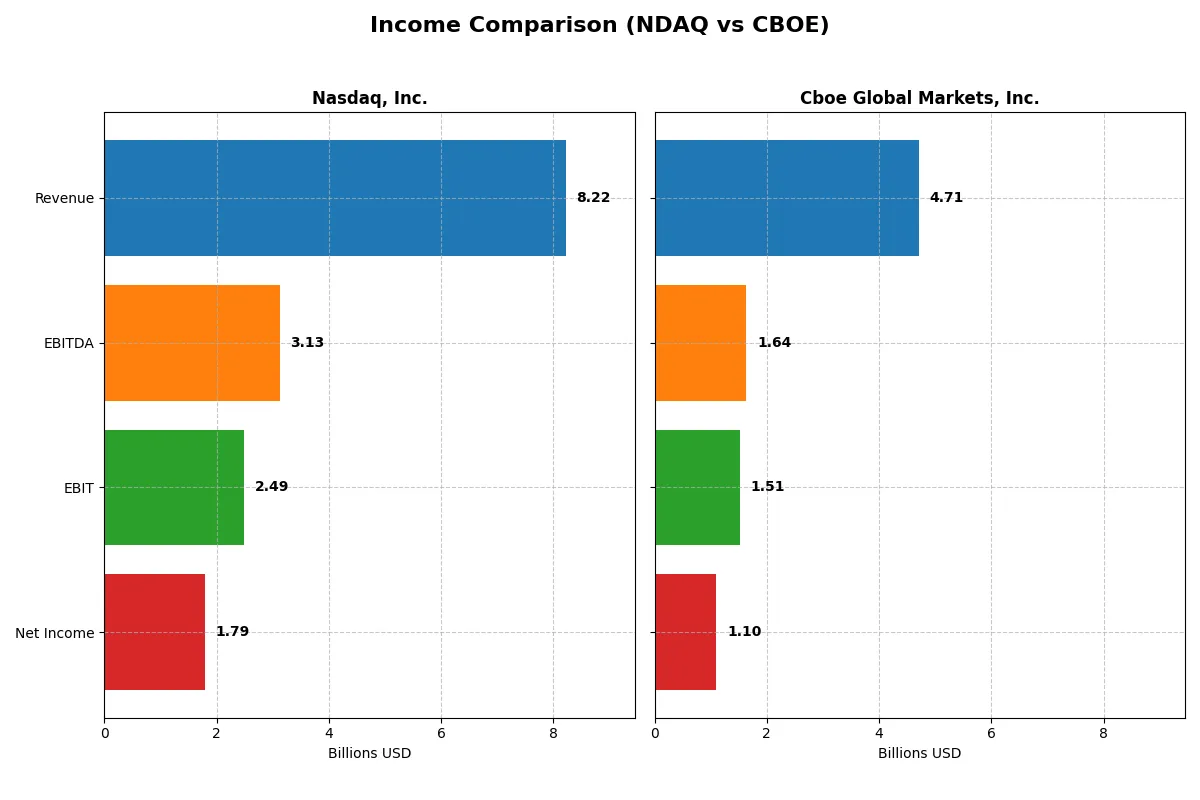
The following data dissects the core profitability and scalability of both corporate engines to reveal who dominates the bottom line:
| Metric | Nasdaq, Inc. (NDAQ) | Cboe Global Markets, Inc. (CBOE) |
|---|---|---|
| Revenue | 8.22B | 4.71B |
| Cost of Revenue | 4.28B | 2.41B |
| Operating Expenses | 1.61B | 723M |
| Gross Profit | 3.94B | 2.31B |
| EBITDA | 3.13B | 1.64B |
| EBIT | 2.49B | 1.51B |
| Interest Expense | 88M | -52M |
| Net Income | 1.79B | 1.10B |
| EPS | 3.13 | 10.46 |
| Fiscal Year | 2025 | 2025 |
Income Statement Analysis: The Bottom-Line Duel
This income statement comparison will reveal which company runs a more efficient and profitable corporate engine in recent years.
Nasdaq, Inc. Analysis
Nasdaq’s revenue rose steadily from 5.89B in 2021 to 8.22B in 2025, reflecting a 40% growth over five years. Net income surged 51%, reaching 1.79B in 2025. Margins remain healthy, with gross margin near 48% and net margin at 21.8% in 2025. Despite a slight rise in operating expenses, Nasdaq’s bottom-line momentum accelerated sharply last year.
Cboe Global Markets, Inc. Analysis
Cboe’s revenue climbed from 3.49B in 2021 to 4.71B in 2025, growing 35% overall. Net income more than doubled, hitting 1.10B in 2025. The company maintains a slightly higher gross margin of 48.9% and net margin of 23.3% in 2025. Expense control improved alongside revenue growth, fueling solid earnings and margin expansion over the last year.
Margin Power vs. Earnings Momentum
Cboe exhibits stronger margins and superior net margin growth, while Nasdaq delivers higher absolute revenue and net income gains. Nasdaq’s scale and recent acceleration in earnings growth outpace Cboe’s more modest revenue rise. For investors, Nasdaq offers greater momentum and income growth, whereas Cboe presents a leaner margin profile with consistent profitability.
Financial Ratios Comparison
These vital ratios act as a diagnostic tool to expose the underlying fiscal health, valuation premiums, and capital efficiency of the companies compared below:
| Ratios | Nasdaq, Inc. (NDAQ) | Cboe Global Markets, Inc. (CBOE) |
|---|---|---|
| ROE | 14.6% (2025) | 21.4% (2025) |
| ROIC | -25.8% (2025) | 15.3% (2025) |
| P/E | 31.0 (2025) | 23.9 (2025) |
| P/B | 4.53 (2025) | 5.11 (2025) |
| Current Ratio | 0.00 (2025) | 1.87 (2025) |
| Quick Ratio | 0.00 (2025) | 1.87 (2025) |
| D/E (Debt/Equity) | 0.81 (2025) | 0.33 (2025) |
| Debt-to-Assets | 32.0% (2025) | 18.1% (2025) |
| Interest Coverage | 26.5 (2025) | -28.9 (2025) |
| Asset Turnover | 0.26 (2025) | 0.51 (2025) |
| Fixed Asset Turnover | 6.99 (2025) | 19.3 (2025) |
| Payout Ratio | 33.5% (2025) | 25.7% (2025) |
| Dividend Yield | 1.08% (2025) | 1.08% (2025) |
| Fiscal Year | 2025 | 2025 |
Efficiency & Valuation Duel: The Vital Signs
Financial ratios serve as a company’s DNA, exposing hidden risks and showcasing operational excellence through clear quantitative signals.
Nasdaq, Inc.
Nasdaq posts a solid net margin of 21.77% but shows a neutral ROE at 14.63%. The stock trades at a stretched P/E of 30.98 and a high P/B of 4.53, suggesting premium valuation. Shareholders receive a modest 1.08% dividend yield, reflecting cautious capital return amid reinvestment uncertainties.
Cboe Global Markets, Inc.
Cboe demonstrates superior profitability with a 23.33% net margin and a robust 21.41% ROE. Its P/E at 23.89 is fairly valued, though P/B at 5.11 is elevated. The company maintains a 1.08% dividend yield, supported by strong fundamentals and efficient capital deployment, enhancing shareholder returns.
Balanced Profitability vs. Valuation Discipline
Cboe shows a better balance of operational efficiency and valuation, backed by favorable ROIC and solid liquidity ratios. Nasdaq’s stretched multiples and weaker capital returns imply higher risk. Investors seeking operational strength and valuation discipline may find Cboe’s profile more aligned with prudent risk management.
Which one offers the Superior Shareholder Reward?
I see Nasdaq, Inc. (NDAQ) yields around 1.08% with a 33% payout ratio, balancing dividends and buybacks steadily. Cboe Global Markets, Inc. (CBOE) offers a similar yield near 1.08% but with a lighter 26% payout and a stronger buyback emphasis. CBOE’s lower debt-to-equity (0.33 vs. NDAQ’s 0.81) and higher margins suggest healthier reinvestment capacity. Historically, CBOE’s buyback intensity has driven total return more effectively than Nasdaq’s moderate distribution. I favor CBOE for long-term value and total shareholder reward in 2026 due to its sustainable capital allocation and robust cash flow coverage.
Comparative Score Analysis: The Strategic Profile
The radar chart reveals the fundamental DNA and trade-offs of Nasdaq, Inc. and Cboe Global Markets, Inc., outlining their strategic financial strengths and weaknesses:
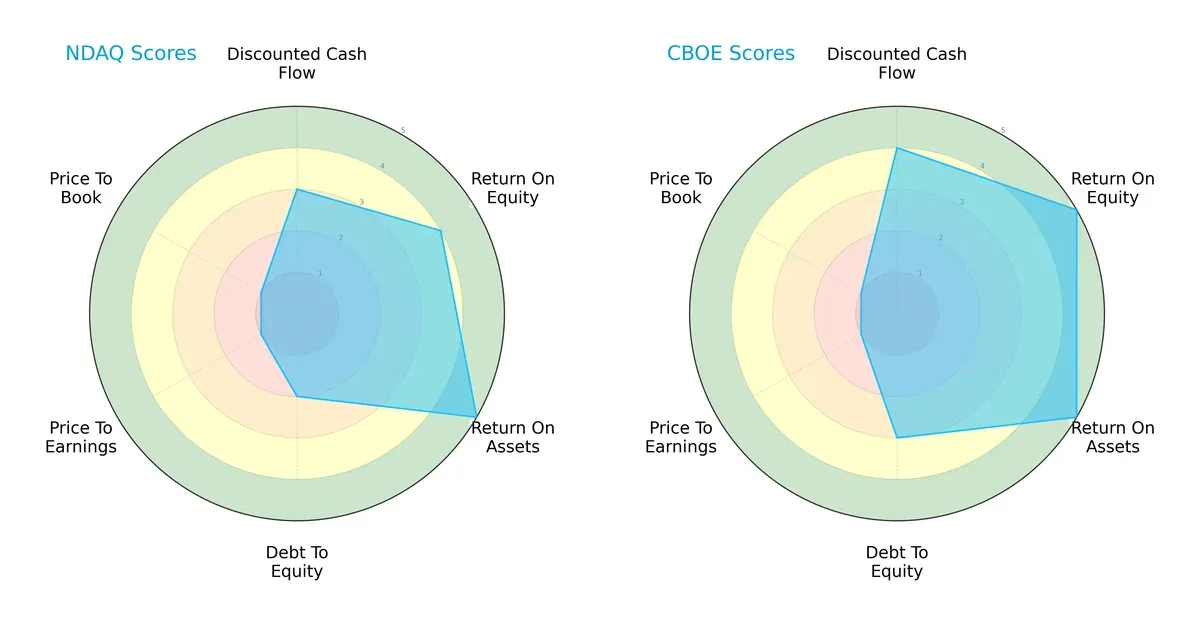
Cboe Global Markets shows a stronger discounted cash flow (DCF) and return on equity (ROE) profile, indicating superior cash generation and shareholder profitability. Both companies share excellent return on assets (ROA) scores, but Nasdaq lags with a weaker debt-to-equity position, signaling higher leverage risk. Valuation metrics (PE/PB) are equally unfavorable for both, reflecting potential market skepticism. Cboe presents a more balanced and financially stable profile, while Nasdaq relies heavily on asset efficiency to compete.
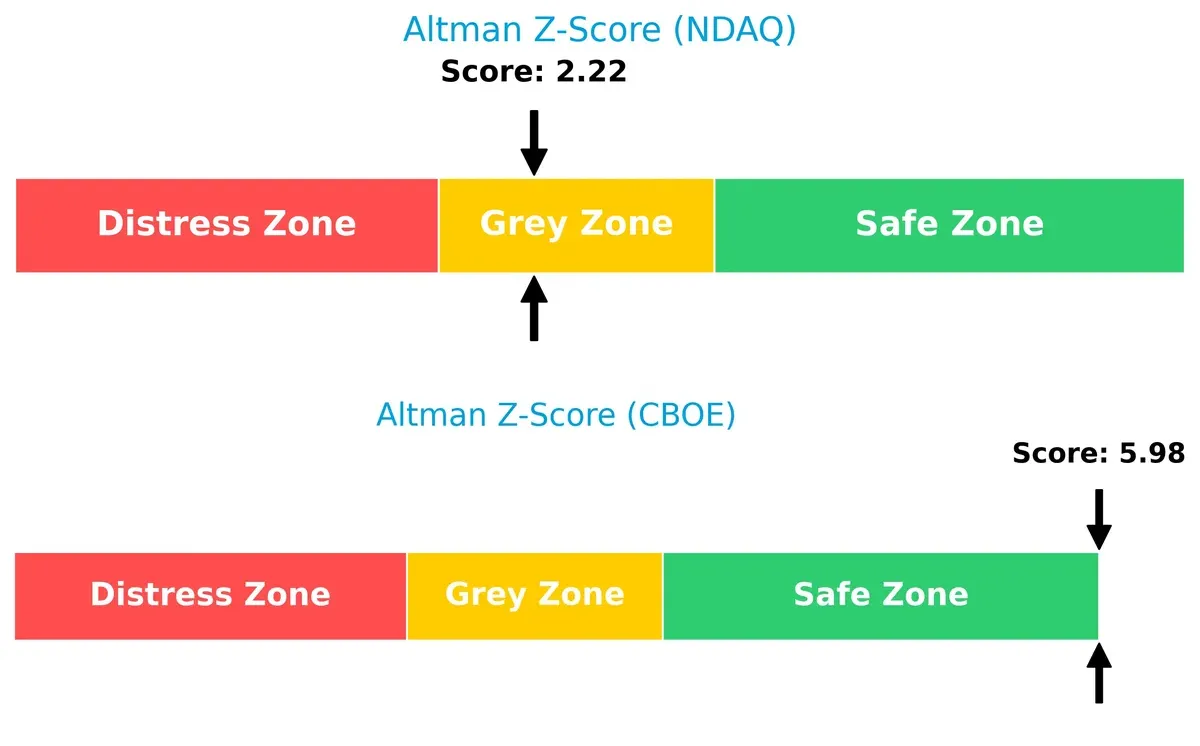
Bankruptcy Risk: Solvency Showdown
Cboe Global Markets’ Altman Z-Score of 5.98 places it firmly in the safe zone, while Nasdaq’s 2.22 sits in the grey zone, implying a moderate bankruptcy risk in this cycle:
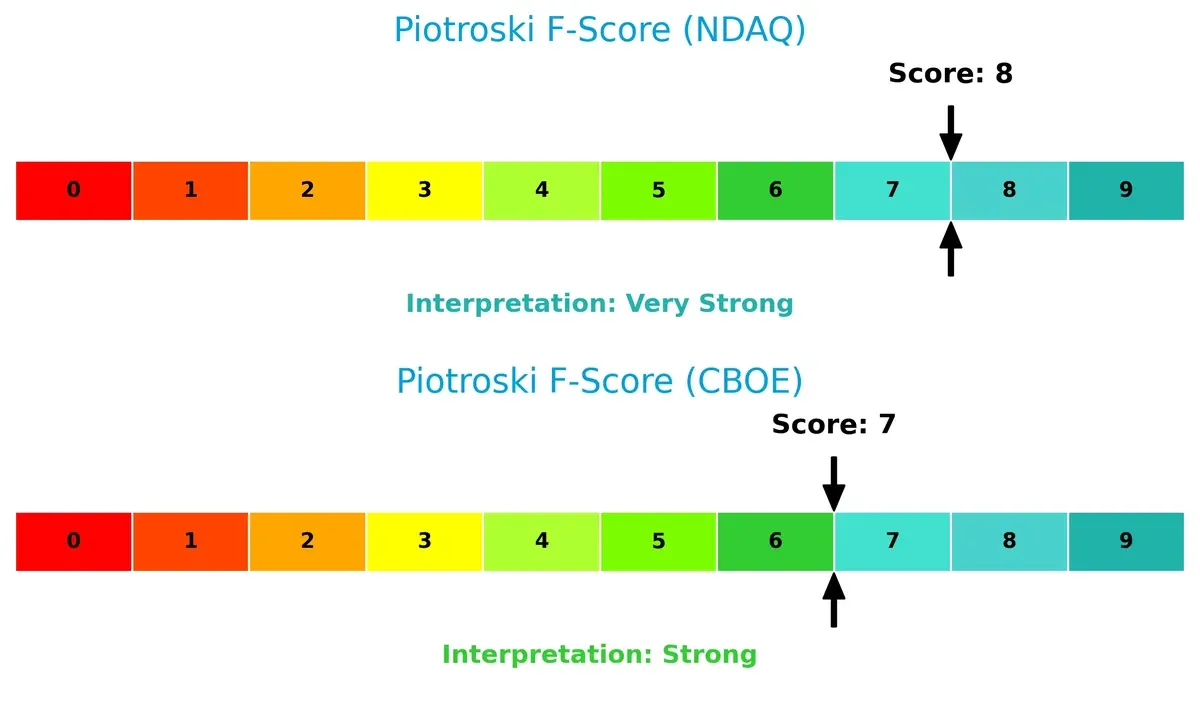
Financial Health: Quality of Operations
Nasdaq scores an 8 on the Piotroski F-Score, indicating very strong financial health, slightly outperforming Cboe’s strong 7. This suggests Nasdaq is operationally robust, though Cboe remains solid without glaring internal red flags:
How are the two companies positioned?
This section dissects Nasdaq and Cboe’s operational DNA by comparing their revenue distribution and internal strengths and weaknesses. The goal is to confront their economic moats and identify which business model offers the most resilient, sustainable competitive advantage today.
Revenue Segmentation: The Strategic Mix
This visual comparison dissects how Nasdaq, Inc. and Cboe Global Markets, Inc. diversify their income streams and where their primary sector bets lie:
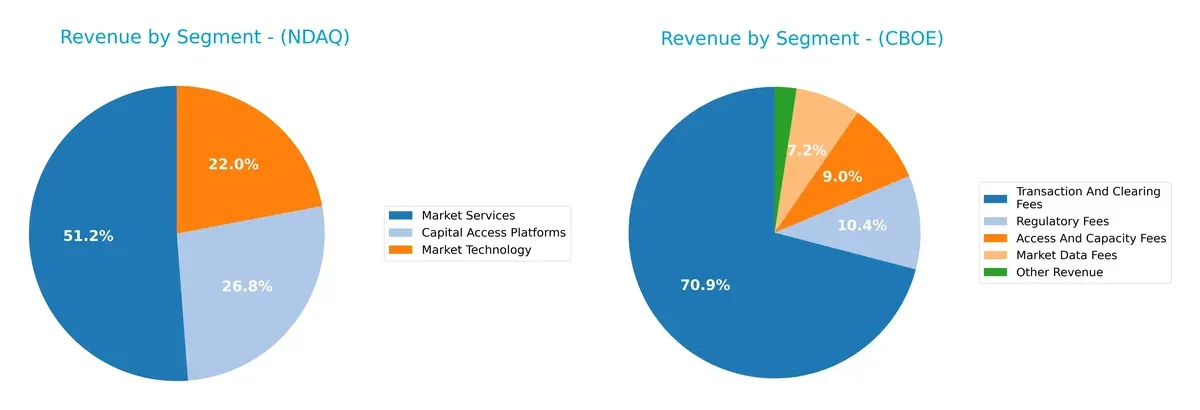
Nasdaq anchors its revenue in Market Services with $3.77B in 2024, supported by Capital Access Platforms at $1.97B and Market Technology at $1.62B. This mix reflects a balanced ecosystem approach. Cboe, however, pivots heavily on Transaction And Clearing Fees at $2.9B, dwarfing other segments like Regulatory Fees ($426M) and Market Data Fees ($295M), indicating concentration risk but strong infrastructure dominance.
Strengths and Weaknesses Comparison
This table compares the strengths and weaknesses of Nasdaq and Cboe based on diversification, profitability, financials, innovation, global presence, and market share:
Nasdaq Strengths
- Diverse revenue streams including Capital Access Platforms, Market Technology, Market Services
- Strong net margin at 21.77%
- Favorable interest coverage ratio of 28.34
- Leading fixed asset turnover at 6.99
Cboe Strengths
- Higher net margin of 23.33% and ROE of 21.41%
- Positive ROIC of 15.31% well above WACC of 5.28%
- Healthy current and quick ratios at 1.87
- Low debt-to-assets at 18.1% and strong fixed asset turnover of 19.31
Nasdaq Weaknesses
- Negative ROIC of -25.82% below WACC of 7.64% signals poor capital efficiency
- Unfavorable P/E of 30.98 and P/B of 4.53
- Zero current and quick ratios raise liquidity concerns
- Asset turnover low at 0.26
- Neutral debt-to-equity at 0.81
Cboe Weaknesses
- Negative interest coverage at -28.95 indicates potential earnings volatility
- Unfavorable P/B ratio of 5.11
- Asset turnover neutral at 0.51
Nasdaq shows diversified revenue sources and solid profitability but struggles with capital efficiency and liquidity metrics. Cboe delivers stronger returns on capital and liquidity but faces risk from weak interest coverage. These factors are critical for strategic financial positioning.
The Moat Duel: Analyzing Competitive Defensibility
A structural moat protects long-term profits from competitive erosion. Without it, market share and margins will inevitably shrink:
Nasdaq, Inc.: Network Effects and Data Dominance
Nasdaq’s moat stems from network effects and its vast data ecosystem. High margins reflect this strength, but declining ROIC signals risk. Expansion into SaaS and market technology is key in 2026.
Cboe Global Markets, Inc.: Efficient Capital Allocation and Product Diversification
Cboe’s moat lies in efficient capital use and diverse product lines across options, futures, and FX. Strong ROIC growth and margin expansion confirm robust competitive positioning and opportunities for global market expansion.
Network Effects vs. Capital Efficiency: The Moat Showdown
Cboe’s growing ROIC and value creation mark a deeper, more sustainable moat than Nasdaq’s declining profitability. Cboe is better equipped to defend and grow market share in 2026.
Which stock offers better returns?
Over the past 12 months, Nasdaq, Inc. and Cboe Global Markets, Inc. showed strong price gains with distinct trading dynamics, marked by accelerating upward trends and differing recent momentum.
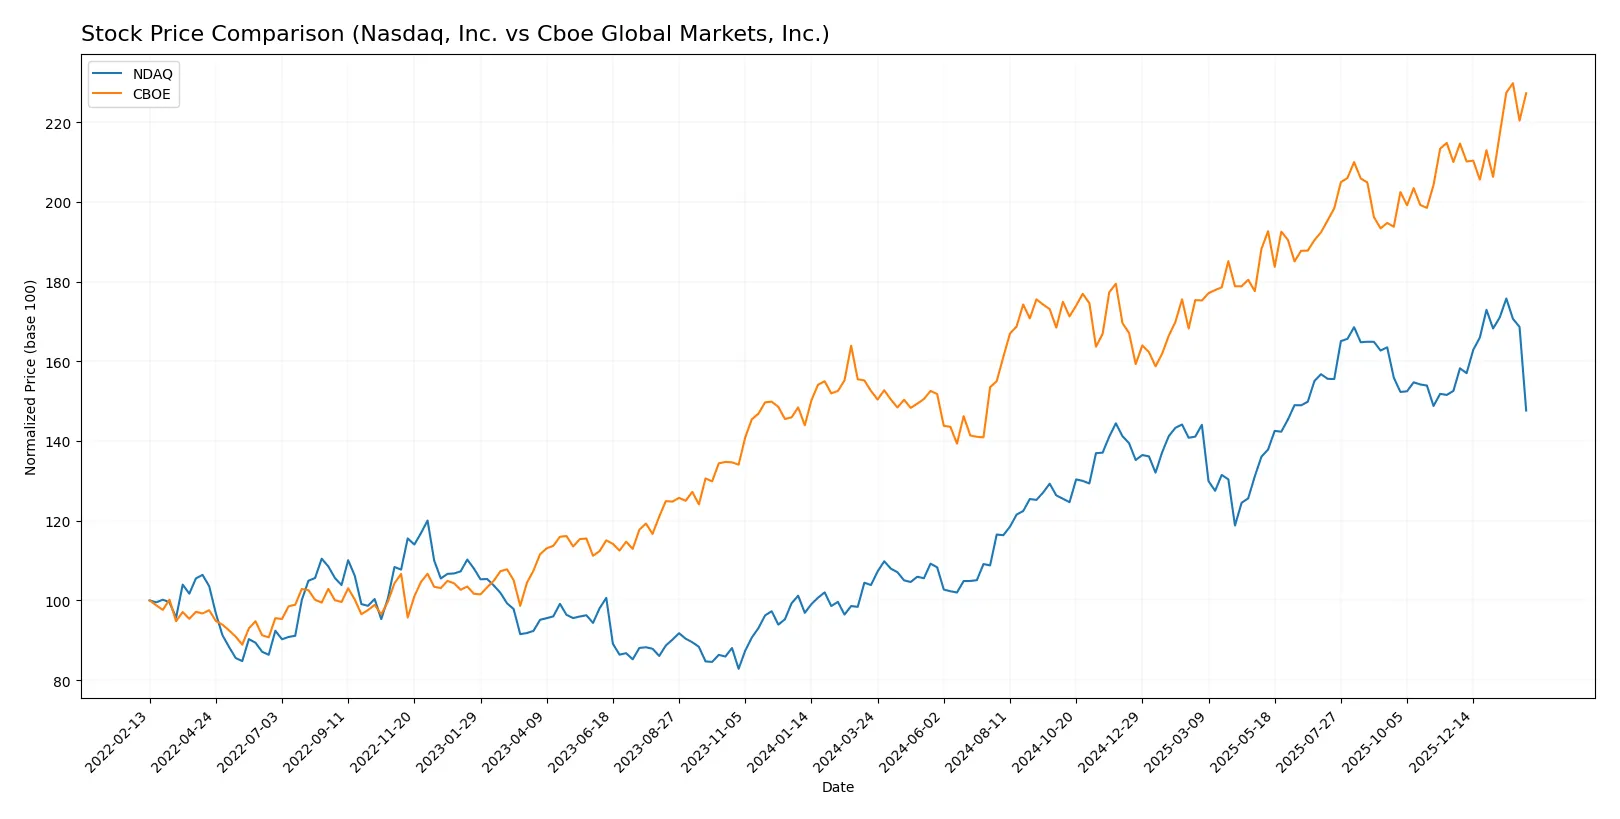
Trend Comparison
Nasdaq, Inc. posted a 42.14% price increase over the past year, displaying a bullish trend with acceleration. Its recent 3-month trend shows a slight 3.23% decline, indicating a minor deceleration.
Cboe Global Markets, Inc. recorded a 48.95% gain over 12 months, also bullish with acceleration but higher volatility. Recently, it gained 8.22%, reflecting strong positive momentum and buyer dominance.
Comparing both, Cboe Global Markets delivered the highest market performance, outperforming Nasdaq both overall and in the recent period.
Target Prices
Analysts present a bullish consensus for both Nasdaq, Inc. and Cboe Global Markets, Inc.
| Company | Target Low | Target High | Consensus |
|---|---|---|---|
| Nasdaq, Inc. | 100 | 120 | 111.8 |
| Cboe Global Markets, Inc. | 240 | 295 | 274 |
The target consensus for Nasdaq, Inc. exceeds the current price of $84.83 by over 30%, signaling strong upside potential. Cboe Global Markets, Inc.’s targets closely align with its current price of $273.09, suggesting limited near-term gain but steady valuation.

Don’t Let Luck Decide Your Entry Point
Optimize your entry points with our advanced ProRealTime indicators. You’ll get efficient buy signals with precise price targets for maximum performance. Start outperforming now!
How do institutions grade them?
Nasdaq, Inc. Grades
The following table summarizes recent grades assigned to Nasdaq, Inc. by major institutions.
| Grading Company | Action | New Grade | Date |
|---|---|---|---|
| RBC Capital | Maintain | Outperform | 2026-01-30 |
| Barclays | Maintain | Overweight | 2026-01-30 |
| JP Morgan | Maintain | Overweight | 2026-01-30 |
| TD Cowen | Maintain | Hold | 2026-01-30 |
| Morgan Stanley | Maintain | Overweight | 2026-01-30 |
| Morgan Stanley | Maintain | Overweight | 2026-01-15 |
| TD Cowen | Maintain | Hold | 2026-01-14 |
| JP Morgan | Maintain | Overweight | 2026-01-12 |
| UBS | Maintain | Buy | 2026-01-12 |
| Barclays | Maintain | Overweight | 2026-01-08 |
Cboe Global Markets, Inc. Grades
The following table summarizes recent grades assigned to Cboe Global Markets, Inc. by major institutions.
| Grading Company | Action | New Grade | Date |
|---|---|---|---|
| TD Cowen | Maintain | Hold | 2026-01-14 |
| Piper Sandler | Maintain | Overweight | 2026-01-14 |
| Barclays | Maintain | Overweight | 2026-01-08 |
| UBS | Maintain | Neutral | 2026-01-07 |
| Morgan Stanley | Maintain | Underweight | 2025-12-22 |
| Barclays | Upgrade | Overweight | 2025-12-12 |
| Barclays | Maintain | Equal Weight | 2025-11-03 |
| Keefe, Bruyette & Woods | Maintain | Market Perform | 2025-11-03 |
| Citigroup | Maintain | Neutral | 2025-11-03 |
| UBS | Maintain | Neutral | 2025-11-03 |
Which company has the best grades?
Nasdaq, Inc. consistently receives higher ratings, including multiple Overweight and Outperform grades. Cboe Global Markets, Inc. shows more Neutral and Underweight ratings. Nasdaq’s stronger grades suggest greater institutional confidence, potentially influencing investor sentiment positively.
Risks specific to each company
The following categories identify the critical pressure points and systemic threats facing both firms in the 2026 market environment:
1. Market & Competition
Nasdaq, Inc.
- Faces pressure from diverse asset classes and technology rivals in market data and surveillance.
Cboe Global Markets, Inc.
- Dominates in options trading but faces competition in expanding global FX and futures markets.
2. Capital Structure & Debt
Nasdaq, Inc.
- Moderate leverage with D/E of 0.81; interest coverage remains strong at 28.34x.
Cboe Global Markets, Inc.
- Lower leverage (D/E 0.33) but negative interest coverage (-28.95) signals potential financial stress.
3. Stock Volatility
Nasdaq, Inc.
- Beta near 1.02 indicates market-typical volatility.
Cboe Global Markets, Inc.
- Low beta at 0.36 suggests defensive stock with less price fluctuation.
4. Regulatory & Legal
Nasdaq, Inc.
- Regulatory scrutiny on market technology and surveillance products may increase compliance costs.
Cboe Global Markets, Inc.
- Global expansion invites complex regulatory environments, especially in Europe and Asia Pacific.
5. Supply Chain & Operations
Nasdaq, Inc.
- Relies heavily on technology platforms; operational disruptions could impair revenues.
Cboe Global Markets, Inc.
- Diverse segments require robust operational coordination; futures and FX trading platforms critical.
6. ESG & Climate Transition
Nasdaq, Inc.
- ESG initiatives integrated in governance solutions; climate risks may impact tech infrastructure.
Cboe Global Markets, Inc.
- Faces pressure to enhance ESG disclosures, especially in international markets with stringent standards.
7. Geopolitical Exposure
Nasdaq, Inc.
- Primarily US-focused but exposed to global market trends and international listings.
Cboe Global Markets, Inc.
- Greater exposure to geopolitical risks via Europe and Asia Pacific operations.
Which company shows a better risk-adjusted profile?
Cboe’s strongest risk is its negative interest coverage, signaling financial strain despite lower leverage. Nasdaq struggles with unfavorable liquidity ratios and a weak ROIC, raising concerns about capital efficiency. Cboe’s safer Altman Z-Score and favorable capital structure offer a better risk-adjusted profile. Nasdaq’s liquidity red flags and declining ROIC in 2025 highlight operational challenges that amplify risk.
Final Verdict: Which stock to choose?
Nasdaq, Inc. impresses with its strong income growth and operational efficiency, delivering steady profitability despite challenges in capital efficiency. Its Achilles’ heel lies in declining ROIC, signaling caution on long-term value creation. It fits an Aggressive Growth portfolio seeking momentum with some risk tolerance.
Cboe Global Markets boasts a robust strategic moat with rising ROIC and prudent capital allocation, underpinning its sustainable competitive edge. Its healthier balance sheet and more stable financial profile make it relatively safer than Nasdaq. It suits a GARP investor aiming for growth balanced with financial resilience.
If you prioritize rapid income expansion and operational leverage, Nasdaq might be the compelling choice despite its capital efficiency headwinds. However, if you seek durable value creation and stronger financial stability, Cboe outshines as the better pick for risk-conscious growth investors. Each scenario depends on your appetite for growth versus prudence.
Disclaimer: Investment carries a risk of loss of initial capital. The past performance is not a reliable indicator of future results. Be sure to understand risks before making an investment decision.
Go Further
I encourage you to read the complete analyses of Nasdaq, Inc. and Cboe Global Markets, Inc. to enhance your investment decisions: