Home > Comparison > Financial Services > MSCI vs CBOE
The strategic rivalry between MSCI Inc. and Cboe Global Markets defines the current trajectory of the financial data and stock exchange sector. MSCI operates as a diversified investment decision support provider, emphasizing analytics, ESG, and private assets. In contrast, Cboe focuses on listed options, equities, and futures trading across global markets. This analysis assesses which distinct operational model offers superior risk-adjusted returns for a well-diversified portfolio.
Table of contents
Companies Overview
MSCI Inc. and Cboe Global Markets, Inc. dominate the financial data and exchange landscape, shaping investment decision-making globally.
MSCI Inc.: Investment Decision Support Pioneer
MSCI Inc. leads in providing investment decision support tools through four segments: Index, Analytics, ESG and Climate, and Private Assets. Its core revenue derives from licensing indexes, analytics services, and ESG data to asset managers and institutional investors. In 2026, MSCI sharpens its focus on expanding ESG and climate solutions, reflecting rising regulatory and investor demand.
Cboe Global Markets, Inc.: Options Exchange Powerhouse
Cboe Global Markets, Inc. operates a diverse platform spanning options, equities, futures, and FX trading. Its revenue engine centers on transaction fees and listings across these asset classes. The company emphasizes global expansion and innovation in derivatives markets during 2026, leveraging strategic partnerships to broaden market reach.
Strategic Collision: Similarities & Divergences
Both firms excel in financial market infrastructure but diverge strategically—MSCI builds a data-centric ecosystem, while Cboe prioritizes exchange-driven transaction volumes. Their battleground lies in serving asset managers, with MSCI focused on analytical insights and Cboe on trading access. These distinctions create unique investment profiles: MSCI offers data resilience, Cboe delivers market liquidity exposure.
Income Statement Comparison
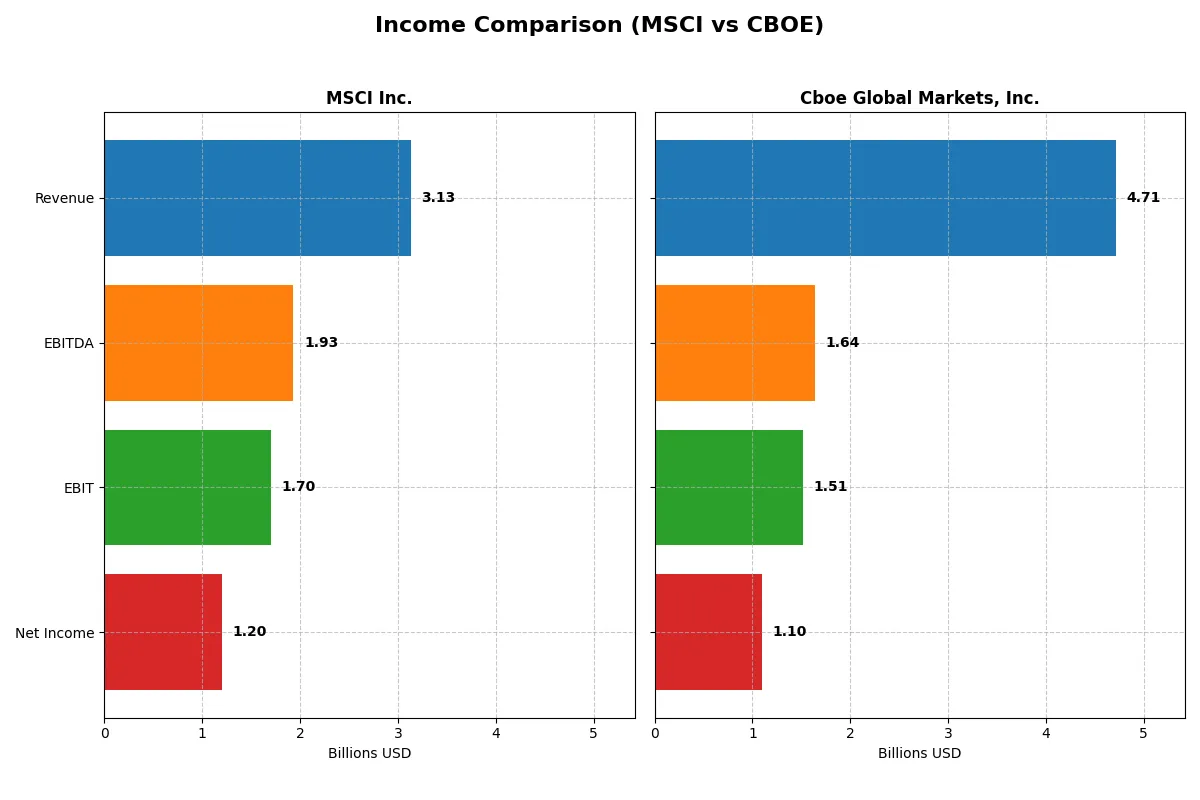
This data dissects the core profitability and scalability of both corporate engines to reveal who dominates the bottom line:
| Metric | MSCI Inc. (MSCI) | Cboe Global Markets, Inc. (CBOE) |
|---|---|---|
| Revenue | 3.13B | 4.71B |
| Cost of Revenue | 550M | 2.41B |
| Operating Expenses | 871M | 723M |
| Gross Profit | 2.58B | 2.31B |
| EBITDA | 1.93B | 1.64B |
| EBIT | 1.70B | 1.51B |
| Interest Expense | 210M | -52M |
| Net Income | 1.20B | 1.10B |
| EPS | 15.58 | 10.46 |
| Fiscal Year | 2025 | 2025 |
Income Statement Analysis: The Bottom-Line Duel
This income statement comparison reveals the true efficiency and growth momentum powering each company’s financial engine.
MSCI Inc. Analysis
MSCI grows revenue steadily, reaching 3.13B in 2025 with a net income of 1.2B. Its gross margin stays robust above 82%, and net margin holds strong at 38%. The company’s EBIT margin at 54% signals excellent operational efficiency. Recent growth in revenue and EBIT highlights sustained momentum, despite a slight dip in net margin last year.
Cboe Global Markets, Inc. Analysis
Cboe’s revenue climbed sharply to 4.71B in 2025, with net income hitting 1.1B. The gross margin of 49% and net margin of 23% reflect a different cost structure but remain favorable. Cboe’s EBIT margin at 32% improved notably, supported by a 33% EBIT growth year-over-year. Its accelerating EPS and net margin growth underline strong profitability gains.
Margin Power vs. Revenue Scale
MSCI outperforms with superior margins and operational efficiency, while Cboe leverages higher revenue growth and expanding profitability. MSCI’s higher net margin and EBIT margin showcase a stronger core business, but Cboe’s rapid earnings growth and expanding margins signal dynamic improvement. Investors seeking margin strength may prefer MSCI, while those favoring growth momentum might lean toward Cboe.
Financial Ratios Comparison
These vital ratios act as a diagnostic tool to expose underlying fiscal health, valuation premiums, and capital efficiency for the most recent fiscal year:
| Ratios | MSCI Inc. (MSCI) | Cboe Global Markets (CBOE) |
|---|---|---|
| ROE | -45.3% | 21.4% |
| ROIC | 35.6% | 15.3% |
| P/E | 36.8 | 23.9 |
| P/B | -16.7 | 5.11 |
| Current Ratio | 0.90 | 1.87 |
| Quick Ratio | 0.90 | 1.87 |
| D/E | -2.42 | 0.33 |
| Debt-to-Assets | 113% | 18.1% |
| Interest Coverage | 8.16 | -28.95 |
| Asset Turnover | 0.55 | 0.51 |
| Fixed Asset Turnover | 15.7 | 19.3 |
| Payout ratio | 46.3% | 25.7% |
| Dividend yield | 1.26% | 1.08% |
| Fiscal Year | 2025 | 2025 |
Efficiency & Valuation Duel: The Vital Signs
Financial ratios act as a company’s DNA, revealing hidden risks and operational excellence critical for informed investing decisions.
MSCI Inc.
MSCI shows strong profitability with a 38.36% net margin and a robust 35.6% ROIC, but a deeply negative -45.29% ROE signals shareholder equity challenges. Its P/E of 36.82 suggests the stock is expensive. The 1.26% dividend yield provides modest shareholder returns amid reinvestment in R&D, while a low current ratio of 0.9 flags liquidity risks.
Cboe Global Markets, Inc.
Cboe delivers solid profitability: a 23.33% net margin, 21.41% ROE, and 15.31% ROIC, reflecting operational efficiency. The P/E of 23.89 appears fairly valued. Its strong current ratio of 1.87 supports liquidity, and a 1.08% dividend yield offers steady shareholder returns. Lower debt and favorable WACC enhance its financial stability.
Operational Strength vs. Valuation Stretch
Cboe balances stronger equity returns and liquidity with a reasonable valuation. MSCI excels in returns on invested capital but carries valuation and liquidity concerns. Investors seeking stability may prefer Cboe’s profile, while those focused on capital efficiency must weigh MSCI’s stretched valuation carefully.
Which one offers the Superior Shareholder Reward?
I compare MSCI Inc. and Cboe Global Markets, Inc. on dividends and buybacks. MSCI yields 1.26% with a 46% payout, supported by strong free cash flow (20B FCF/share coverage). Cboe offers a 1.08% yield at 26% payout but lacks buyback data, indicating less aggressive capital return. MSCI’s consistent buybacks amplify total return, while Cboe reinvests in growth conservatively. MSCI’s model balances income and buybacks sustainably, outperforming Cboe’s yield-focused, lower payout approach. I conclude MSCI delivers superior total shareholder reward in 2026.
Comparative Score Analysis: The Strategic Profile
The radar chart reveals the fundamental DNA and trade-offs of MSCI Inc. and Cboe Global Markets, Inc.:
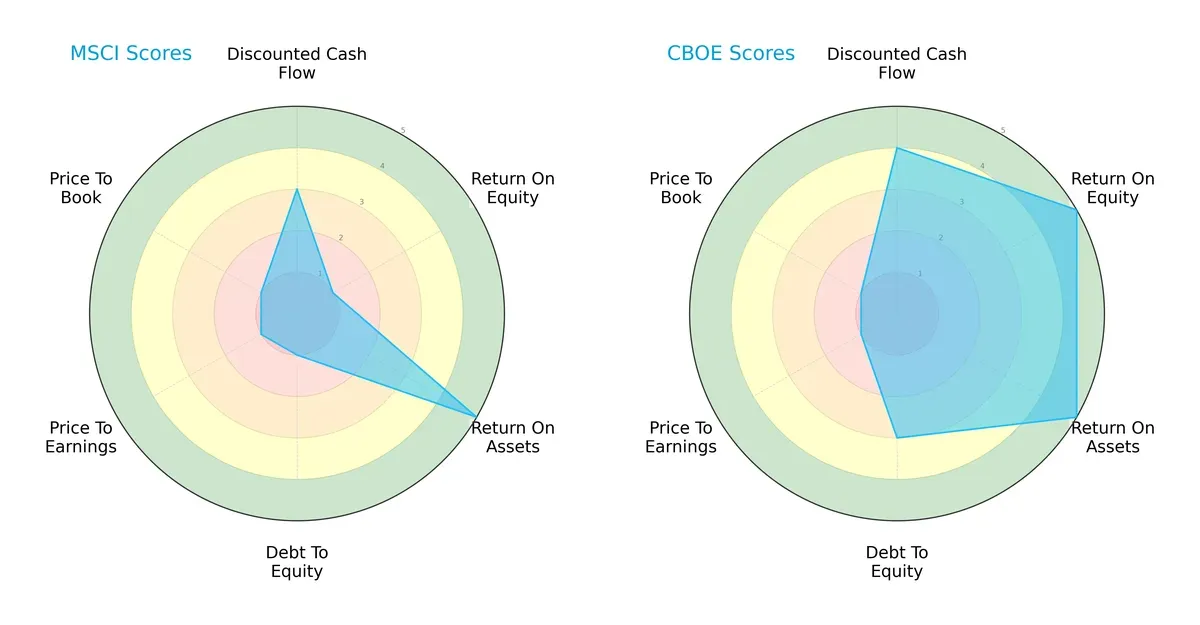
Cboe Global Markets shows a more balanced financial profile with superior scores in overall rating, DCF, ROE, ROA, and moderate debt-to-equity. MSCI leans heavily on asset efficiency (ROA) but struggles with profitability and leverage metrics. Cboe’s broader strengths suggest a robust moat and disciplined capital allocation, whereas MSCI’s profile signals vulnerability in equity returns and valuation.
Bankruptcy Risk: Solvency Showdown
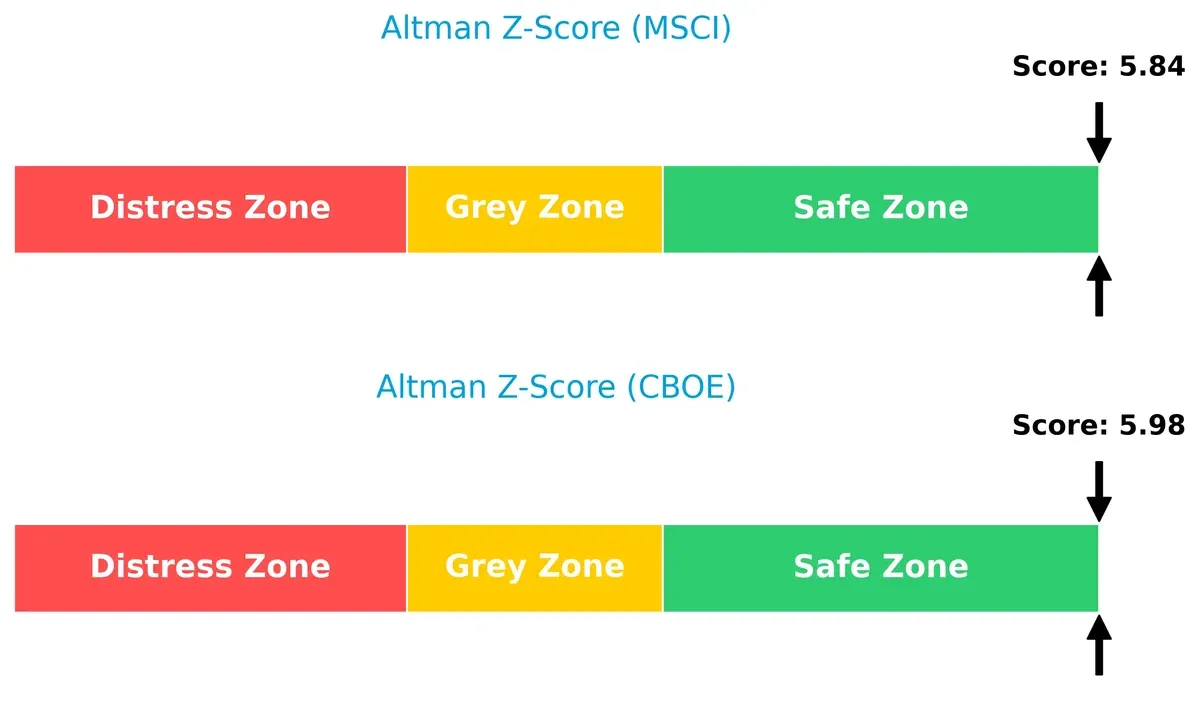
The Altman Z-Scores for both firms place them securely in the safe zone, indicating strong solvency and low bankruptcy risk in this cycle:
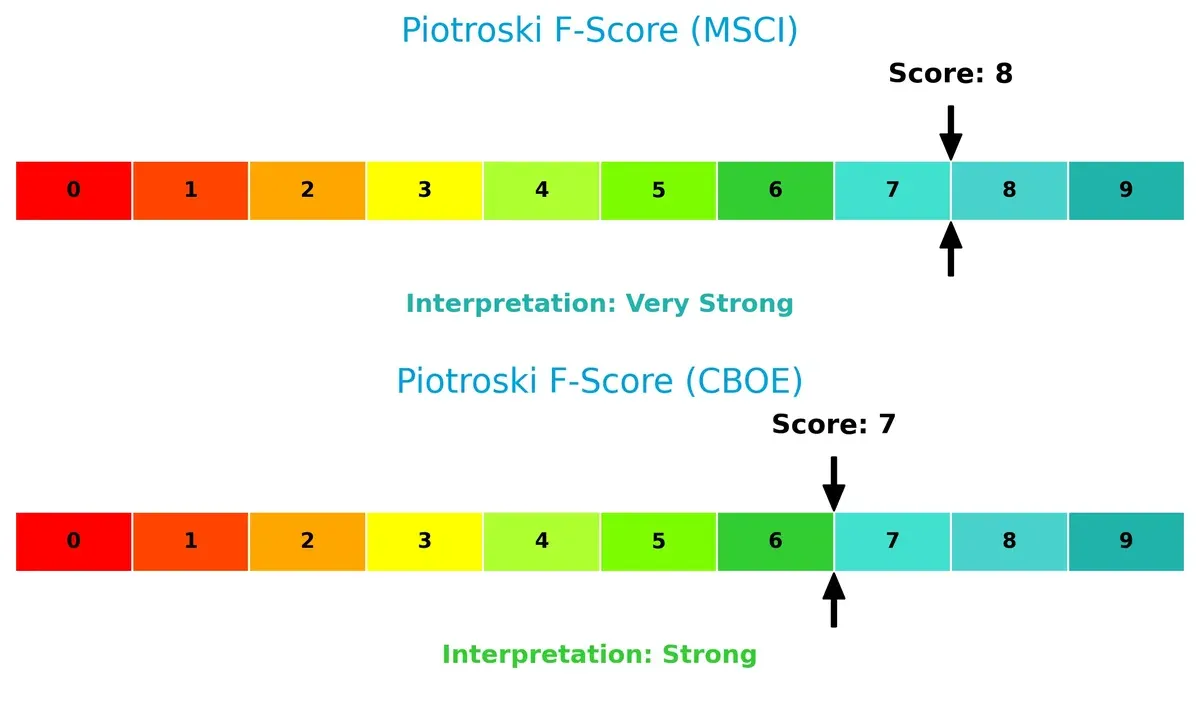
Financial Health: Quality of Operations
MSCI’s Piotroski F-Score of 8 signals very strong internal financial health, outperforming Cboe’s score of 7, which remains strong but slightly less robust. This suggests MSCI maintains excellent operational quality and low internal red flags:
How are the two companies positioned?
This section dissects MSCI and Cboe’s operational DNA by comparing revenue distribution by segment and internal dynamics. The goal is to confront their economic moats and identify which model delivers the most resilient, sustainable competitive advantage today.
Revenue Segmentation: The Strategic Mix
This visual comparison dissects how MSCI Inc. and Cboe Global Markets diversify their income streams and where their primary sector bets lie:
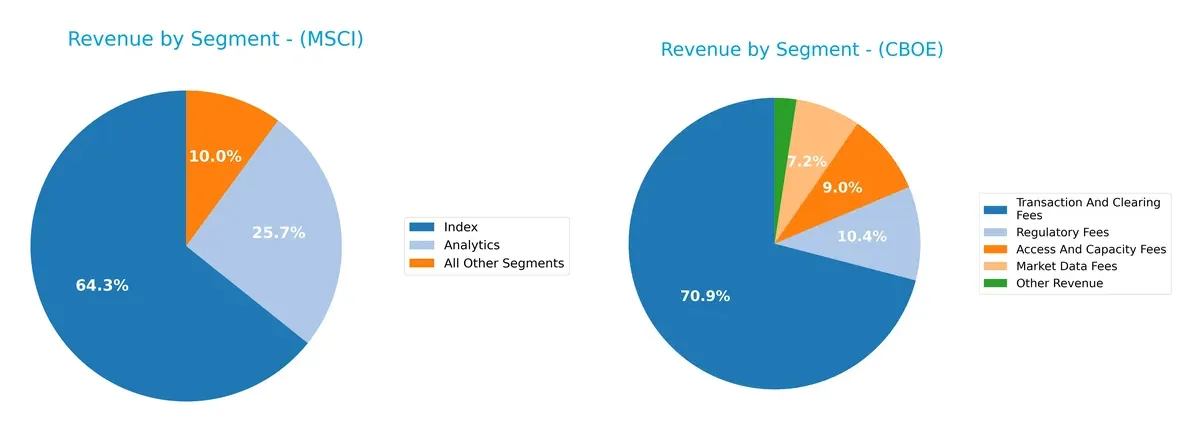
MSCI anchors revenue in its Index segment with $1.79B in 2025, supported by Analytics at $714M and smaller segments. Cboe relies heavily on Transaction and Clearing Fees, generating $2.9B in 2024, dwarfed by smaller fees like Market Data at $295M. MSCI’s mix shows moderate diversification, reducing concentration risk. Cboe’s structure pivots on infrastructure dominance but carries higher dependency on one segment, exposing it to market volatility.
Strengths and Weaknesses Comparison
This table compares the Strengths and Weaknesses of MSCI and Cboe Global Markets based on key financial and market criteria:
MSCI Strengths
- High net margin at 38.36%
- Strong ROIC of 35.6% above WACC
- Favorable interest coverage at 8.12
- Diversified revenue streams across Index and Analytics
- Significant global presence with balanced Americas and EMEA revenues
Cboe Strengths
- Favorable ROE at 21.41% and ROIC at 15.31%
- Low WACC at 5.28% supports capital efficiency
- Strong current and quick ratios near 1.87
- Diverse fee-based revenue including transaction and regulatory fees
- Higher fixed asset turnover at 19.31
MSCI Weaknesses
- Negative ROE at -45.29% raises profitability concerns
- Unfavorable debt to assets ratio above 112%
- Low current ratio at 0.9 signals liquidity risk
- Unfavorable P/E at 36.82 may indicate overvaluation
- PB ratio negative at -16.68, unusual valuation metric
Cboe Weaknesses
- Negative interest coverage at -28.95 compromises debt service ability
- Unfavorable PB ratio at 5.11 suggests valuation premium
- Lower net margin at 23.33% than MSCI
- Moderate asset turnover at 0.51, less efficient use of assets
MSCI shows strong profitability metrics but faces liquidity and leverage challenges. Cboe maintains solid profitability and liquidity but struggles with interest coverage. Both companies demonstrate diversified revenues, yet their financial health profiles diverge significantly, shaping distinct strategic priorities.
The Moat Duel: Analyzing Competitive Defensibility
A structural moat is the only true shield protecting long-term profits from relentless competition erosion. Let’s dissect the moats of two market leaders:
MSCI Inc.: Intellectual Capital and Data Network Moat
MSCI leverages intangible assets and network effects through proprietary indexes and ESG data. Its 82% gross margin and 27% ROIC above WACC confirm robust value creation. Expansion into ESG and private assets deepens its moat in 2026.
Cboe Global Markets, Inc.: Market Infrastructure and Scale Moat
Cboe’s moat arises from exchange operations and scale economies in options and equities markets. ROIC exceeds WACC by 10%, showing efficient capital use but narrower than MSCI. Growth in global FX and futures markets offers new moat-building avenues.
Moat Strength Showdown: Data Dominance vs. Market Infrastructure
MSCI’s wider moat stems from high ROIC and diversified intellectual property, surpassing Cboe’s scale-based moat. MSCI stands better positioned to defend market share amid evolving investment trends.
Which stock offers better returns?
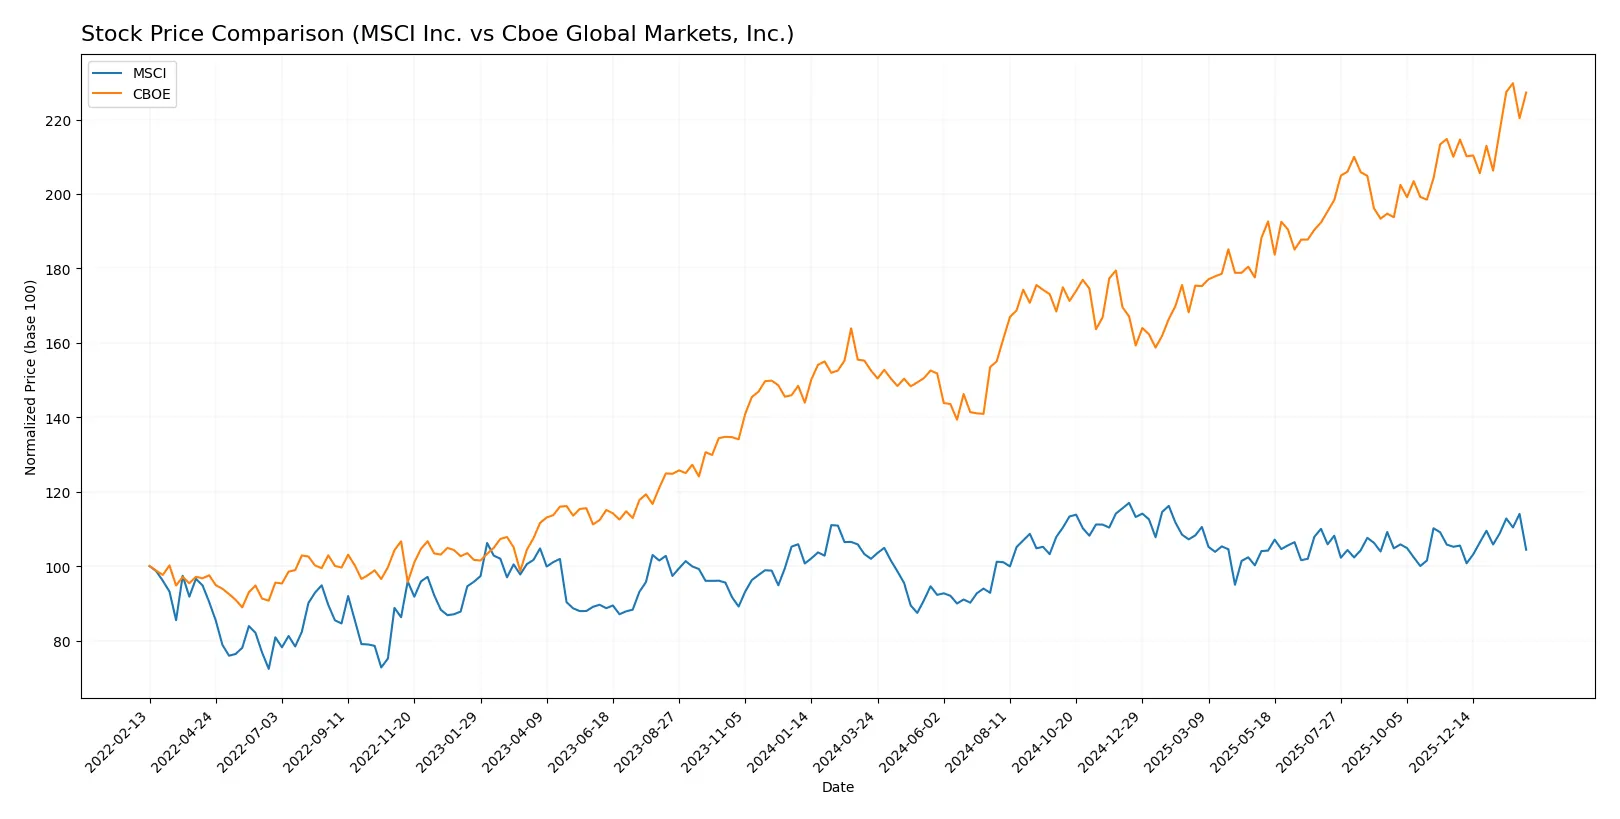
Over the past 12 months, MSCI Inc. and Cboe Global Markets, Inc. showed distinct price movements and trading dynamics, reflecting differing investor sentiment and market momentum.
Trend Comparison
MSCI’s stock rose 2.39% over the past year, indicating a bullish trend with accelerating momentum. It reached a high of 625.1 and a low of 467.04, showing notable volatility with a standard deviation of 35.43.
Cboe’s stock surged 48.95% over the same period, also bullish with acceleration. Its price ranged from 167.6 to 276.39, exhibiting less volatility (std. dev. 27.47) but stronger upward momentum.
Cboe’s stock outperformed MSCI substantially, delivering the highest market performance with a near 49% gain versus MSCI’s modest 2.4% rise.
Target Prices
Analysts present a bullish consensus for MSCI Inc. and Cboe Global Markets, projecting solid upside potential.
| Company | Target Low | Target High | Consensus |
|---|---|---|---|
| MSCI Inc. | 618 | 715 | 664.5 |
| Cboe Global Markets, Inc. | 240 | 295 | 274 |
The target consensus for MSCI sits roughly 19% above the current price of 558, reflecting strong confidence in its growth prospects. Cboe’s consensus target is aligned closely with the current price of 273, suggesting a more conservative upside expectation.

Don’t Let Luck Decide Your Entry Point
Optimize your entry points with our advanced ProRealTime indicators. You’ll get efficient buy signals with precise price targets for maximum performance. Start outperforming now!
How do institutions grade them?
MSCI Inc. Grades
The following table summarizes recent institutional grades for MSCI Inc.:
| Grading Company | Action | New Grade | Date |
|---|---|---|---|
| Evercore ISI Group | Maintain | Outperform | 2026-01-29 |
| Wells Fargo | Maintain | Equal Weight | 2026-01-29 |
| Wells Fargo | Maintain | Equal Weight | 2026-01-14 |
| JP Morgan | Maintain | Overweight | 2025-10-29 |
| UBS | Maintain | Buy | 2025-10-29 |
| Wells Fargo | Maintain | Equal Weight | 2025-10-29 |
| Barclays | Maintain | Overweight | 2025-10-29 |
| Evercore ISI Group | Maintain | Outperform | 2025-10-14 |
| JP Morgan | Maintain | Overweight | 2025-09-10 |
| Wells Fargo | Maintain | Equal Weight | 2025-07-23 |
Cboe Global Markets, Inc. Grades
The following table summarizes recent institutional grades for Cboe Global Markets, Inc.:
| Grading Company | Action | New Grade | Date |
|---|---|---|---|
| TD Cowen | Maintain | Hold | 2026-01-14 |
| Piper Sandler | Maintain | Overweight | 2026-01-14 |
| Barclays | Maintain | Overweight | 2026-01-08 |
| UBS | Maintain | Neutral | 2026-01-07 |
| Morgan Stanley | Maintain | Underweight | 2025-12-22 |
| Barclays | Upgrade | Overweight | 2025-12-12 |
| Barclays | Maintain | Equal Weight | 2025-11-03 |
| Keefe, Bruyette & Woods | Maintain | Market Perform | 2025-11-03 |
| Citigroup | Maintain | Neutral | 2025-11-03 |
| UBS | Maintain | Neutral | 2025-11-03 |
Which company has the best grades?
MSCI Inc. consistently receives higher grades, including multiple “Outperform,” “Overweight,” and “Buy” ratings. Cboe Global Markets shows more mixed ratings, ranging from “Underweight” to “Overweight.” MSCI’s stronger grades could signal greater institutional confidence, potentially influencing investor sentiment positively.
Risks specific to each company
The following categories identify the critical pressure points and systemic threats facing both firms in the 2026 market environment:
1. Market & Competition
MSCI Inc.
- Faces intense competition in data analytics and ESG products; innovation pace is crucial to maintain market share.
Cboe Global Markets, Inc.
- Competes globally in options and futures; diversification across asset classes moderates competitive risks.
2. Capital Structure & Debt
MSCI Inc.
- High debt-to-assets ratio (112.5%) signals aggressive leverage, raising financial risk.
Cboe Global Markets, Inc.
- Maintains moderate leverage with 18.1% debt-to-assets, reflecting a conservative capital structure.
3. Stock Volatility
MSCI Inc.
- Beta of 1.28 indicates above-market volatility, increasing investor risk.
Cboe Global Markets, Inc.
- Low beta of 0.36 suggests defensive stock behavior with reduced price swings.
4. Regulatory & Legal
MSCI Inc.
- ESG data regulations intensify compliance costs and liability risks.
Cboe Global Markets, Inc.
- Options and derivatives markets face strict regulatory scrutiny, impacting operational flexibility.
5. Supply Chain & Operations
MSCI Inc.
- Relies heavily on data sourcing and technology platforms; disruptions could impair service delivery.
Cboe Global Markets, Inc.
- Operational complexity in multiple global exchanges increases exposure to technology and clearing risks.
6. ESG & Climate Transition
MSCI Inc.
- ESG segment growth depends on evolving investor demand and regulatory frameworks; opportunity and risk coexist.
Cboe Global Markets, Inc.
- Progress in sustainable derivatives products lags peers; ESG integration remains a strategic challenge.
7. Geopolitical Exposure
MSCI Inc.
- Exposure to global markets subjects MSCI to geopolitical tensions and cross-border data regulations.
Cboe Global Markets, Inc.
- Global footprint in Europe and Asia Pacific entails risk from trade tensions and regulatory divergence.
Which company shows a better risk-adjusted profile?
MSCI’s highest risk is its elevated leverage, which threatens financial stability despite strong operational profitability. Cboe’s main risk lies in regulatory scrutiny impacting its diverse market operations. Cboe’s conservative capital structure and lower volatility present a better risk-adjusted profile. Cboe’s interest coverage weakness signals caution but is offset by stronger balance sheet metrics. The recent spike in MSCI’s debt-to-assets ratio justifies heightened concern over its financial risk management.
Final Verdict: Which stock to choose?
MSCI’s superpower lies in its exceptional capital efficiency and robust value creation, evidenced by a very favorable moat. However, its tight liquidity position remains a point of vigilance. It fits portfolios aiming for aggressive growth with a tolerance for short-term balance sheet risks.
Cboe Global Markets stands out for its durable strategic moat supported by recurring revenue streams and financial stability. Its conservative leverage and strong current ratios offer better safety relative to MSCI. Cboe suits investors pursuing GARP (Growth At a Reasonable Price) strategies seeking stability alongside growth.
If you prioritize high capital returns and are comfortable managing liquidity risks, MSCI is the compelling choice due to its superior value creation and growth trajectory. However, if you seek better financial stability combined with steady growth, Cboe offers a moat-backed, safer profile that may command a more reasonable valuation.
Disclaimer: Investment carries a risk of loss of initial capital. The past performance is not a reliable indicator of future results. Be sure to understand risks before making an investment decision.
Go Further
I encourage you to read the complete analyses of MSCI Inc. and Cboe Global Markets, Inc. to enhance your investment decisions: