Home > Comparison > Financial Services > MCO vs CBOE
The strategic rivalry between Moody’s Corporation and Cboe Global Markets defines the current trajectory of the financial data and exchanges sector. Moody’s operates as a capital-intensive integrated risk assessment firm, blending credit ratings with analytics. In contrast, Cboe specializes as a high-margin, diversified global options and equities exchange operator. This analysis will clarify which company’s model presents a superior risk-adjusted opportunity for a diversified portfolio in 2026.

Table of contents
Companies Overview
Moody’s Corporation and Cboe Global Markets, Inc. remain pivotal players in the financial data and exchange landscape.
Moody’s Corporation: Global Risk Assessment Leader
Moody’s Corporation dominates as a risk assessment powerhouse, generating revenue primarily from credit ratings and analytics. It operates through Moody’s Investors Service and Moody’s Analytics, covering over 140 countries. In 2026, Moody’s strategic focus centers on expanding its analytics offerings and enhancing subscription-based research products, reinforcing its role in global credit risk intelligence.
Cboe Global Markets, Inc.: Premier Options and Equities Exchange
Cboe Global Markets commands the options and equity trading space with a diverse platform spanning options, futures, equities, and FX markets. Its revenue stems from transaction fees across these segments. In 2026, Cboe prioritizes broadening its global trading footprint and deepening strategic partnerships with index providers to boost market liquidity and product innovation.
Strategic Collision: Similarities & Divergences
Both firms operate within financial services focused on market data and trading infrastructure, yet Moody’s emphasizes credit risk analytics while Cboe drives transactional market access. They chiefly compete in the global financial ecosystem, Moody’s via information dominance and Cboe through trading innovation. Their distinct investment profiles reflect Moody’s as a stable, data-driven leader and Cboe as a growth-oriented exchange operator.
Income Statement Comparison
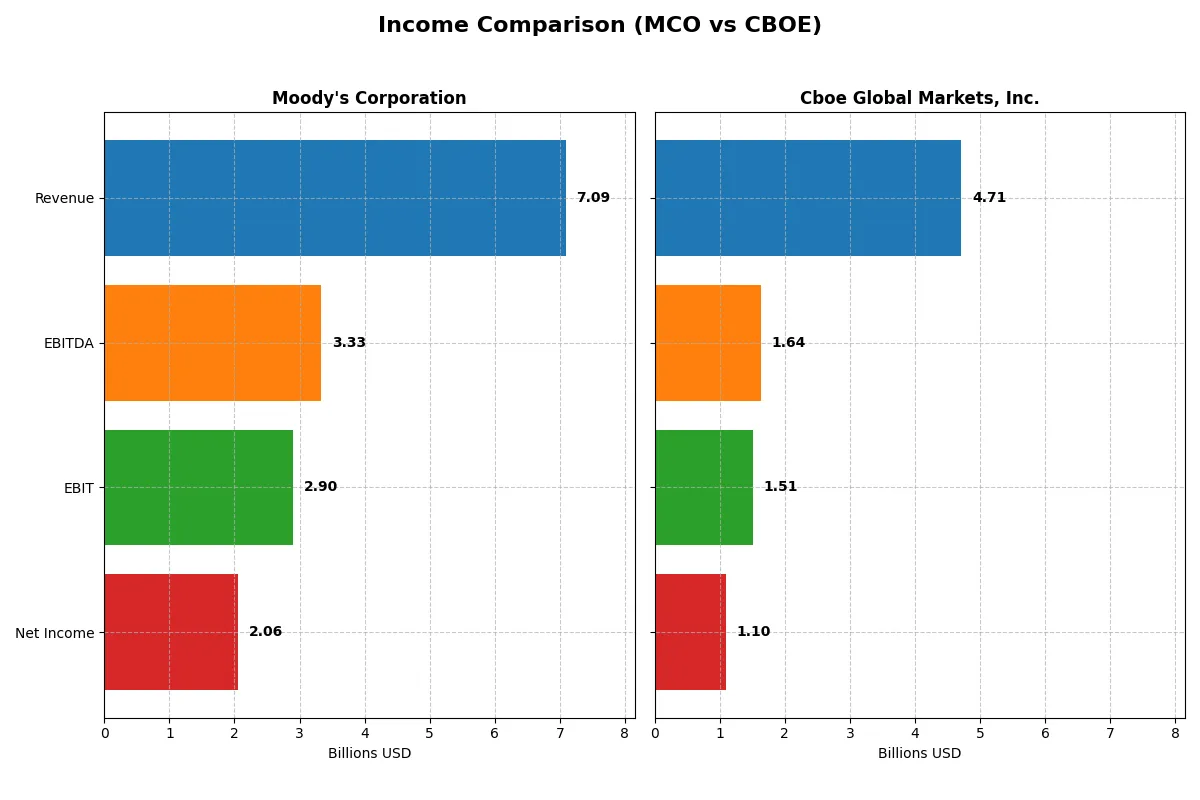
This data dissects the core profitability and scalability of both corporate engines to reveal who dominates the bottom line:
| Metric | Moody’s Corporation (MCO) | Cboe Global Markets, Inc. (CBOE) |
|---|---|---|
| Revenue | 7.09B | 4.71B |
| Cost of Revenue | 2.38B | 2.41B |
| Operating Expenses | 1.74B | 0.72B |
| Gross Profit | 4.71B | 2.31B |
| EBITDA | 3.33B | 1.64B |
| EBIT | 2.90B | 1.51B |
| Interest Expense | 0.20B | -0.05B |
| Net Income | 2.06B | 1.10B |
| EPS | 11.32 | 10.46 |
| Fiscal Year | 2024 | 2025 |
Income Statement Analysis: The Bottom-Line Duel
This income statement comparison reveals which company operates with greater efficiency and momentum in converting revenue into profit.
Moody’s Corporation Analysis
Moody’s revenue rose steadily from $5.37B in 2020 to $7.09B in 2024, with net income growing from $1.78B to $2.06B. The company maintains a strong gross margin of 66.4% and a net margin near 29%, signaling robust profitability. In 2024, Moody’s delivered a 20% revenue increase and nearly 7% net margin growth, reflecting improved operational efficiency.
Cboe Global Markets, Inc. Analysis
Cboe’s revenue expanded from $3.49B in 2021 to $4.71B in 2025, while net income surged dramatically from $527M to $1.09B. Its gross margin is lower at 48.9% but improved net margin of 23.3% in 2025 shows strong bottom-line progress. The latest year saw a 15% revenue rise and a remarkable 25% net margin growth, underscoring accelerating profit momentum.
Margin Strength vs. Earnings Momentum
Moody’s commands superior margins and stable profitability, whereas Cboe exhibits faster net income growth and expanding margins. Moody’s higher efficiency suits investors prioritizing consistent earnings quality. Cboe’s rapid profit acceleration offers appeal for those targeting growth-driven returns. The fundamental winner depends on investor preference for margin power or earnings momentum.
Financial Ratios Comparison
These vital ratios act as a diagnostic tool to expose the underlying fiscal health, valuation premiums, and capital efficiency of the companies analyzed:
| Ratios | Moody’s Corporation (MCO) | Cboe Global Markets, Inc. (CBOE) |
|---|---|---|
| ROE | 57.7% | 21.4% |
| ROIC | 17.8% | 15.3% |
| P/E | 41.8 | 23.9 |
| P/B | 24.1 | 5.1 |
| Current Ratio | 1.43 | 1.87 |
| Quick Ratio | 1.43 | 1.87 |
| D/E | 2.17 | 0.33 |
| Debt-to-Assets | 50.0% | 18.1% |
| Interest Coverage | 14.6 | -29.0 |
| Asset Turnover | 0.46 | 0.51 |
| Fixed Asset Turnover | 8.13 | 19.3 |
| Payout ratio | 30.1% | 25.7% |
| Dividend yield | 0.72% | 1.08% |
| Fiscal Year | 2024 | 2025 |
Efficiency & Valuation Duel: The Vital Signs
Financial ratios serve as a company’s DNA, unveiling hidden risks and operational strengths that shape investor confidence.
Moody’s Corporation
Moody’s shows outstanding profitability with a 57.7% ROE and a strong 29% net margin, signaling operational excellence. However, its valuation is stretched, with a P/E of 41.8 and a P/B of 24.1, reflecting high market expectations. Dividend yield is low at 0.72%, indicating limited shareholder cash returns, likely favoring reinvestment in intangible assets.
Cboe Global Markets, Inc.
Cboe delivers solid, efficient returns with a 21.4% ROE and a 23.3% net margin, supported by a moderate P/E of 23.9. Its lower debt-to-equity ratio at 0.33 and a strong current ratio of 1.87 highlight financial stability. Dividend yield at 1.08% offers modest cash returns, balancing growth and income for investors.
Premium Valuation vs. Operational Safety
Moody’s commands a premium valuation driven by exceptional profitability but carries higher risk due to stretched multiples. Cboe offers a better balance with sound efficiency and financial health at a reasonable price. Value-seeking investors may prefer Cboe’s steadier profile, while growth-focused investors might tolerate Moody’s valuation premium.
Which one offers the Superior Shareholder Reward?
I compare Moody’s Corporation (MCO) and Cboe Global Markets, Inc. (CBOE) on shareholder returns through dividends and buybacks. Moody’s yields around 0.72% with a 30% payout ratio, supported by strong free cash flow coverage (3.0x). Moody’s also delivers consistent buybacks, enhancing total returns sustainably. Cboe offers a higher dividend yield near 1.08% with a lower payout ratio (~26%), but its free cash flow metrics and buyback data are less clear, suggesting reliance on dividend growth. Moody’s higher valuation multiples reflect market confidence in its capital allocation and buybacks. I conclude Moody’s superior share repurchase strategy combined with prudent dividend payments offers a more attractive and sustainable total return profile in 2026.
Comparative Score Analysis: The Strategic Profile
The radar chart reveals the fundamental DNA and trade-offs of Moody’s Corporation and Cboe Global Markets, highlighting their core financial strengths and vulnerabilities:
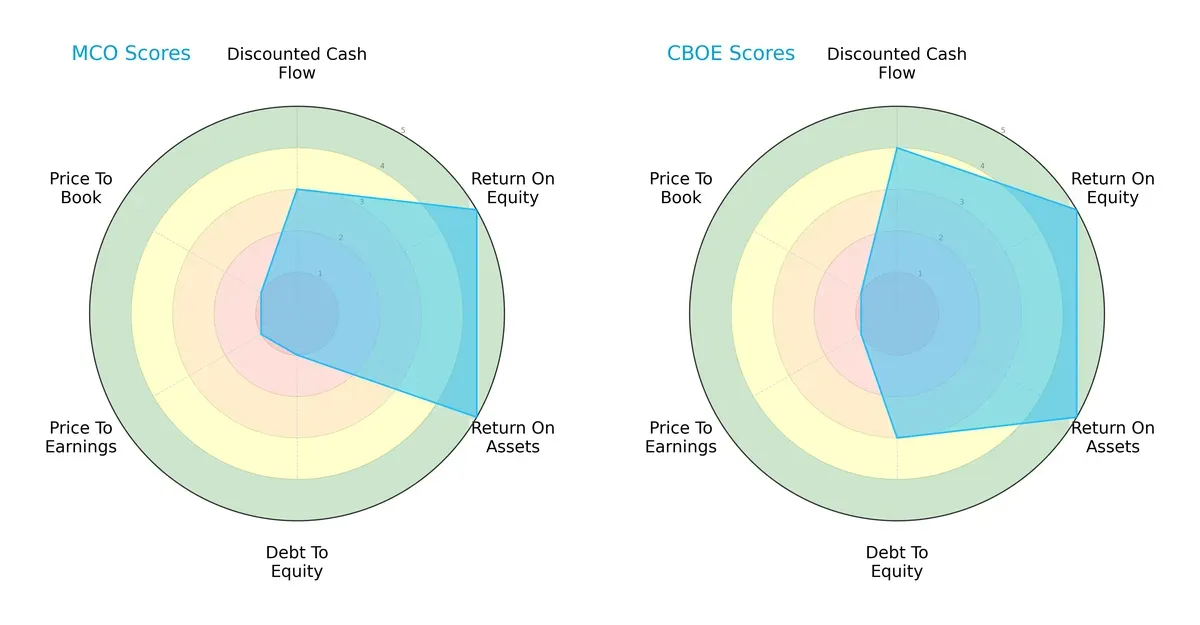
Moody’s and Cboe share strong ROE and ROA scores, signaling efficient profit generation and asset use. Cboe edges Moody’s on discounted cash flow, suggesting better intrinsic value projection. Moody’s suffers from a weak debt-to-equity ratio and poor valuation metrics, unlike Cboe, which has a more balanced financial risk profile. Overall, Cboe presents a steadier, more balanced strategic profile, while Moody’s depends heavily on operational efficiency yet struggles with leverage and valuation concerns.
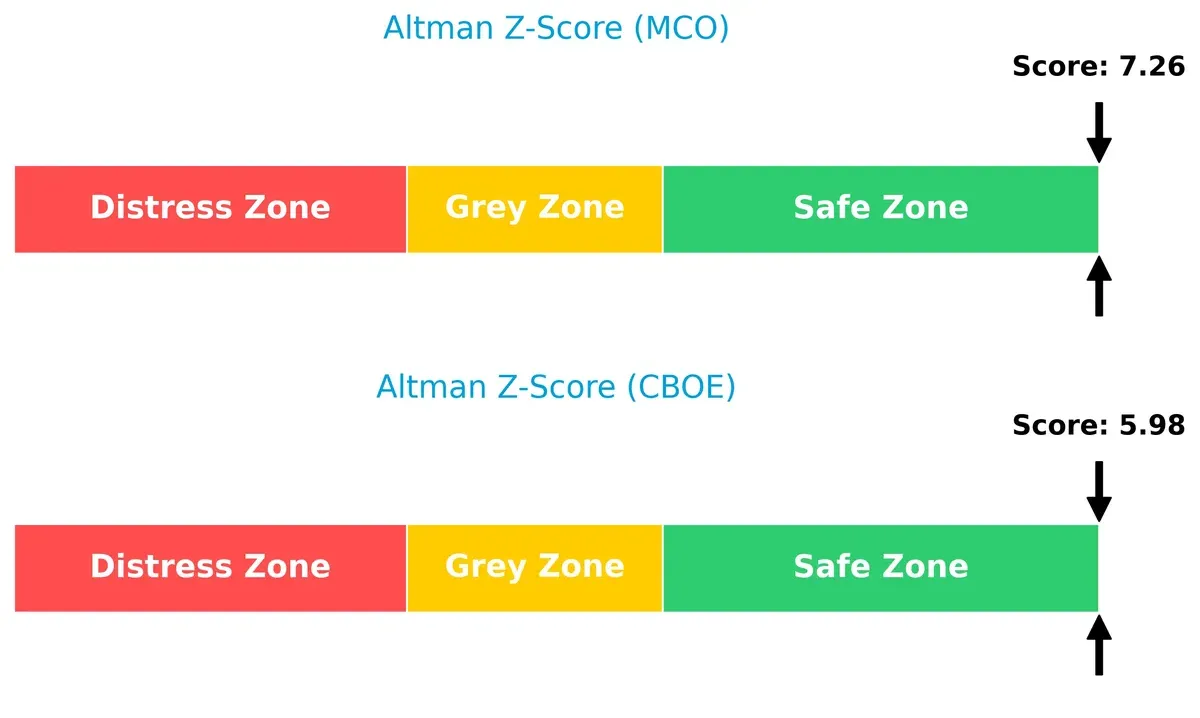
Bankruptcy Risk: Solvency Showdown
The Altman Z-Scores place both firms comfortably in the safe zone, with Moody’s at 7.26 and Cboe at 5.98, indicating strong resilience and low bankruptcy risk in the current economic cycle:
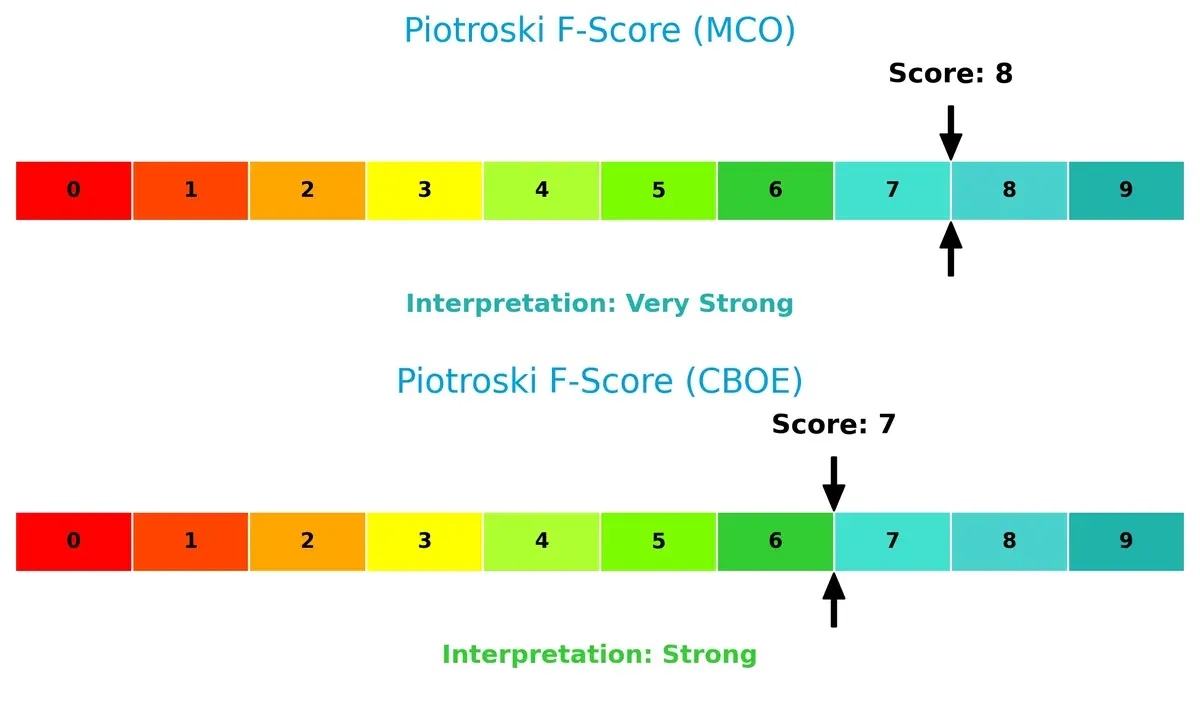
Financial Health: Quality of Operations
Moody’s Piotroski F-Score of 8 versus Cboe’s 7 confirms both companies are financially healthy. Moody’s slightly stronger internal metrics suggest superior profitability and operational quality, with no red flags apparent relative to Cboe:
How are the two companies positioned?
This section dissects the operational DNA of Moody’s and Cboe by comparing their revenue distribution by segment and analyzing their internal strengths and weaknesses. The goal is to confront their economic moats to determine which model delivers a more resilient, sustainable competitive advantage today.
Revenue Segmentation: The Strategic Mix
The following visual comparison dissects how Moody’s Corporation and Cboe Global Markets diversify their income streams and where their primary sector bets lie:
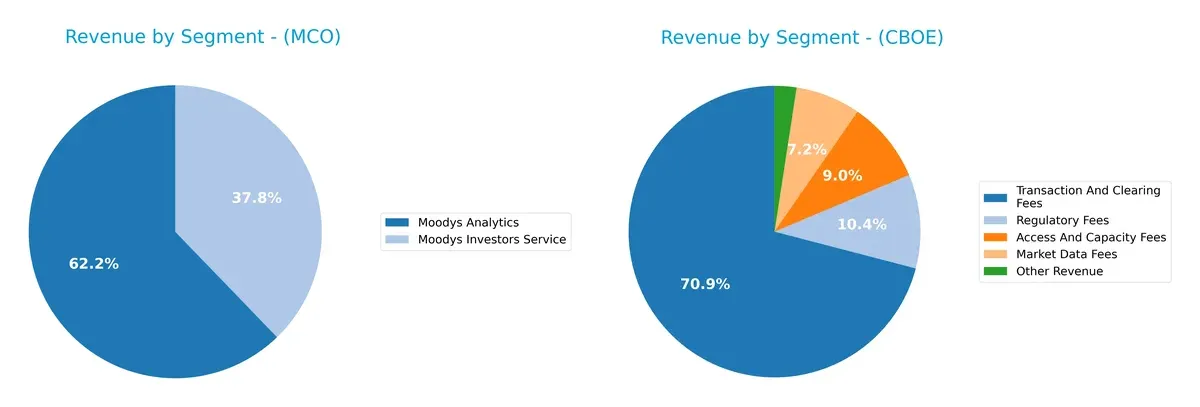
Moody’s revenue pivots mainly between two segments: $4.41B from Moodys Analytics and $2.68B from Moodys Investors Service in 2024. This split reflects a balanced but focused model. In contrast, Cboe relies heavily on Transaction and Clearing Fees at $2.9B, dwarfing its other sources like Regulatory Fees at $426M. Moody’s diversified approach reduces concentration risk. Cboe’s dominance in transaction fees anchors its ecosystem lock-in but exposes it to market volume fluctuations.
Strengths and Weaknesses Comparison
This table compares the Strengths and Weaknesses of Moody’s Corporation and Cboe Global Markets, Inc.:
Moody’s Corporation Strengths
- High net margin at 29.03%
- Exceptional ROE at 57.73%
- ROIC of 17.84% exceeds WACC
- Strong quick ratio at 1.43
- High fixed asset turnover at 8.13
- Diverse revenue streams across Moody’s Analytics and Investors Service
Cboe Global Markets, Inc. Strengths
- Favorable net margin at 23.33%
- Strong ROIC at 15.31% with low WACC of 5.28%
- High current and quick ratios at 1.87
- Low debt-to-equity ratio at 0.33
- Outstanding fixed asset turnover at 19.31
- Revenue diversified across multiple fee types
Moody’s Corporation Weaknesses
- Elevated P/E at 41.82 and P/B at 24.14 suggest high valuation
- Debt-to-equity ratio at 2.17 is high
- Asset turnover low at 0.46
- Dividend yield low at 0.72%
- Neutral current ratio at 1.43
- Debt to assets near 50%
Cboe Global Markets, Inc. Weaknesses
- Negative interest coverage at -28.95 signals financial strain
- P/B ratio of 5.11 is unfavorable
- Dividend yield only neutral at 1.08%
- Asset turnover neutral at 0.51
- Exposure to regulatory fees may add risk
- Limited geographic revenue data available
Moody’s exhibits strong profitability and asset efficiency but carries high leverage and valuation risks. Cboe shows solid capital structure and operational efficiency, though its negative interest coverage and regulatory fee exposure warrant caution. These contrasts suggest differing strategic focuses on growth, risk, and capital management.
The Moat Duel: Analyzing Competitive Defensibility
A structural moat is the only reliable shield protecting long-term profits from relentless competitive erosion:
Moody’s Corporation: Intangible Assets Powerhouse
Moody’s moat stems from its trusted credit ratings and analytics brand. It sustains high ROIC near 8%, reflecting durable pricing power. Yet, its slight ROIC decline signals emerging pressure from market shifts and technology in 2026.
Cboe Global Markets, Inc.: Network Effects Juggernaut
Cboe leverages robust network effects via its global options and futures exchanges, driving a strong ROIC above 10%. Unlike Moody’s, Cboe’s ROIC is growing 53%, fueled by expanding product lines and market reach in 2026.
Ratings Integrity vs. Market Network Effects
Cboe’s expanding ROIC and network-driven moat outpace Moody’s steady but slightly eroding advantage. I see Cboe better positioned to defend and grow market share amid evolving financial ecosystems.
Which stock offers better returns?
The past year reveals marked divergence in stock price performance and trading dynamics between Moody’s Corporation and Cboe Global Markets, Inc., highlighting distinct momentum trajectories and buyer activity shifts.
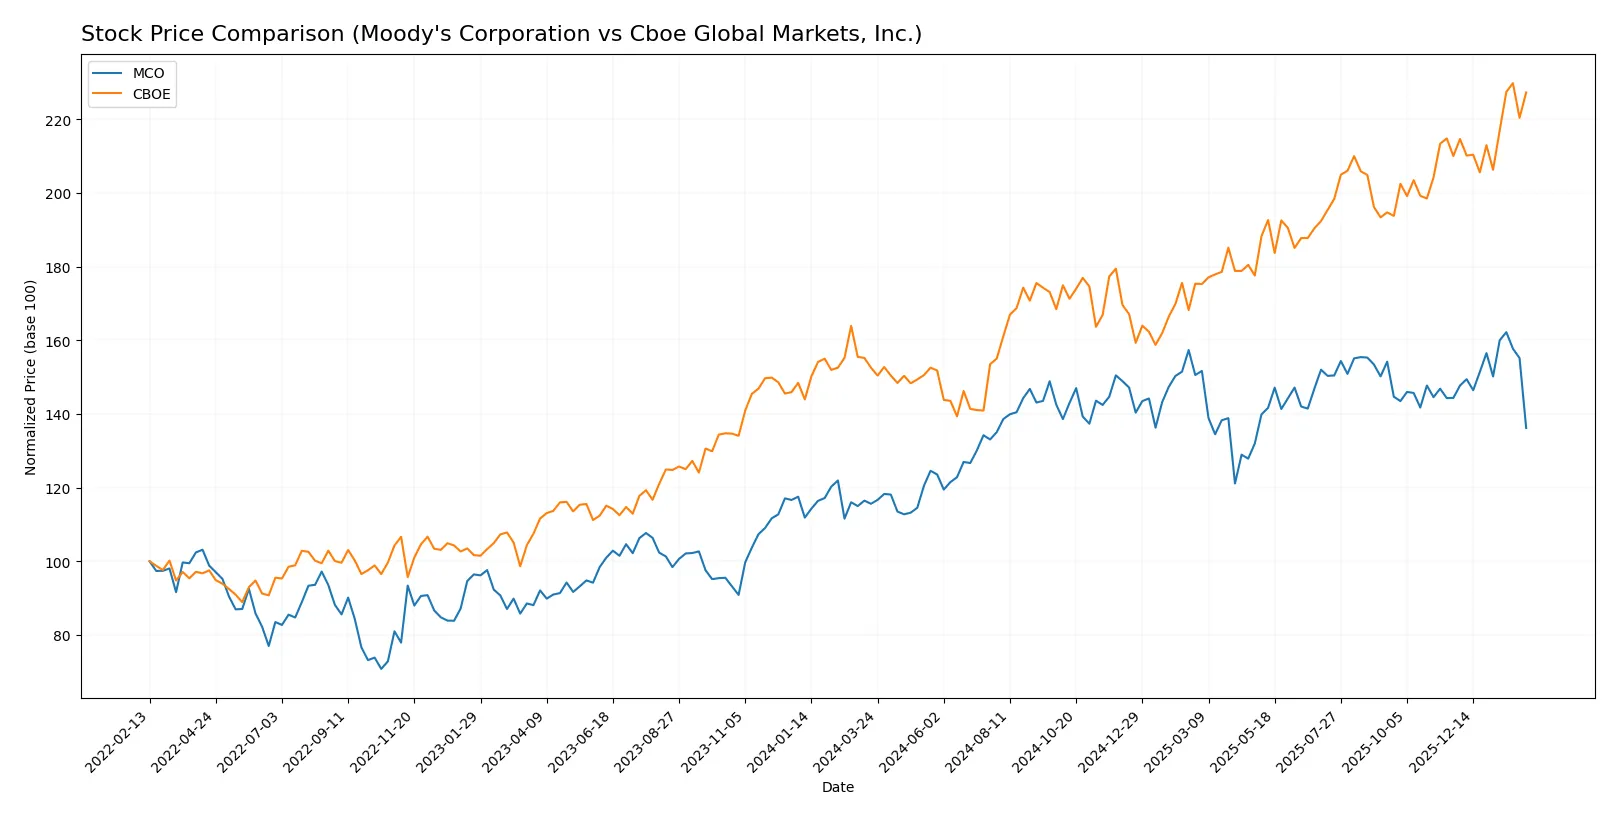
Trend Comparison
Moody’s Corporation shows a bullish trend over the past 12 months with a 17.79% price increase and accelerating momentum despite a recent 5.66% decline signaling short-term pressure.
Cboe Global Markets, Inc. posts a stronger bullish trend with a 48.95% rise over the year, sustained acceleration, and an 8.22% gain in the recent period, reflecting robust upward momentum.
Cboe Global Markets outperforms Moody’s overall, delivering the highest market price appreciation and stronger recent bullish momentum.
Target Prices
Analysts present a bullish consensus for both Moody’s Corporation and Cboe Global Markets, signaling upside potential from current prices.
| Company | Target Low | Target High | Consensus |
|---|---|---|---|
| Moody’s Corporation | 507 | 620 | 561.3 |
| Cboe Global Markets, Inc. | 240 | 295 | 274 |
Moody’s target consensus of 561.3 implies a significant 24% upside from the 452.49 current price. Cboe’s consensus target of 274 is almost flat versus the 273.09 price, suggesting limited near-term upside.

Don’t Let Luck Decide Your Entry Point
Optimize your entry points with our advanced ProRealTime indicators. You’ll get efficient buy signals with precise price targets for maximum performance. Start outperforming now!
How do institutions grade them?
The following tables summarize recent institutional grades for Moody’s Corporation and Cboe Global Markets, Inc.:
Moody’s Corporation Grades
This table shows recent grade updates by reputable financial institutions for Moody’s Corporation.
| Grading Company | Action | New Grade | Date |
|---|---|---|---|
| Wells Fargo | Maintain | Overweight | 2026-01-14 |
| Daiwa Capital | Upgrade | Outperform | 2026-01-13 |
| Morgan Stanley | Maintain | Equal Weight | 2026-01-13 |
| Evercore ISI Group | Maintain | Outperform | 2026-01-08 |
| Stifel | Upgrade | Buy | 2026-01-05 |
| Goldman Sachs | Upgrade | Buy | 2025-12-16 |
| Mizuho | Maintain | Neutral | 2025-10-28 |
| JP Morgan | Maintain | Overweight | 2025-10-23 |
| Stifel | Maintain | Hold | 2025-10-23 |
| BMO Capital | Maintain | Market Perform | 2025-10-23 |
Cboe Global Markets, Inc. Grades
This table details recent institutional grades for Cboe Global Markets, Inc.
| Grading Company | Action | New Grade | Date |
|---|---|---|---|
| TD Cowen | Maintain | Hold | 2026-01-14 |
| Piper Sandler | Maintain | Overweight | 2026-01-14 |
| Barclays | Maintain | Overweight | 2026-01-08 |
| UBS | Maintain | Neutral | 2026-01-07 |
| Morgan Stanley | Maintain | Underweight | 2025-12-22 |
| Barclays | Upgrade | Overweight | 2025-12-12 |
| Barclays | Maintain | Equal Weight | 2025-11-03 |
| Keefe, Bruyette & Woods | Maintain | Market Perform | 2025-11-03 |
| Citigroup | Maintain | Neutral | 2025-11-03 |
| UBS | Maintain | Neutral | 2025-11-03 |
Which company has the best grades?
Moody’s Corporation consistently receives higher grades, including multiple upgrades to “Buy” and “Outperform.” Cboe Global Markets mainly holds “Hold” or “Neutral” ratings, with fewer upgrades. This suggests stronger institutional confidence in Moody’s, potentially affecting investor sentiment and stock valuation.
Risks specific to each company
The following categories identify the critical pressure points and systemic threats facing both firms in the 2026 market environment:
1. Market & Competition
Moody’s Corporation
- Faces intense competition in credit ratings and analytics; pricing power supported by strong moat but challenged by fintech innovation.
Cboe Global Markets, Inc.
- Competes globally in options and derivatives markets; niche leadership but exposed to evolving market structures and low-cost platforms.
2. Capital Structure & Debt
Moody’s Corporation
- High debt-to-equity ratio (2.17) signals leverage risk; interest coverage is strong but debt load limits financial flexibility.
Cboe Global Markets, Inc.
- Low debt-to-equity (0.33) and debt-to-assets (18.1%) reflects conservative leverage; however, negative interest coverage is a red flag on debt servicing.
3. Stock Volatility
Moody’s Corporation
- Beta at 1.44 indicates higher volatility than market; stock price range wide, suggesting sensitivity to macro and sector swings.
Cboe Global Markets, Inc.
- Beta of 0.36 shows defensive stock behavior; narrower price range reflects stability but may limit high return potential.
4. Regulatory & Legal
Moody’s Corporation
- Subject to global financial regulations on credit ratings; reputational risks from rating controversies may invite scrutiny.
Cboe Global Markets, Inc.
- Operates in heavily regulated exchanges; faces compliance costs and legal risks from market manipulation or trading irregularities.
5. Supply Chain & Operations
Moody’s Corporation
- Relies on data accuracy and technology platforms; risks from cyber threats and data breaches remain elevated.
Cboe Global Markets, Inc.
- Depends on trading infrastructure and clearinghouses; system outages or technical failures could severely disrupt operations.
6. ESG & Climate Transition
Moody’s Corporation
- Increasing pressure to integrate ESG into credit assessments; potential reputational risk if lagging peers.
Cboe Global Markets, Inc.
- Developing ESG-linked products; risks lie in evolving standards and investor demand for transparency and impact.
7. Geopolitical Exposure
Moody’s Corporation
- Global footprint exposes it to sovereign risk and geopolitical tensions affecting credit markets.
Cboe Global Markets, Inc.
- International segments face regulatory divergence and currency volatility; geopolitical tensions may disrupt cross-border trading.
Which company shows a better risk-adjusted profile?
Moody’s largest risk is its heavy leverage, increasing financial vulnerability despite strong profitability and stable operations. Cboe’s main concern is its negative interest coverage, hinting at debt servicing stress despite conservative leverage. Overall, Cboe presents a better risk-adjusted profile, supported by a more favorable ratio distribution and a safer balance sheet. Moody’s elevated beta and debt-to-equity ratio warrant caution, especially in volatile economic cycles.
Final Verdict: Which stock to choose?
Moody’s Corporation wields a superpower in delivering robust returns on equity and invested capital, signaling efficient capital allocation and strong profitability. Its point of vigilance lies in elevated leverage and stretched valuation multiples. It suits investors with an appetite for aggressive growth and can tolerate volatility.
Cboe Global Markets, Inc. boasts a strategic moat through its growing return on invested capital and conservative leverage, offering a safer harbor in turbulent markets. Its recurring revenue and accelerating stock trend add to its appeal. It fits well in a GARP (Growth at a Reasonable Price) portfolio seeking steady expansion with risk control.
If you prioritize aggressive capital efficiency and high returns, Moody’s outshines with superior profitability despite higher leverage risk. However, if you seek better stability and a sustainable competitive advantage with moderate risk, Cboe offers a more balanced growth profile commanding a reasonable valuation premium.
Disclaimer: Investment carries a risk of loss of initial capital. The past performance is not a reliable indicator of future results. Be sure to understand risks before making an investment decision.
Go Further
I encourage you to read the complete analyses of Moody’s Corporation and Cboe Global Markets, Inc. to enhance your investment decisions: