Home > Comparison > Financial Services > ICE vs CBOE
The strategic rivalry between Intercontinental Exchange, Inc. (ICE) and Cboe Global Markets, Inc. (CBOE) shapes the financial data and stock exchanges sector. ICE operates as a diversified exchange operator with a broad footprint in derivatives, fixed income, and mortgage technology. CBOE focuses on options and equity trading with a leaner, specialized model. This analysis will reveal which firm offers superior risk-adjusted returns for a portfolio seeking balanced exposure to financial market infrastructure.
Table of contents
Companies Overview
Intercontinental Exchange and Cboe Global Markets both dominate the financial data and exchange sector with distinct operational models.
Intercontinental Exchange, Inc.: Global Exchange Innovator
Intercontinental Exchange operates a vast network of regulated exchanges, clearing houses, and listings venues across multiple continents. It generates revenue by facilitating trading and clearing of derivatives, commodities, and equities. In 2026, ICE focuses strategically on expanding its mortgage technology platform alongside its core fixed income and data services, enhancing its comprehensive market infrastructure.
Cboe Global Markets, Inc.: Options Market Specialist
Cboe Global Markets primarily operates as a leading options exchange worldwide with diversified segments including equities, futures, and foreign exchange. It profits from transaction fees and listing services across North America, Europe, and Asia Pacific. The company’s 2026 strategy emphasizes strengthening its pan-regional derivatives offerings and expanding its global FX trading capabilities.
Strategic Collision: Similarities & Divergences
Both companies operate in financial exchanges and data services, yet ICE pursues a broad multi-asset ecosystem while Cboe specializes in options and derivatives markets. Their competition centers on market share in derivatives trading and exchange listings. ICE’s scale and technology diversification contrast with Cboe’s niche focus and international reach, defining distinct risk-return profiles for investors.
Income Statement Comparison
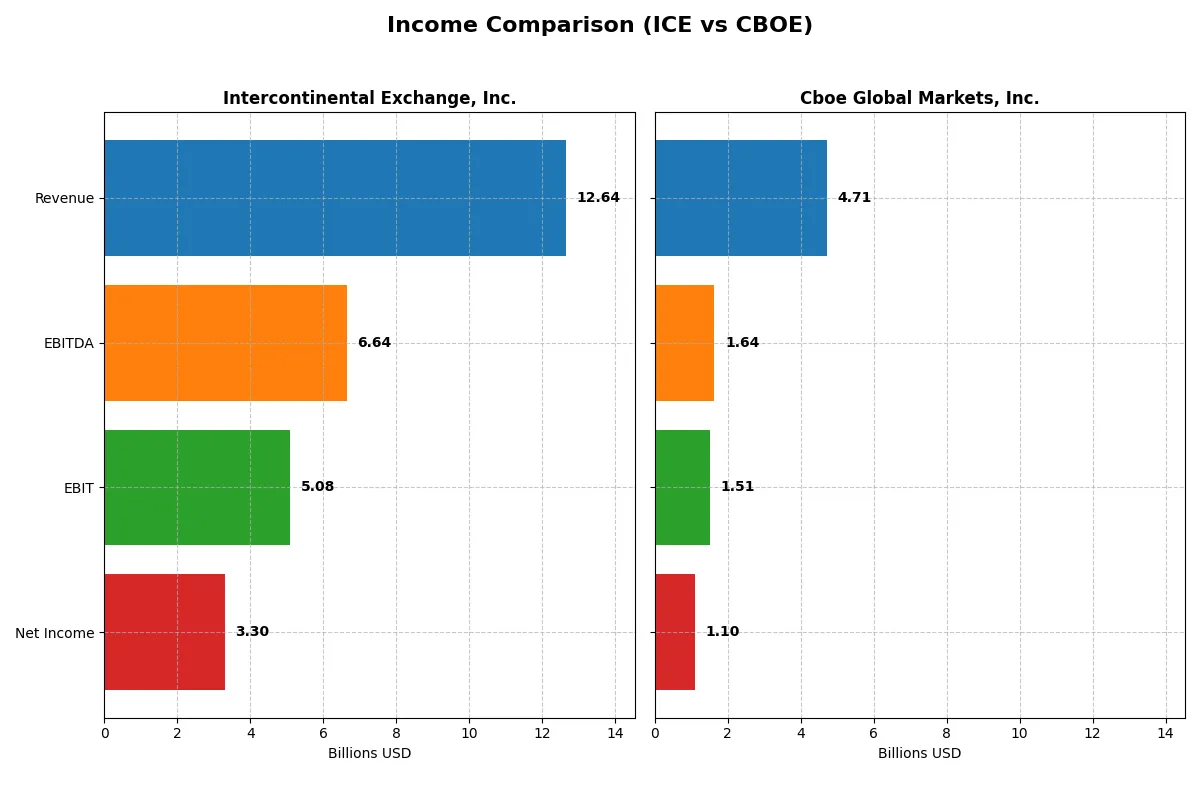
This data dissects the core profitability and scalability of both corporate engines to reveal who dominates the bottom line:
| Metric | Intercontinental Exchange, Inc. (ICE) | Cboe Global Markets, Inc. (CBOE) |
|---|---|---|
| Revenue | 12.6B | 4.7B |
| Cost of Revenue | 4.8B | 2.4B |
| Operating Expenses | 2.9B | 0.7B |
| Gross Profit | 7.8B | 2.3B |
| EBITDA | 6.6B | 1.6B |
| EBIT | 5.1B | 1.5B |
| Interest Expense | 0.8B | -0.05B |
| Net Income | 3.3B | 1.1B |
| EPS | 5.8 | 10.46 |
| Fiscal Year | 2025 | 2025 |
Income Statement Analysis: The Bottom-Line Duel
This income statement comparison reveals which company operates its financial engine with greater efficiency and growth momentum.
Intercontinental Exchange, Inc. Analysis
Intercontinental Exchange (ICE) shows steady revenue growth from $9.2B in 2021 to $12.6B in 2025, with net income fluctuating but reaching $3.3B in 2025. Gross margin remains strong at 61.9%, and net margin at 26.1%, reflecting solid profitability. The 2025 figures highlight improved efficiency driven by a 20.7% EPS growth despite some unfavorable long-term net income trends.
Cboe Global Markets, Inc. Analysis
Cboe Global Markets (CBOE) grows revenue from $3.5B in 2021 to $4.7B in 2025, with net income surging to $1.1B. Gross margin at 48.9% and net margin at 23.3% indicate healthy profitability. The latest year shows robust momentum, with 44.5% EPS growth and over 100% net income growth over five years, signaling accelerating operational efficiency.
Margin Strength vs. Earnings Momentum
ICE leads with higher absolute revenue and superior gross margins, but CBOE outpaces in net income growth and margin expansion. CBOE’s consistent improvement in profitability metrics and rapid EPS growth suggest a sharper upward trajectory. For investors targeting growth and margin expansion, CBOE’s profile appears more compelling, while ICE offers scale and stable profitability.
Financial Ratios Comparison
These vital ratios act as a diagnostic tool to expose the underlying fiscal health, valuation premiums, and capital efficiency of the companies compared:
| Ratios | Intercontinental Exchange (ICE) | Cboe Global Markets (CBOE) |
|---|---|---|
| ROE | 11.40% | 21.41% |
| ROIC | 7.02% | 15.31% |
| P/E | 28.00 | 23.89 |
| P/B | 3.19 | 5.11 |
| Current Ratio | 1.02 | 1.87 |
| Quick Ratio | 1.02 | 1.87 |
| D/E | 0.72 | 0.33 |
| Debt-to-Assets | 15.31% | 18.10% |
| Interest Coverage | 6.27 | -28.95 |
| Asset Turnover | 0.09 | 0.51 |
| Fixed Asset Turnover | 4.70 | 19.31 |
| Payout ratio | 33.44% | 25.70% |
| Dividend yield | 1.19% | 1.08% |
| Fiscal Year | 2025 | 2025 |
Efficiency & Valuation Duel: The Vital Signs
Ratios act as a company’s DNA, exposing hidden risks and operational excellence beneath surface-level financials.
Intercontinental Exchange, Inc. (ICE)
ICE posts a solid net margin of 26.1% but a moderate ROE of 11.4%, indicating steady profitability with room for improvement. Its P/E of 28.0 signals a stretched valuation relative to earnings. The company returns value through a 1.19% dividend yield, balancing shareholder payouts with reinvestment in operations.
Cboe Global Markets, Inc. (CBOE)
CBOE shows stronger profitability with a 21.4% ROE and a 23.3% net margin, reflecting efficient capital use. Its P/E of 23.9 is more reasonable, suggesting the stock is fairly valued. Shareholders receive a 1.08% dividend, supported by favorable capital structure metrics and a focus on operational growth.
Premium Valuation vs. Operational Efficiency
CBOE offers a better balance of profitability and valuation, with more favorable ratios and stronger returns on equity. ICE’s higher valuation and moderate profitability suit investors prioritizing steady income, while CBOE fits those seeking operational efficiency and growth potential.
Which one offers the Superior Shareholder Reward?
I compare Intercontinental Exchange (ICE) and Cboe Global Markets (CBOE) on dividends and buybacks to assess shareholder reward. ICE yields ~1.2% with a 33-38% payout ratio, supported by strong FCF coverage (~3.15x). It also executes steady buybacks, amplifying returns. CBOE offers a similar yield (~1.1%) but with a lower payout ratio (~25-36%) and less clear buyback activity, relying more on reinvestment. ICE’s balanced distribution, combining dividends with consistent buybacks, appears more sustainable and value-accretive in 2026. I conclude ICE delivers the superior total shareholder reward.
Comparative Score Analysis: The Strategic Profile
The radar chart reveals the fundamental DNA and trade-offs of Intercontinental Exchange, Inc. and Cboe Global Markets, Inc., highlighting their financial strengths and weaknesses:
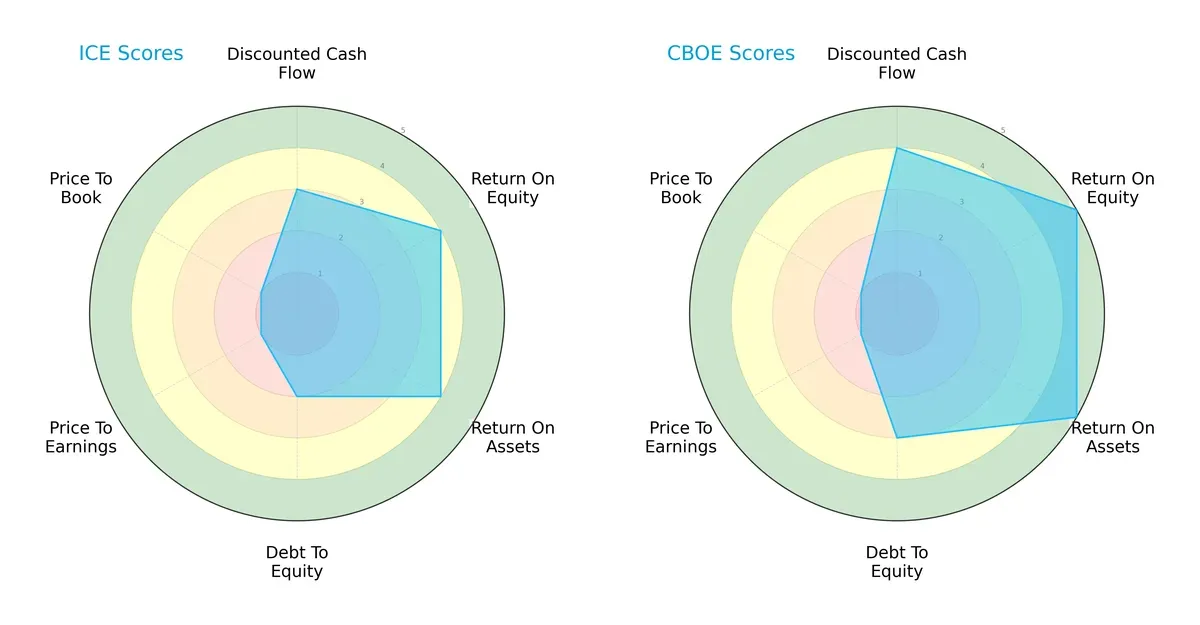
Cboe Global Markets scores higher on DCF (4 vs. 3), ROE (5 vs. 4), and ROA (5 vs. 4), indicating superior profitability and asset efficiency. Intercontinental Exchange shows a weaker debt-to-equity score (2 vs. 3), signaling higher leverage risk. Both firms share very unfavorable valuations (PE/PB scores at 1). Cboe presents a more balanced financial profile, while ICE relies more on operational returns but carries greater financial risk.
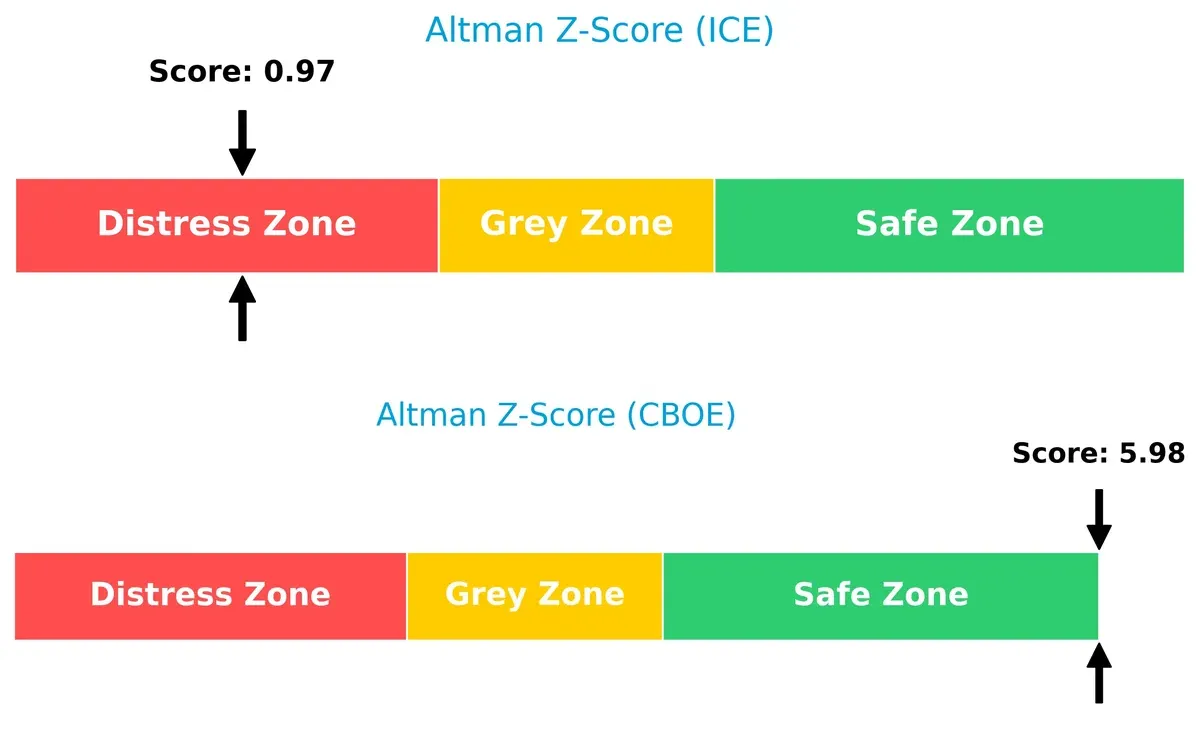
Bankruptcy Risk: Solvency Showdown
The Altman Z-Score delta strongly favors Cboe Global Markets, which sits comfortably in the safe zone (5.98), while Intercontinental Exchange languishes in the distress zone (0.97). This gap implies Cboe’s far stronger solvency and lower bankruptcy risk in this market cycle:
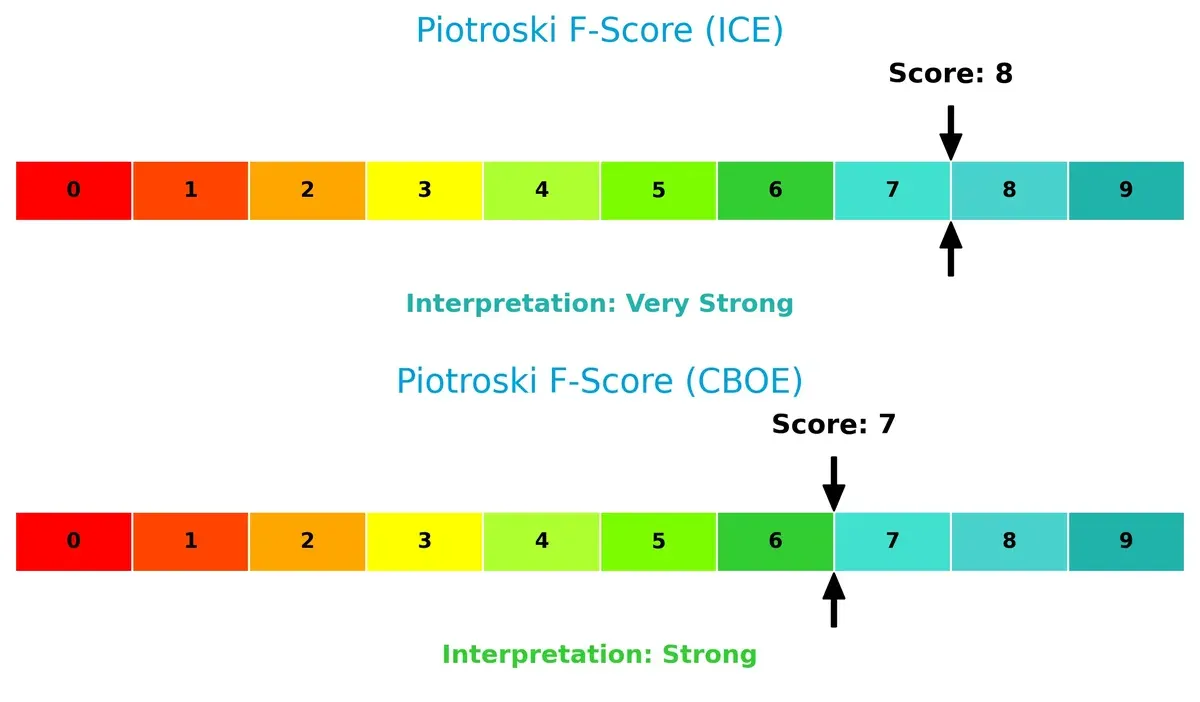
Financial Health: Quality of Operations
Intercontinental Exchange edges out slightly on the Piotroski F-Score with 8 (very strong) versus Cboe’s 7 (strong). ICE’s higher score reflects more robust internal financial controls and operational quality. However, Cboe’s solid 7 still indicates healthy fundamentals without immediate red flags:
How are the two companies positioned?
This section dissects the operational DNA of ICE and CBOE by comparing their revenue distribution and internal strengths and weaknesses. The goal is to confront their economic moats to reveal which model delivers the most resilient and sustainable competitive advantage today.
Revenue Segmentation: The Strategic Mix
This visual comparison dissects how Intercontinental Exchange, Inc. and Cboe Global Markets, Inc. diversify their income streams and where their primary sector bets lie:
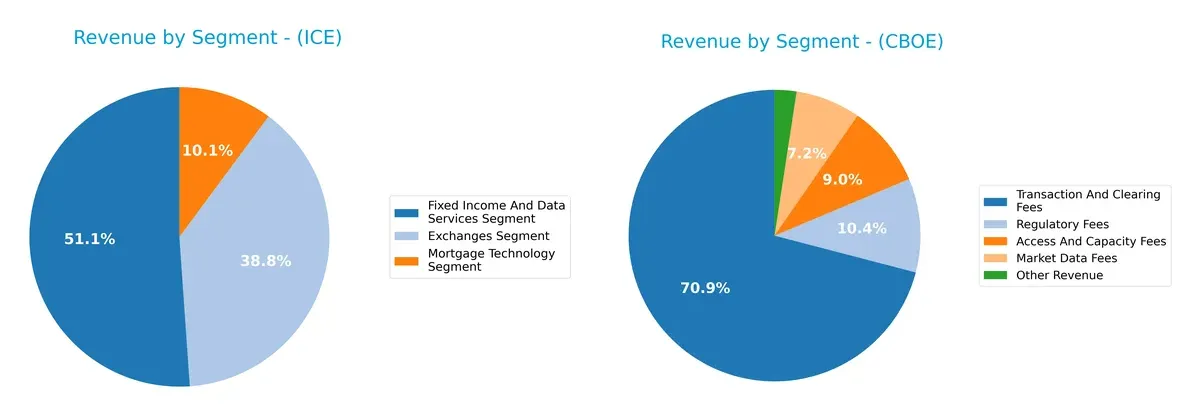
Intercontinental Exchange, Inc. anchors its revenue in Fixed Income and Data Services at $1.36B and Exchanges at $1.03B, showing a balanced diversification across segments. In contrast, Cboe Global Markets, Inc. pivots heavily on Transaction and Clearing Fees, which dwarf other streams at $2.9B, signaling concentration risk but strong infrastructure dominance. ICE’s mix supports ecosystem lock-in, whereas CBOE’s focus suggests sensitivity to trading volumes.
Strengths and Weaknesses Comparison
This table compares the strengths and weaknesses of ICE and CBOE based on diversification, profitability, financials, innovation, global presence, and market share:
ICE Strengths
- Diversified revenue across Exchanges, Fixed Income, and Mortgage Technology segments
- Favorable net margin of 26.14%
- Strong quick ratio at 1.02 supports liquidity
- Low debt-to-assets at 15.31% reduces financial risk
- Favorable interest coverage of 6.51 indicates strong debt servicing
- Significant US and Europe presence with $6.3B US revenue
CBOE Strengths
- Strong profitability with ROE 21.41% and ROIC 15.31% well above WACC
- Favorable current and quick ratios at 1.87 indicate liquidity strength
- Low debt-to-equity of 0.33 shows conservative leverage
- High fixed asset turnover of 19.31 signals efficient asset use
- Diverse revenue from derivatives, cash markets, and data fees
- Favorable WACC at 5.28% supports value creation
ICE Weaknesses
- Price multiples unfavorable: PE 28.0 and PB 3.19 suggest premium valuation
- ROIC below WACC (7.02% vs 7.61%) questions capital efficiency
- Asset turnover at 0.09 is low, indicating less efficient asset use
- Neutral ROE at 11.4% limits equity returns
- Current ratio only neutral at 1.02 may constrain working capital flexibility
CBOE Weaknesses
- Negative interest coverage at -28.95 signals potential financial distress
- PB ratio high at 5.11 suggests overvaluation risk
- Asset turnover moderate at 0.51 reflects average operational efficiency
- Dividend yield neutral at 1.08%, less attractive for income investors
Overall, ICE shows strength in diversified revenue streams and solid liquidity but faces challenges in asset efficiency and valuation metrics. CBOE excels in profitability and leverage control but must address its negative interest coverage and valuation concerns. These factors shape their financial resilience and strategic options.
The Moat Duel: Analyzing Competitive Defensibility
A structural moat is the only reliable shield protecting long-term profits from relentless competition erosion. Let’s dissect the moats of two exchange giants:
Intercontinental Exchange, Inc. (ICE): Diversified Market Network Moat
ICE leverages extensive network effects across global exchanges and clearinghouses, reflected in stable 40% EBIT margins. Its expanding mortgage and fixed income data services could deepen this moat in 2026, though rising operating expenses pose caution.
Cboe Global Markets, Inc. (CBOE): Focused Options Market Leadership
CBOE’s moat centers on proprietary options market dominance and strategic index partnerships, driving a robust 32% EBIT margin and accelerating 53% ROIC growth. Its global FX and equities segments offer promising avenues for disruption and expansion.
Network Scale vs. Market Focus: The Moat Showdown
ICE’s diverse network creates breadth but struggles to convert scale into value, showing a slightly unfavorable moat with ROIC below WACC. CBOE’s focused leadership yields a wider moat with sustainable excess returns. I see CBOE as better equipped to defend and expand its market share in 2026.
Which stock offers better returns?
Over the past year, both stocks show strong upward momentum with notable price appreciation and accelerating trends, reflecting active trading and sustained investor interest.
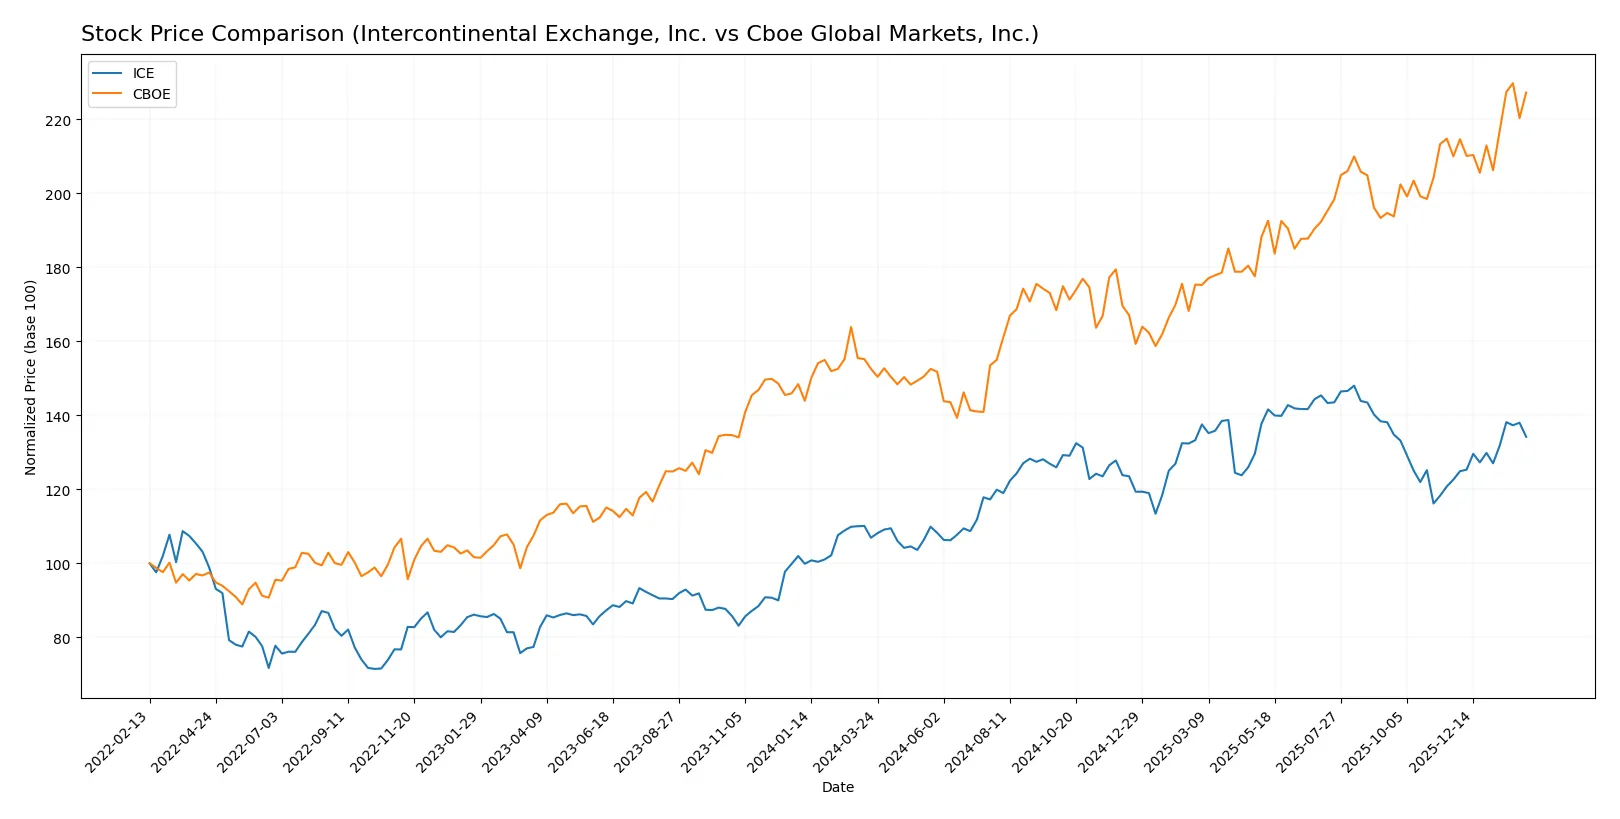
Trend Comparison
Intercontinental Exchange, Inc. (ICE) displays a bullish trend with a 25.52% price increase over 12 months, accelerating alongside a 14.83 volatility measure and a high of 186.4.
Cboe Global Markets, Inc. (CBOE) also shows a bullish trend but with a stronger 48.95% rise over the same period, accelerating and marked by higher volatility at 27.47 and a peak of 276.39.
CBOE outperformed ICE by delivering the highest market gains, nearly doubling ICE’s price appreciation while maintaining an accelerating trend throughout the past year.
Target Prices
Analysts present a positive target price consensus for both Intercontinental Exchange, Inc. and Cboe Global Markets, Inc.
| Company | Target Low | Target High | Consensus |
|---|---|---|---|
| Intercontinental Exchange, Inc. | 180 | 211 | 192.33 |
| Cboe Global Markets, Inc. | 240 | 295 | 274 |
For ICE, the consensus target of 192.33 suggests upside from the current 169 price. CBOE’s consensus target of 274 aligns closely with its present price near 273, indicating fair valuation.

Don’t Let Luck Decide Your Entry Point
Optimize your entry points with our advanced ProRealTime indicators. You’ll get efficient buy signals with precise price targets for maximum performance. Start outperforming now!
How do institutions grade them?
Here is a comparison of institutional grades for Intercontinental Exchange, Inc. and Cboe Global Markets, Inc.:
Intercontinental Exchange, Inc. Grades
The table below summarizes recent grades from leading financial institutions for ICE:
| Grading Company | Action | New Grade | Date |
|---|---|---|---|
| Barclays | Maintain | Overweight | 2026-02-06 |
| Morgan Stanley | Maintain | Equal Weight | 2026-01-15 |
| Piper Sandler | Maintain | Overweight | 2026-01-14 |
| TD Cowen | Maintain | Buy | 2026-01-14 |
| Barclays | Maintain | Overweight | 2026-01-08 |
| UBS | Maintain | Buy | 2026-01-07 |
| Morgan Stanley | Maintain | Equal Weight | 2025-12-22 |
| JP Morgan | Maintain | Overweight | 2025-10-31 |
| Barclays | Maintain | Overweight | 2025-10-31 |
| TD Cowen | Maintain | Buy | 2025-10-31 |
Cboe Global Markets, Inc. Grades
The following table shows recent grades from reputable firms for CBOE:
| Grading Company | Action | New Grade | Date |
|---|---|---|---|
| TD Cowen | Maintain | Hold | 2026-01-14 |
| Piper Sandler | Maintain | Overweight | 2026-01-14 |
| Barclays | Maintain | Overweight | 2026-01-08 |
| UBS | Maintain | Neutral | 2026-01-07 |
| Morgan Stanley | Maintain | Underweight | 2025-12-22 |
| Barclays | Upgrade | Overweight | 2025-12-12 |
| Barclays | Maintain | Equal Weight | 2025-11-03 |
| Keefe, Bruyette & Woods | Maintain | Market Perform | 2025-11-03 |
| Citigroup | Maintain | Neutral | 2025-11-03 |
| UBS | Maintain | Neutral | 2025-11-03 |
Which company has the best grades?
ICE consistently receives overweight and buy ratings from top firms, indicating stronger institutional confidence. CBOE’s ratings are more mixed, including hold and underweight grades. Investors might view ICE as the more favored stock based on current institutional sentiment.
Risks specific to each company
The following categories identify the critical pressure points and systemic threats facing both firms in the 2026 market environment:
1. Market & Competition
Intercontinental Exchange, Inc. (ICE)
- Operates multiple exchanges and clearing houses globally, facing intense competition in diverse markets.
Cboe Global Markets, Inc. (CBOE)
- Focused on options and equities trading with strong international presence but narrower product scope.
2. Capital Structure & Debt
Intercontinental Exchange, Inc. (ICE)
- Moderate leverage (D/E 0.72), manageable debt-to-assets at 15.3%, good interest coverage of 6.5x.
Cboe Global Markets, Inc. (CBOE)
- Lower leverage (D/E 0.33), slightly higher debt-to-assets at 18.1%, but poor interest coverage at -28.95x, signaling risk.
3. Stock Volatility
Intercontinental Exchange, Inc. (ICE)
- Beta near 1.03 indicates market-correlated volatility, typical for financial sector.
Cboe Global Markets, Inc. (CBOE)
- Very low beta at 0.36 suggests defensive stock, less sensitive to market swings.
4. Regulatory & Legal
Intercontinental Exchange, Inc. (ICE)
- Operates under multiple jurisdictions with complex regulations, increasing compliance costs.
Cboe Global Markets, Inc. (CBOE)
- Also subject to stringent regulations across regions, but smaller scale may reduce regulatory burden.
5. Supply Chain & Operations
Intercontinental Exchange, Inc. (ICE)
- Diverse operations in exchanges, data, and mortgage technology, adding operational complexity.
Cboe Global Markets, Inc. (CBOE)
- Concentrated on trading platforms and indices, simpler operations but reliant on technology stability.
6. ESG & Climate Transition
Intercontinental Exchange, Inc. (ICE)
- Increasing ESG initiatives to meet investor demands; integration complexity across segments.
Cboe Global Markets, Inc. (CBOE)
- ESG efforts growing but less diversified business may ease transition risks.
7. Geopolitical Exposure
Intercontinental Exchange, Inc. (ICE)
- Global footprint across US, Europe, Asia increases exposure to geopolitical tensions and regulatory divergence.
Cboe Global Markets, Inc. (CBOE)
- Primarily North American focused, limiting direct geopolitical risks but less geographic diversification.
Which company shows a better risk-adjusted profile?
Cboe Global Markets faces a critical risk with its negative interest coverage, raising concerns about debt servicing capacity. Intercontinental Exchange’s most significant risk is its distress-level Altman Z-score, indicating financial vulnerability. Despite ICE’s operational complexity and financial strain, CBOE’s superior leverage and safe-zone Altman Z-score give it a better risk-adjusted profile in 2026. The stark contrast in interest coverage and bankruptcy risk scores justifies my heightened caution on ICE.
Final Verdict: Which stock to choose?
Intercontinental Exchange, Inc. (ICE) shines with its disciplined capital allocation and steady revenue growth, making it a dependable cash generator. Its point of vigilance lies in a modest return on invested capital that slightly trails its cost of capital. ICE suits investors seeking steady income with moderate growth exposure.
Cboe Global Markets, Inc. (CBOE) boasts a robust economic moat, reflected in its strong ROIC well above WACC and accelerating profitability. It offers a more aggressive growth profile with a solid balance sheet and operational efficiency, presenting a safer harbor relative to ICE’s leverage. CBOE fits well for growth-oriented portfolios prioritizing competitive advantage.
If you prioritize consistent cash flow and moderate risk, ICE is the compelling choice due to its reliable income generation and operational resilience. However, if you seek superior growth and a durable competitive moat, CBOE outshines with better stability and expanding returns on invested capital. Each scenario demands prudent risk assessment aligned with your investment horizon.
Disclaimer: Investment carries a risk of loss of initial capital. The past performance is not a reliable indicator of future results. Be sure to understand risks before making an investment decision.
Go Further
I encourage you to read the complete analyses of Intercontinental Exchange, Inc. and Cboe Global Markets, Inc. to enhance your investment decisions: