Home > Comparison > Industrials > CAT vs PCAR
The strategic rivalry between Caterpillar Inc. and PACCAR Inc. shapes the Industrials sector’s competitive landscape. Caterpillar operates as a diversified, capital-intensive machinery manufacturer spanning construction, mining, and energy equipment. PACCAR focuses on commercial truck design, manufacturing, and financial services, emphasizing specialized vehicle solutions. This analysis explores their contrasting models to identify which company offers superior risk-adjusted returns, guiding portfolio decisions amid evolving industrial demand cycles.
Table of contents
Companies Overview
Caterpillar and PACCAR dominate industrial machinery and commercial truck markets with distinct global footprints.
Caterpillar Inc.: Global Powerhouse in Construction & Mining Equipment
Caterpillar leads in construction and mining equipment manufacturing, generating revenue through heavy machinery sales and engine solutions. Its strategic focus in 2026 emphasizes expanding autonomous vehicle technologies and enhancing mining performance solutions. Caterpillar’s diverse product lines across construction, resource industries, and energy sectors highlight its competitive advantage in industrial innovation and scale.
PACCAR Inc.: Premier Commercial Truck Manufacturer
PACCAR specializes in designing and distributing heavy-duty commercial trucks, operating through Truck, Parts, and Financial Services segments. It drives revenue via truck sales under Kenworth, Peterbilt, and DAF brands and aftermarket parts distribution. In 2026, PACCAR prioritizes expanding full-service leasing and finance offerings, reinforcing customer retention and dealer network strength in global markets.
Strategic Collision: Similarities & Divergences
Both companies serve the industrial sector but adopt contrasting philosophies—Caterpillar focuses on broad industrial machinery with a technology-driven approach, while PACCAR concentrates on a specialized truck ecosystem. Their battleground lies in capital-intensive equipment markets, competing indirectly through customer financing and service models. Caterpillar offers a diversified industrial profile; PACCAR presents a leaner, truck-centric investment case.
Income Statement Comparison
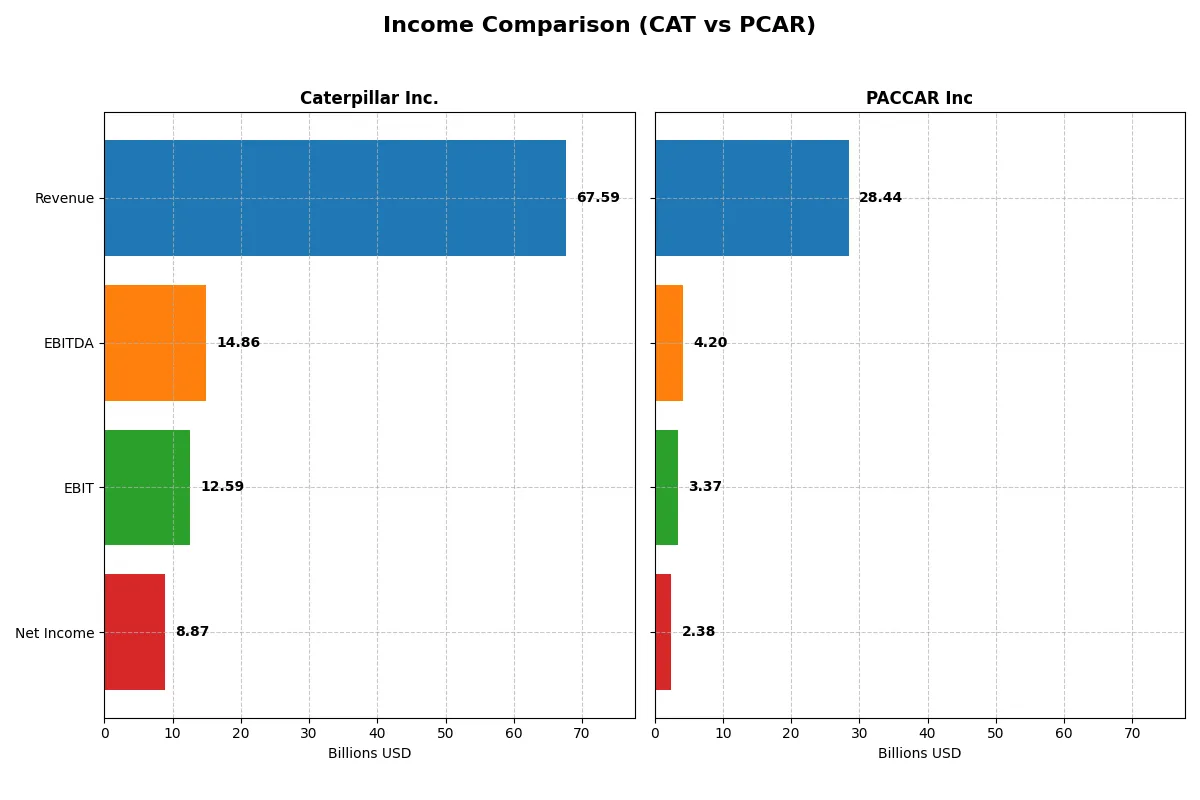
The following data dissects the core profitability and scalability of both corporate engines to reveal who dominates the bottom line:
| Metric | Caterpillar Inc. (CAT) | PACCAR Inc (PCAR) |
|---|---|---|
| Revenue | 67.6B | 28.4B |
| Cost of Revenue | 45.7B | 23.8B |
| Operating Expenses | 10.6B | 1.66B |
| Gross Profit | 21.9B | 4.62B |
| EBITDA | 14.9B | 4.2B |
| EBIT | 12.6B | 3.37B |
| Interest Expense | 1.03B | 347M |
| Net Income | 8.87B | 2.38B |
| EPS | 18.9 | 4.52 |
| Fiscal Year | 2025 | 2025 |
Income Statement Analysis: The Bottom-Line Duel
The income statement comparison below reveals each company’s operational efficiency and profitability trends over the recent years.
Caterpillar Inc. Analysis
Caterpillar’s revenue rose steadily from 51B in 2021 to nearly 68B in 2025, with net income following suit, reaching 8.9B in 2025. Its gross margin remains strong at 32.3%, though it dipped slightly in 2025. Despite a 4.3% revenue increase last year, margins and net income showed a downward trend, signaling some pressure on profitability.
PACCAR Inc Analysis
PACCAR’s revenue grew overall from 23.5B in 2021 to 28.4B in 2025 but declined 15.5% in the latest year. Net income mirrored this pattern, falling sharply to 2.4B in 2025. Gross margin is lower than Caterpillar’s at 16.2%, yet net margin holds at a respectable 8.4%. The recent year’s significant margin contraction highlights operational challenges.
Margin Strength vs. Growth Consistency
Caterpillar outperforms PACCAR with superior margins and larger absolute profits despite recent margin softness. PACCAR’s sharper decline in revenue and profits last year marks a clear warning sign. For investors prioritizing margin resilience and scale, Caterpillar’s profile is more attractive given its sustained profitability and stronger operational leverage.
Financial Ratios Comparison
These vital ratios act as a diagnostic tool to expose the underlying fiscal health, valuation premiums, and capital efficiency of the companies compared below:
| Ratios | Caterpillar Inc. (CAT) | PACCAR Inc (PCAR) |
|---|---|---|
| ROE | 41.62% | 12.33% |
| ROIC | 11.42% | 6.39% |
| P/E | 30.12 | 24.25 |
| P/B | 12.54 | 2.99 |
| Current Ratio | 1.44 | 1.70 |
| Quick Ratio | 0.94 | 1.42 |
| D/E (Debt/Equity) | 2.03 | 0.00 |
| Debt-to-Assets | 43.95% | 0.00% |
| Interest Coverage | 10.88 | 8.55 |
| Asset Turnover | 0.69 | 0.64 |
| Fixed Asset Turnover | 4.46 | 6.31 |
| Payout ratio | 31.0% | 95.4% |
| Dividend yield | 1.03% | 3.94% |
| Fiscal Year | 2025 | 2025 |
Efficiency & Valuation Duel: The Vital Signs
Financial ratios serve as a company’s DNA, uncovering hidden risks and operational strengths that shape its investment appeal.
Caterpillar Inc.
Caterpillar posts an impressive 41.6% ROE and a 13.1% net margin, signaling strong profitability. Its valuation appears stretched with a P/E of 30.1 and P/B at 12.5. The company balances risk with a 1.03% dividend yield, reflecting steady shareholder returns amid disciplined capital allocation and moderate debt levels.
PACCAR Inc
PACCAR shows moderate profitability with a 12.3% ROE and an 8.4% net margin. Its valuation is more reasonable, with a P/E of 24.3 and P/B near 3.0. The firm benefits from a strong balance sheet, zero debt, and a 3.94% dividend yield, revealing a conservative approach to shareholder rewards and operational efficiency.
Premium Valuation vs. Operational Safety
Caterpillar commands a premium valuation driven by superior profitability but carries higher leverage risks. PACCAR offers a safer balance with moderate returns and a stronger liquidity profile. Investors seeking growth at a cost may prefer Caterpillar; those prioritizing financial stability may lean toward PACCAR.
Which one offers the Superior Shareholder Reward?
I see Caterpillar (CAT) pays a modest 1.03% dividend yield with a sustainable 31% payout, supported by strong free cash flow coverage (87.5%). CAT complements dividends with steady buybacks, enhancing total returns. PACCAR (PCAR) yields almost 3.94% but pays out 95% of earnings, signaling limited dividend growth. PCAR’s buyback program is less aggressive. I view CAT’s balanced dividend and disciplined buybacks as more sustainable. For 2026, CAT offers a superior total shareholder reward, blending income with prudent capital allocation.
Comparative Score Analysis: The Strategic Profile
The radar chart reveals the fundamental DNA and trade-offs of Caterpillar Inc. and PACCAR Inc., highlighting their financial strengths and vulnerabilities:
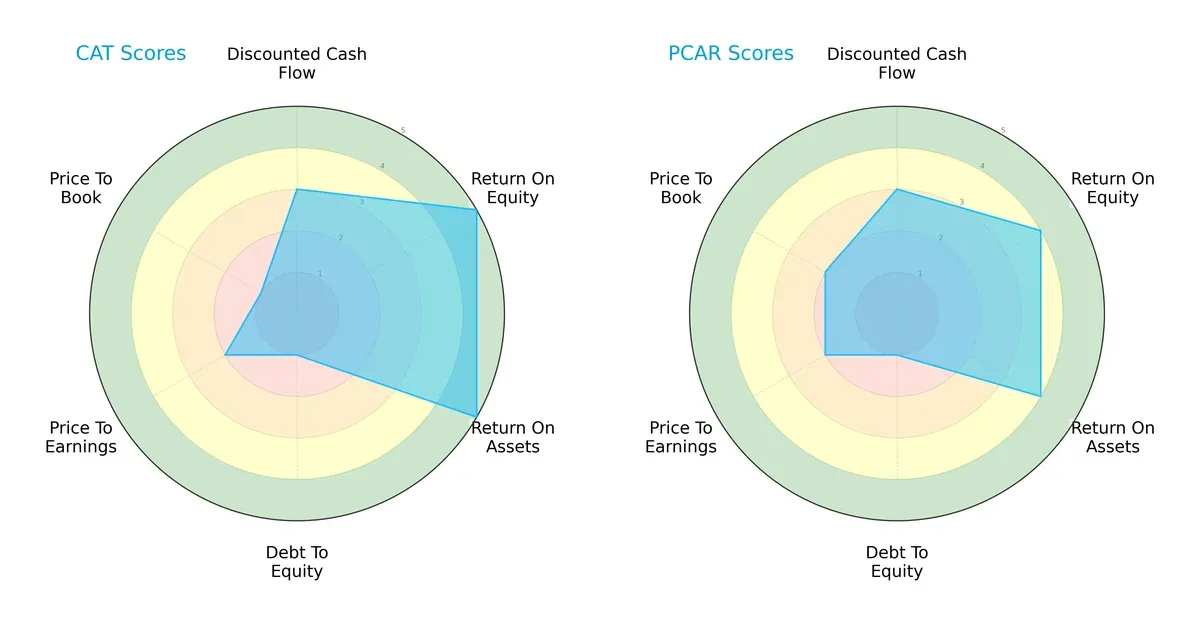
Caterpillar excels in profitability metrics, scoring higher on ROE (5 vs. 4) and ROA (5 vs. 4), reflecting superior operational efficiency. PACCAR shows a marginally better valuation balance with a higher Price-to-Book score (2 vs. 1), indicating slightly more attractive market pricing. Both firms share moderate DCF and P/E scores (3 and 2 respectively), but equally weak debt-to-equity scores (1), signaling elevated leverage risks. Caterpillar’s profile is skewed toward operational strength, while PACCAR maintains a more balanced but less robust stance.
Bankruptcy Risk: Solvency Showdown
Caterpillar’s Altman Z-Score of 4.64 places it firmly in the safe zone, while PACCAR’s 2.53 signals moderate distress risk in this cycle:
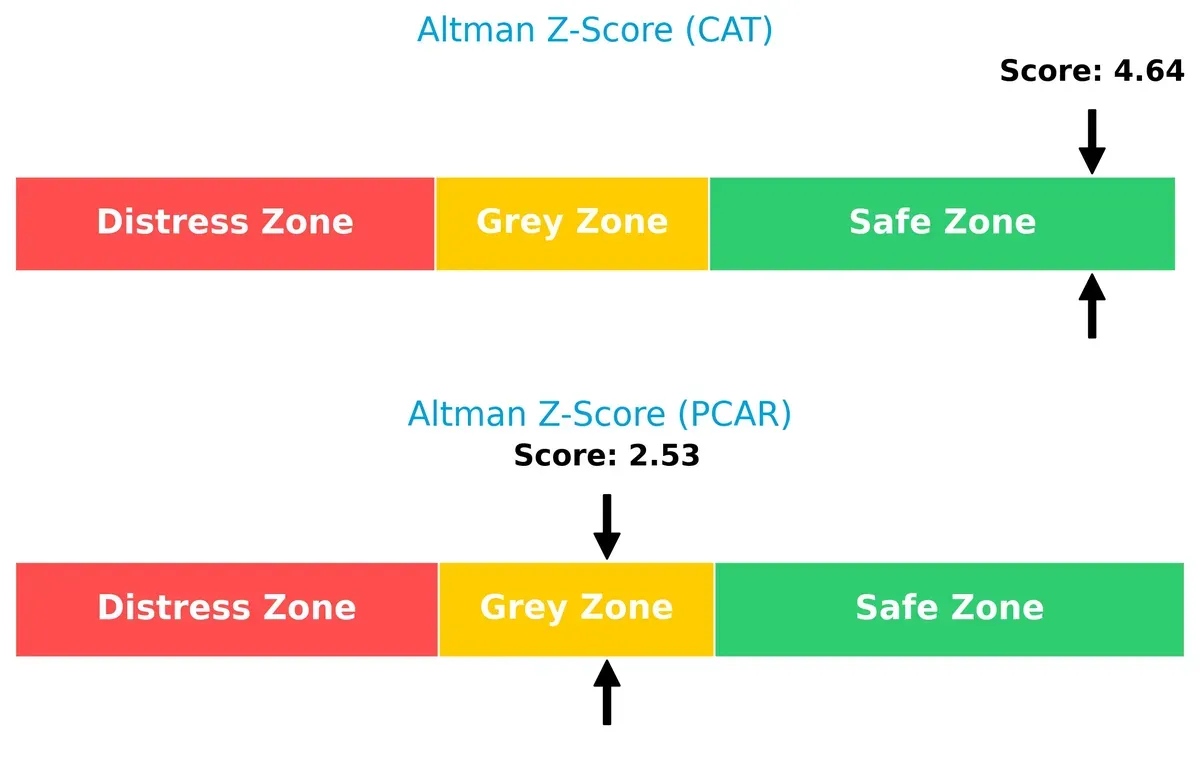
Caterpillar’s superior solvency suggests stronger resilience against economic downturns, reducing default probability. PACCAR’s grey zone score warrants caution, reflecting potential vulnerability to financial stress in adverse conditions.
Financial Health: Quality of Operations
Both companies post average Piotroski F-Scores, with Caterpillar slightly ahead at 6 versus PACCAR’s 5, indicating comparable but not peak financial health:
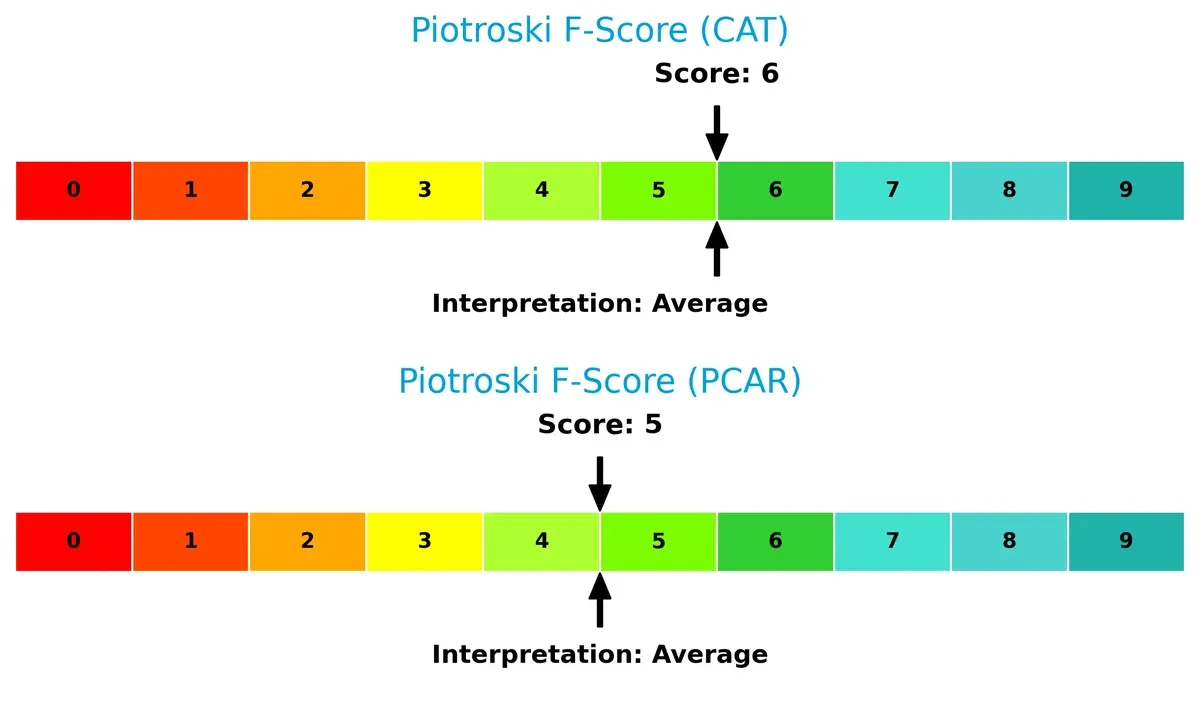
Neither firm shows critical red flags, but Caterpillar’s marginally higher score suggests better internal financial discipline and operational quality. Investors should watch for any deterioration given the moderate scores.
How are the two companies positioned?
This section dissects the operational DNA of CAT and PCAR by comparing their revenue distribution and internal dynamics—strengths and weaknesses. The goal is to confront their economic moats and identify which model offers the most resilient, sustainable competitive advantage today.
Revenue Segmentation: The Strategic Mix
This visual comparison dissects how Caterpillar Inc. and PACCAR Inc. diversify their income streams and where their primary sector bets lie:
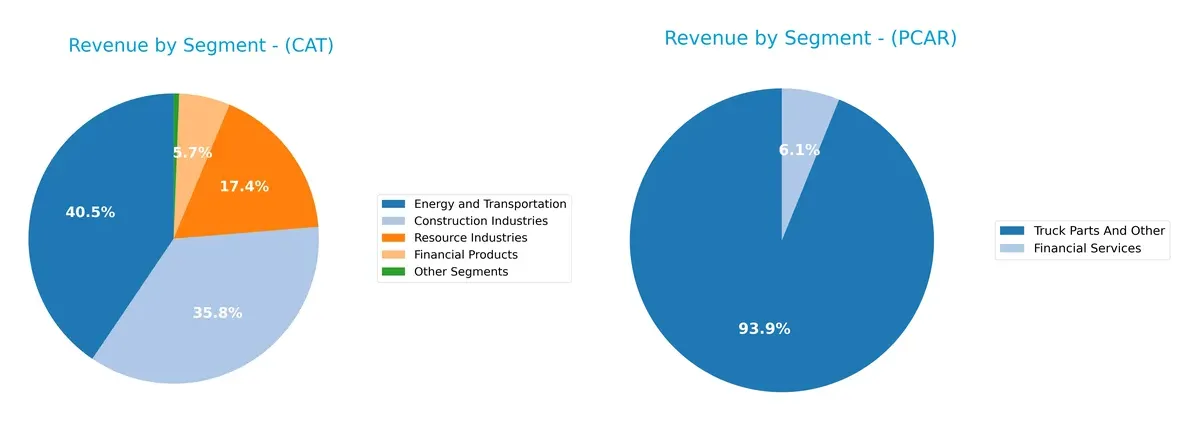
Caterpillar displays a balanced portfolio with Energy and Transportation at $28.85B, Construction Industries $25.45B, and Resource Industries $12.39B in 2024. PACCAR relies heavily on Truck Parts and Other at $32.08B, with Financial Services at a modest $2.10B. Caterpillar’s diversification reduces concentration risk and supports infrastructure dominance. PACCAR’s revenue pivots on a single segment, increasing vulnerability but also reflecting focused market leadership.
Strengths and Weaknesses Comparison
This table compares the Strengths and Weaknesses of Caterpillar Inc. and PACCAR Inc.:
Caterpillar Inc. Strengths
- Diverse revenue streams across construction, energy, resource, and financial products
- Strong profitability with net margin 13.13% and ROE 41.62%
- High fixed asset turnover at 4.46
- Global presence with balanced revenue in North America, EMEA, Asia Pacific, and Latin America
PACCAR Inc Strengths
- Strong balance sheet with zero debt and favorable current and quick ratios
- Higher dividend yield at 3.94%
- Favorable interest coverage at 9.73 and fixed asset turnover of 6.31
- Large market share in truck parts with consistent revenue growth
- Global presence focused on United States, Europe, and other countries
Caterpillar Inc. Weaknesses
- High debt-to-equity ratio at 2.03 signals leverage risk
- WACC of 10.18% exceeds ROIC of 11.42%, indicating tight capital returns
- Elevated P/E at 30.12 and P/B at 12.54 suggesting valuation concerns
- Neutral liquidity ratios (current 1.44, quick 0.94) limit short-term flexibility
PACCAR Inc Weaknesses
- Moderate profitability with net margin 8.35% and ROE 12.33%
- ROIC at 6.39% only slightly above WACC at 8.62%, showing limited capital efficiency
- Heavy reliance on truck parts segment reduces diversification
- Neutral asset turnover at 0.64 may constrain growth
Caterpillar’s strengths lie in its diversified global operations and strong profitability, though its leverage and valuation ratios warrant caution. PACCAR shows financial conservatism with no debt and strong liquidity, but its narrower product focus and moderate profitability limit its comparative capital efficiency. Both companies maintain slightly favorable financial profiles but face distinct strategic challenges.
The Moat Duel: Analyzing Competitive Defensibility
A structural moat is the sole barrier shielding long-term profits from relentless competitive erosion. Here’s how Caterpillar and PACCAR measure up:
Caterpillar Inc.: Diversified Industrial Scale Moat
Caterpillar’s moat stems from its vast product range and global footprint, driving stable margins and a slightly favorable ROIC trend. Expansion in autonomous mining deepens its competitive edge in 2026.
PACCAR Inc.: Niche Truck Manufacturing Moat
PACCAR’s moat relies on specialized truck brands and strong dealer networks. However, declining ROIC signals weakening profitability. Growth in financial services may offset some margin pressures in 2026.
Economies of Scale vs. Brand Specialization: The Moat Verdict
Caterpillar’s broader industrial scale creates a wider moat with improving profitability. PACCAR’s focused niche suffers declining returns. Caterpillar is better positioned to defend market share through innovation and diversification.
Which stock offers better returns?
Over the past year, Caterpillar and PACCAR stocks both show bullish momentum, with Caterpillar exhibiting sharper gains and higher volatility compared to PACCAR’s steadier advance.
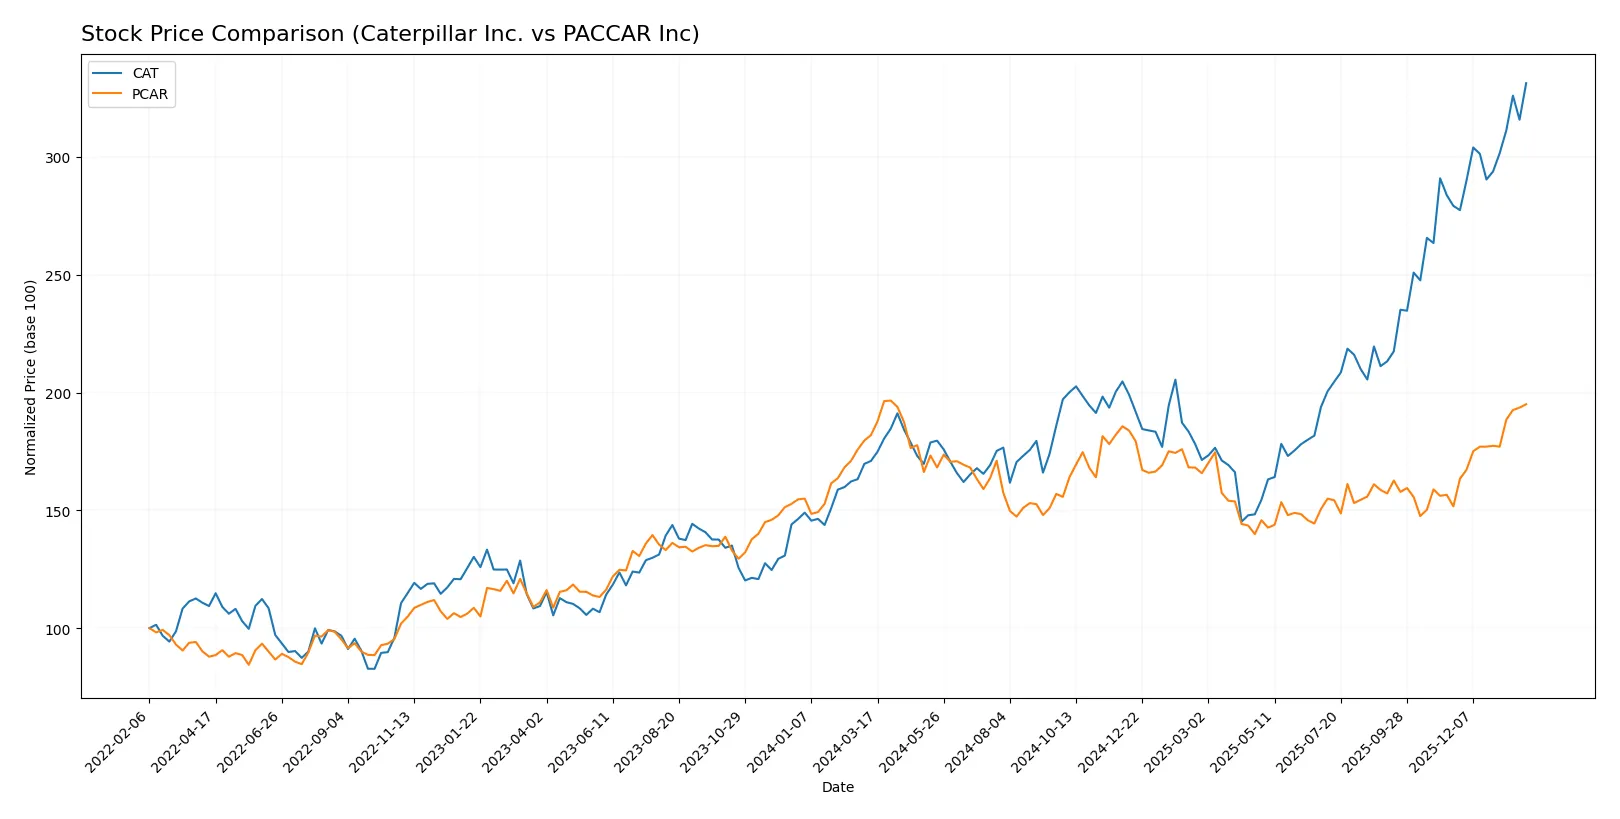
Trend Comparison
Caterpillar’s stock surged 93.8% over the past year, showing a strong bullish trend with accelerating gains and significant price volatility between $288 and $657.
PACCAR’s stock rose 7.2% in the same period, also bullish with accelerating momentum, but demonstrated lower volatility and a narrower price range from $88 to $124.
Caterpillar outperformed PACCAR by a wide margin in market returns, delivering substantially higher gains despite greater price volatility.
Target Prices
Analysts present a wide-ranging but constructive price outlook for Caterpillar Inc. and PACCAR Inc.
| Company | Target Low | Target High | Consensus |
|---|---|---|---|
| Caterpillar Inc. | 395 | 805 | 666.92 |
| PACCAR Inc | 86 | 138 | 106 |
The consensus target for Caterpillar at 667 exceeds its current 657 stock price, indicating moderate upside potential. PACCAR’s consensus target of 106 trails its current 123 price, suggesting a cautious outlook from analysts.

Don’t Let Luck Decide Your Entry Point
Optimize your entry points with our advanced ProRealTime indicators. You’ll get efficient buy signals with precise price targets for maximum performance. Start outperforming now!
How do institutions grade them?
Caterpillar Inc. Grades
The following table summarizes recent grades assigned to Caterpillar Inc. by major financial institutions.
| Grading Company | Action | New Grade | Date |
|---|---|---|---|
| JP Morgan | maintain | Overweight | 2024-10-14 |
| Morgan Stanley | downgrade | Underweight | 2024-10-14 |
| Truist Securities | maintain | Buy | 2024-10-09 |
| Citigroup | maintain | Buy | 2024-10-09 |
| B of A Securities | maintain | Buy | 2024-09-30 |
| Evercore ISI Group | maintain | In Line | 2024-08-19 |
| B of A Securities | maintain | Buy | 2024-08-07 |
| Truist Securities | maintain | Buy | 2024-08-07 |
| UBS | maintain | Sell | 2024-08-07 |
| Barclays | maintain | Equal Weight | 2024-08-07 |
PACCAR Inc Grades
The following table shows recent grades for PACCAR Inc. from recognized financial analysts.
| Grading Company | Action | New Grade | Date |
|---|---|---|---|
| Citigroup | maintain | Neutral | 2026-01-29 |
| Truist Securities | maintain | Hold | 2026-01-28 |
| Wells Fargo | maintain | Equal Weight | 2026-01-23 |
| JP Morgan | maintain | Overweight | 2026-01-14 |
| Citigroup | maintain | Neutral | 2026-01-13 |
| Morgan Stanley | maintain | Equal Weight | 2026-01-13 |
| JP Morgan | upgrade | Overweight | 2025-12-19 |
| Citigroup | maintain | Neutral | 2025-12-11 |
| Wolfe Research | upgrade | Peer Perform | 2025-10-22 |
| JP Morgan | maintain | Neutral | 2025-10-22 |
Which company has the best grades?
Caterpillar Inc. generally receives stronger buy ratings, while PACCAR Inc. mostly holds neutral or equal weight grades. Caterpillar’s mix of buy and overweight grades signals greater institutional confidence, potentially appealing to investors seeking higher conviction.
Risks specific to each company
The following categories identify the critical pressure points and systemic threats facing both firms in the 2026 market environment:
1. Market & Competition
Caterpillar Inc.
- Dominates global construction and mining equipment with diversified segments; faces intense global competition and cyclical demand risks.
PACCAR Inc
- Focuses on commercial trucks with strong dealer networks; exposed to volatile freight markets and competition from electric and autonomous trucks.
2. Capital Structure & Debt
Caterpillar Inc.
- High debt-to-equity ratio (2.03) signals leverage risk despite strong interest coverage (12.23x).
PACCAR Inc
- Zero debt enhances financial stability and lowers bankruptcy risk; interest coverage solid at 9.73x.
3. Stock Volatility
Caterpillar Inc.
- Beta of 1.568 indicates higher volatility than market, increasing investor risk.
PACCAR Inc
- Beta of 1.024 suggests near-market volatility, offering more stability to investors.
4. Regulatory & Legal
Caterpillar Inc.
- Faces regulatory scrutiny in emissions and international trade policies, especially energy and mining sectors.
PACCAR Inc
- Subject to trucking industry regulations including emissions and safety; legal environment less complex than diversified CAT.
5. Supply Chain & Operations
Caterpillar Inc.
- Complex global supply chain vulnerable to raw material cost swings and geopolitical disruptions.
PACCAR Inc
- Supply chain concentrated on truck manufacturing; risks from semiconductor shortages and logistics delays.
6. ESG & Climate Transition
Caterpillar Inc.
- Transition pressures in fossil fuel engines; investing in autonomous and electric solutions but facing legacy carbon footprint challenges.
PACCAR Inc
- Accelerates electric truck development and sustainable logistics solutions; ESG initiatives better aligned with industry trends.
7. Geopolitical Exposure
Caterpillar Inc.
- Operates in politically sensitive mining and infrastructure markets; exposed to tariffs and sanctions.
PACCAR Inc
- Global footprint in truck markets but less exposed to high-risk regions; moderate geopolitical risks.
Which company shows a better risk-adjusted profile?
Caterpillar’s highest risk is heavy leverage combined with market cyclicality, raising financial and operational vulnerability. PACCAR’s primary concern lies in market exposure and supply chain fragility amid evolving truck technologies. PACCAR’s zero debt and moderate volatility yield a better risk-adjusted profile. Notably, Caterpillar’s debt-to-equity ratio above 2.0 contrasts sharply with PACCAR’s debt-free position, justifying caution on leverage risk.
Final Verdict: Which stock to choose?
Caterpillar Inc. (CAT) demonstrates a superpower in operational efficiency and robust profitability, consistently delivering high returns on equity and invested capital. Its growing ROIC hints at improving competitive positioning. A point of vigilance remains its elevated leverage, which could amplify risks in a downturn. CAT suits investors with an appetite for aggressive growth.
PACCAR Inc. (PCAR) benefits from a solid strategic moat anchored in its asset-light, capital-efficient model and strong balance sheet, marked by zero net debt. Its safety profile clearly outshines CAT’s higher leverage, offering more stability. PCAR aligns well with investors seeking Growth at a Reasonable Price (GARP) exposure with dividend income.
If you prioritize high operational efficiency and expanding profitability, Caterpillar stands out due to its accelerating ROIC and market momentum. However, if you seek financial stability and lower risk, PACCAR offers better balance sheet strength and a safer dividend yield. Each presents a distinct analytical scenario based on risk tolerance and growth preference.
Disclaimer: Investment carries a risk of loss of initial capital. The past performance is not a reliable indicator of future results. Be sure to understand risks before making an investment decision.
Go Further
I encourage you to read the complete analyses of Caterpillar Inc. and PACCAR Inc to enhance your investment decisions: