Home > Comparison > Industrials > CAT vs DE
The strategic rivalry between Caterpillar Inc. and Deere & Company shapes the industrial agricultural machinery sector’s evolution. Caterpillar operates as a diversified heavy equipment and energy solutions powerhouse, while Deere focuses on precision agriculture and turf equipment. This head-to-head contrasts a broad-based industrial giant with a specialized growth leader. This analysis aims to identify which company offers the superior risk-adjusted return for a diversified portfolio in today’s capital-intensive machinery landscape.
Table of contents
Companies Overview
Caterpillar Inc. and Deere & Company define industrial strength in agricultural and construction machinery markets.
Caterpillar Inc.: Global Construction and Mining Titan
Caterpillar Inc. dominates the construction and mining equipment industry with diverse heavy machinery and engines. Its core revenue comes from selling excavators, loaders, and mining trucks globally. In 2026, Caterpillar emphasizes expanding autonomous vehicle solutions and mining performance services to enhance operational efficiency and safety.
Deere & Company: Precision Agriculture and Equipment Leader
Deere & Company focuses on agriculture and turf equipment, serving crop growers and livestock producers worldwide. It generates revenue through tractors, harvesters, and precision application equipment. Deere’s 2026 strategy centers on integrating precision agriculture technologies to boost productivity and sustainability for farmers.
Strategic Collision: Similarities & Divergences
Both companies target heavy machinery but differ philosophically: Caterpillar pursues a broad industrial footprint including energy and transportation, while Deere specializes in precision agriculture. Their primary battleground is equipment innovation and customer ecosystem control. Caterpillar offers diversified industrial solutions; Deere invests deeply in digital agriculture, defining distinct investment profiles.
Income Statement Comparison
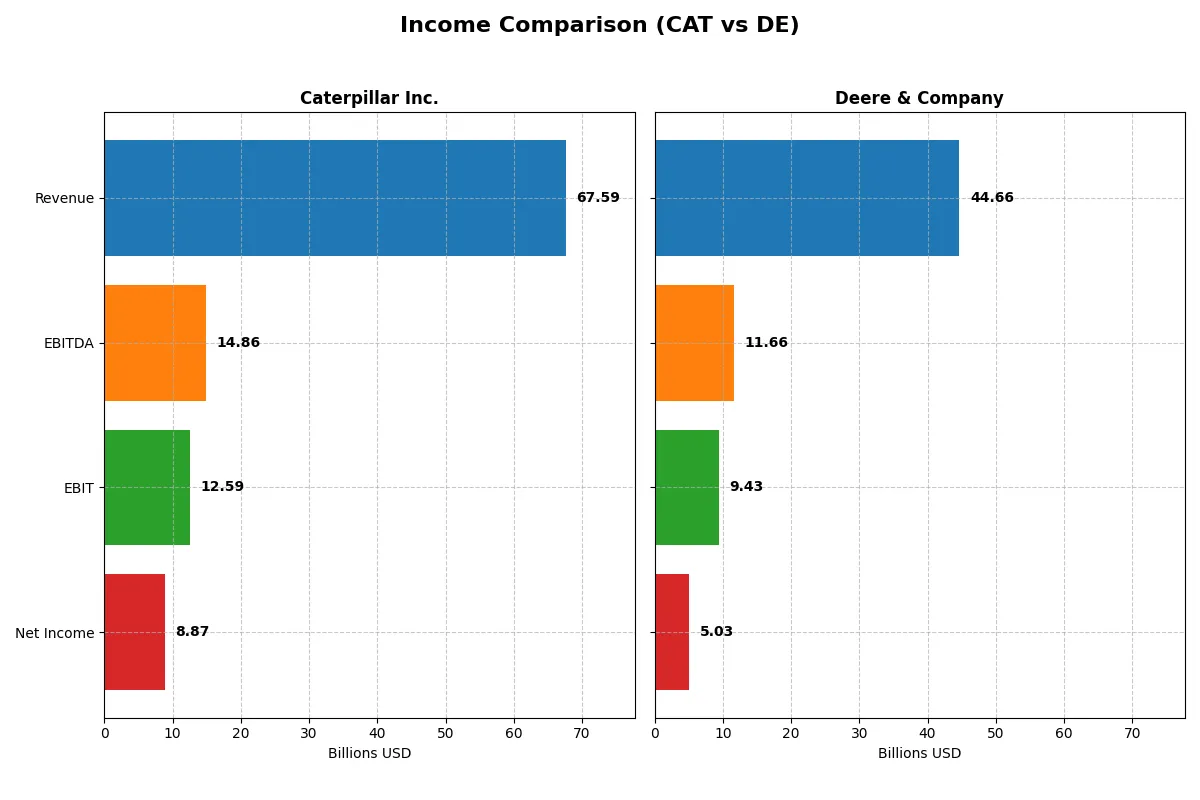
This data dissects the core profitability and scalability of both corporate engines to reveal who dominates the bottom line for fiscal year 2025:
| Metric | Caterpillar Inc. (CAT) | Deere & Company (DE) |
|---|---|---|
| Revenue | 67.6B | 44.7B |
| Cost of Revenue | 45.7B | 28.4B |
| Operating Expenses | 10.6B | 7.9B |
| Gross Profit | 21.9B | 16.3B |
| EBITDA | 14.9B | 11.7B |
| EBIT | 12.6B | 9.4B |
| Interest Expense | 1.0B | 3.2B |
| Net Income | 8.9B | 5.0B |
| EPS | 18.9 | 18.6 |
| Fiscal Year | 2025 | 2025 |
Income Statement Analysis: The Bottom-Line Duel
This income statement comparison exposes each company’s operational efficiency and profitability over recent years.
Caterpillar Inc. Analysis
Caterpillar’s revenue grew steadily to 67.6B in 2025, with net income rising to 8.9B despite a slight dip from 2024. Gross margin stayed solid at 32.3%, while net margin remained favorable at 13.1%. However, 2025 saw a decline in gross profit and EBIT, signaling short-term margin pressure despite long-term growth momentum.
Deere & Company Analysis
Deere’s revenue contracted to 44.7B in 2025, down from 50.5B in 2024, dragging net income down to 5.0B. Despite a stronger gross margin of 36.5%, net margin declined to 11.3%, reflecting heavier interest burdens and falling operational efficiency. The one-year trend shows significant margin erosion and negative earnings growth, challenging Deere’s recent profitability.
Margin Stability vs. Shrinking Scale
Caterpillar maintains a more stable margin profile and positive long-term net income growth compared to Deere’s shrinking revenue and deteriorating margins. Caterpillar’s disciplined cost control and margin resilience position it as the fundamentally stronger earnings engine. For investors, Caterpillar offers a more attractive profile grounded in sustained profitability and operational strength.
Financial Ratios Comparison
These vital ratios act as a diagnostic tool to expose underlying fiscal health, valuation premiums, and capital efficiency for Caterpillar Inc. and Deere & Company:
| Ratios | Caterpillar Inc. (CAT) | Deere & Company (DE) |
|---|---|---|
| ROE | 41.62% | 19.37% |
| ROIC | 11.42% | 7.13% |
| P/E | 30.12 | 24.89 |
| P/B | 12.54 | 4.82 |
| Current Ratio | 1.44 | 2.31 |
| Quick Ratio | 0.94 | 2.08 |
| D/E (Debt-to-Equity) | 2.03 | 2.46 |
| Debt-to-Assets | 43.95% | 60.32% |
| Interest Coverage | 10.88 | 2.65 |
| Asset Turnover | 0.69 | 0.42 |
| Fixed Asset Turnover | 4.46 | 2.77 |
| Payout Ratio | 30.98% | 34.22% |
| Dividend Yield | 1.03% | 1.37% |
| Fiscal Year | 2025 | 2025 |
Efficiency & Valuation Duel: The Vital Signs
Financial ratios act as the company’s DNA, exposing hidden risks and operational excellence crucial for investor insight and decision-making.
Caterpillar Inc.
Caterpillar displays robust profitability with a 41.6% ROE and a 13.1% net margin, signaling strong operational efficiency. Its valuation looks stretched, with a P/E of 30.1 and P/B of 12.5, above typical sector benchmarks. The company returns modest dividends at 1.03%, balancing shareholder rewards with reinvestment in R&D for growth.
Deere & Company
Deere shows solid profitability with a 19.4% ROE and an 11.3% net margin, reflecting stable but less aggressive returns than Caterpillar. Its valuation is more reasonable, with a P/E near 24.9 and moderate P/B at 4.8, though debt levels appear elevated. Deere offers a slightly higher dividend yield of 1.37%, supporting steady shareholder income.
Premium Valuation vs. Operational Safety
Caterpillar commands a premium valuation justified by superior profitability and efficient asset use but carries higher risk from leverage and valuation multiples. Deere offers a safer profile with lower valuation and steadier dividends but faces pressure from weaker returns and higher debt. Investors seeking growth may favor Caterpillar’s aggressive stance; conservative profiles might lean toward Deere’s stability.
Which one offers the Superior Shareholder Reward?
I compare Caterpillar Inc. (CAT) and Deere & Company (DE) on dividends, payout ratios, and buybacks to assess total shareholder return in 2026. CAT yields 1.03% with a 31% payout ratio, funded by strong free cash flow (22B FCF per share). DE yields 1.37% with a 34% payout ratio but covers dividends less comfortably, with a 43% free cash flow operating cash flow ratio. Both run significant buybacks, but CAT’s buyback intensity outpaces DE’s, enhancing capital return. CAT’s disciplined payout and robust buybacks indicate a more sustainable distribution model. I conclude CAT offers the superior total return profile for long-term investors in 2026.
Comparative Score Analysis: The Strategic Profile
The radar chart reveals the fundamental DNA and trade-offs of Caterpillar Inc. and Deere & Company, spotlighting their distinct financial strengths and weaknesses:
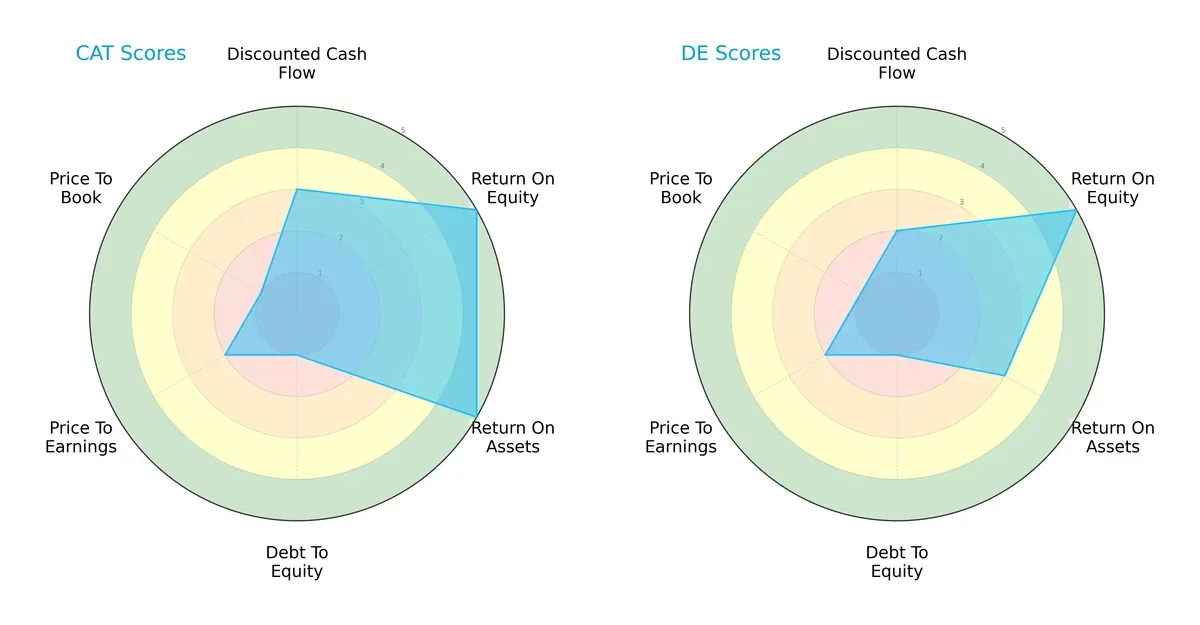
Caterpillar displays a stronger operational efficiency with top scores in ROE and ROA (5 each), indicating superior profit generation and asset utilization. Deere matches Caterpillar in ROE but lags in ROA, suggesting less effective asset use. Both firms share low debt-to-equity scores (1), signaling elevated financial risk. Valuation metrics show challenges, with both scoring poorly on price-to-book (1) and price-to-earnings (2). Caterpillar’s more balanced DCF and overall scores (3 vs. 2) hint at a slightly more stable financial foundation, while Deere relies more heavily on equity returns.
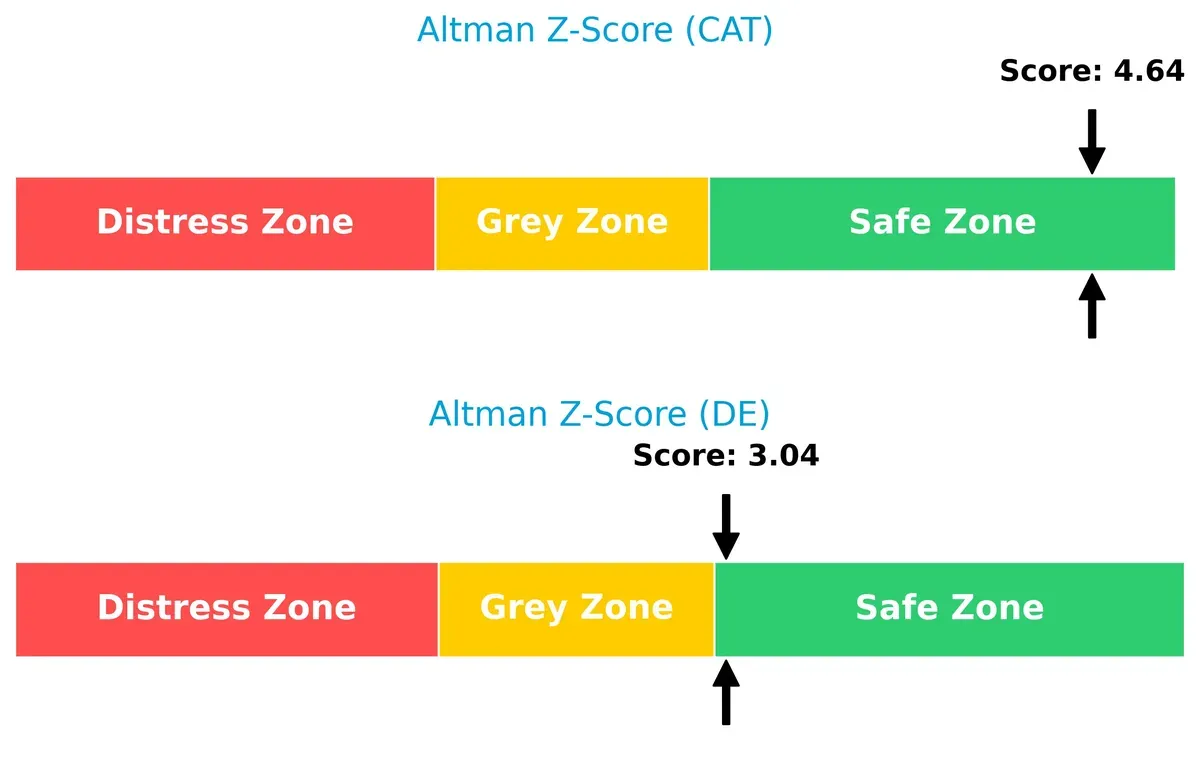
Bankruptcy Risk: Solvency Showdown
Caterpillar’s Altman Z-Score of 4.64 outpaces Deere’s 3.04, placing both safely above distress thresholds but highlighting Caterpillar’s stronger solvency buffer in this cycle:
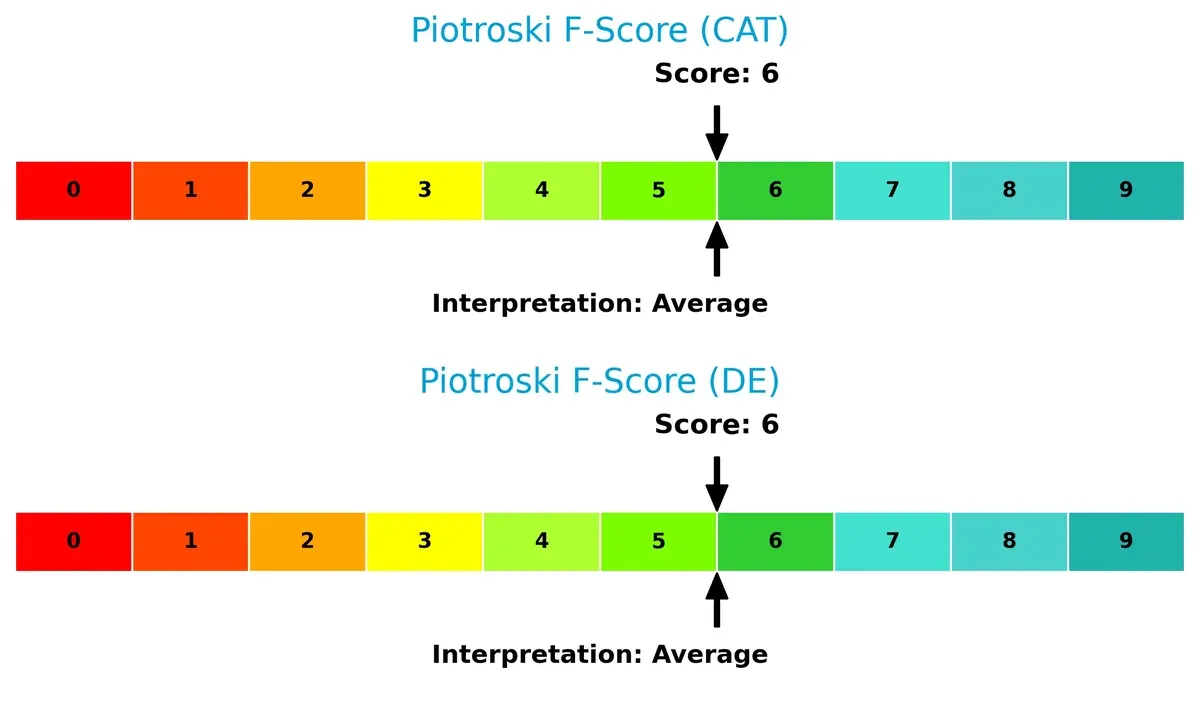
Financial Health: Quality of Operations
Both companies score a 6 on the Piotroski F-Score, reflecting average financial health with no glaring internal red flags. This parity suggests neither firm currently signals operational distress compared to peers:
How are the two companies positioned?
This section dissects the operational DNA of CAT and DE by comparing their revenue distribution and internal dynamics. The goal is to confront their economic moats to reveal which model offers the most resilient, sustainable advantage today.
Revenue Segmentation: The Strategic Mix
The following visual comparison dissects how Caterpillar Inc. and Deere & Company diversify their income streams and reveals where their primary sector bets lie:
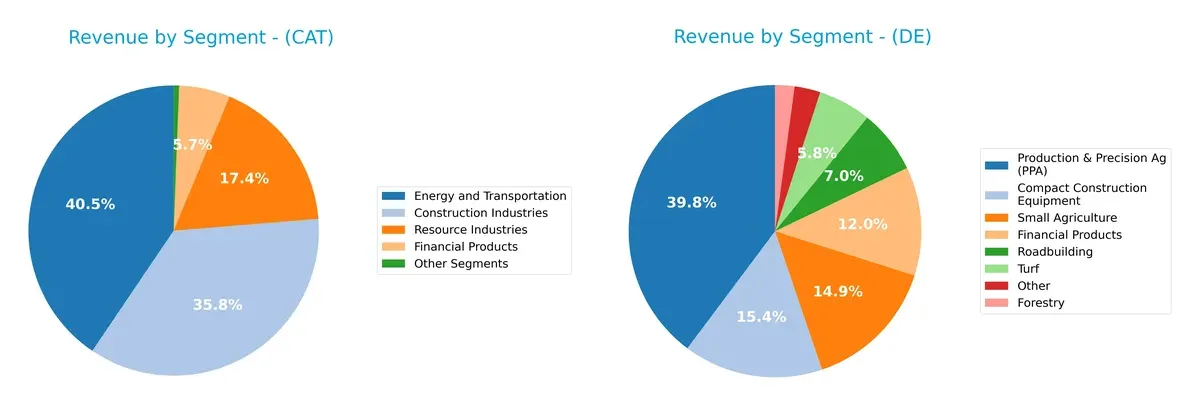
Caterpillar anchors revenue in Energy and Transportation ($28.9B) and Construction Industries ($25.5B), showing a balanced sector mix. Deere pivots heavily on Production & Precision Ag ($20.6B), with notable contributions from Small Agriculture ($7.7B) and Compact Construction ($8.0B). Caterpillar’s diversification reduces concentration risk, while Deere’s ag-centric focus leverages ecosystem lock-in but faces exposure to agricultural cycles. Both firms capitalize on infrastructure dominance in distinct end markets.
Strengths and Weaknesses Comparison
This table compares the strengths and weaknesses of Caterpillar Inc. and Deere & Company:
Caterpillar Inc. Strengths
- Strong profitability with 13.13% net margin and 41.62% ROE
- Favorable ROIC of 11.42% above WACC
- Diverse revenue from construction, energy, resource industries, and financial products
- Significant global presence across North America, EMEA, Asia Pacific, and Latin America
Deere & Company Strengths
- Solid profitability with 11.25% net margin and 19.37% ROE
- Favorable WACC at 7.12% supports capital efficiency
- High liquidity ratios (current 2.31, quick 2.08) indicate strong short-term financial health
- Wide product range in agriculture, construction, forestry, and financial services
- Robust revenue in US, Western Europe, Latin America, and Asia regions
Caterpillar Inc. Weaknesses
- High debt-to-equity ratio of 2.03 and unfavorable WACC at 10.18% signal capital cost pressure
- Valuation multiples (PE 30.12, PB 12.54) appear stretched
- Moderate liquidity with current ratio 1.44 and quick ratio 0.94
- Debt-to-assets ratio near 44% poses leverage risk
- Asset turnover (0.69) is neutral, limiting asset efficiency
Deere & Company Weaknesses
- Elevated debt-to-equity ratio at 2.46 and debt-to-assets of 60.32% increase financial risk
- Lower ROIC (7.13%) below WACC impacts returns
- Less efficient asset turnover at 0.42 reduces capital productivity
- Interest coverage ratio of 2.97 is neutral, indicating tighter earnings buffer
Overall, both companies show slightly favorable financial profiles with distinct strengths. Caterpillar excels in profitability and global diversification but carries higher valuation and leverage risks. Deere offers strong liquidity and capital efficiency but faces challenges in leverage and asset utilization. These factors shape their strategic positioning and risk management priorities.
The Moat Duel: Analyzing Competitive Defensibility
A structural moat is the only thing protecting long-term profits from the erosion of competition. Let’s dissect the moats of Caterpillar and Deere:
Caterpillar Inc.: Operational Scale and Brand Strength Moat
Caterpillar’s moat centers on its global scale and brand recognition, yielding stable margins near 18.6% EBIT. Its expanding ROIC (+36% trend) hints at improving capital efficiency. New autonomous and digital solutions in mining deepen this moat in 2026.
Deere & Company: Precision Agriculture and Innovation Moat
Deere’s competitive advantage lies in precision agriculture tech and product innovation, reflected in its higher gross margin (36.5%) and EBIT margin (21.1%). However, a declining ROIC trend (-12.5%) signals weakening efficiency. Market disruptions could either erode or boost its positioning.
Scale and Innovation: Caterpillar’s Improving Efficiency vs. Deere’s Innovation Challenges
Caterpillar shows a wider moat with growing ROIC and stable profitability despite moderate revenue growth. Deere’s innovation moat is strong but undermined by declining capital returns and profitability pressures. Caterpillar appears better positioned to defend market share in 2026.
Which stock offers better returns?
Over the past 12 months, Caterpillar and Deere & Company both recorded strong gains, with Caterpillar showing a sharply accelerating uptrend and Deere maintaining steady bullish momentum.
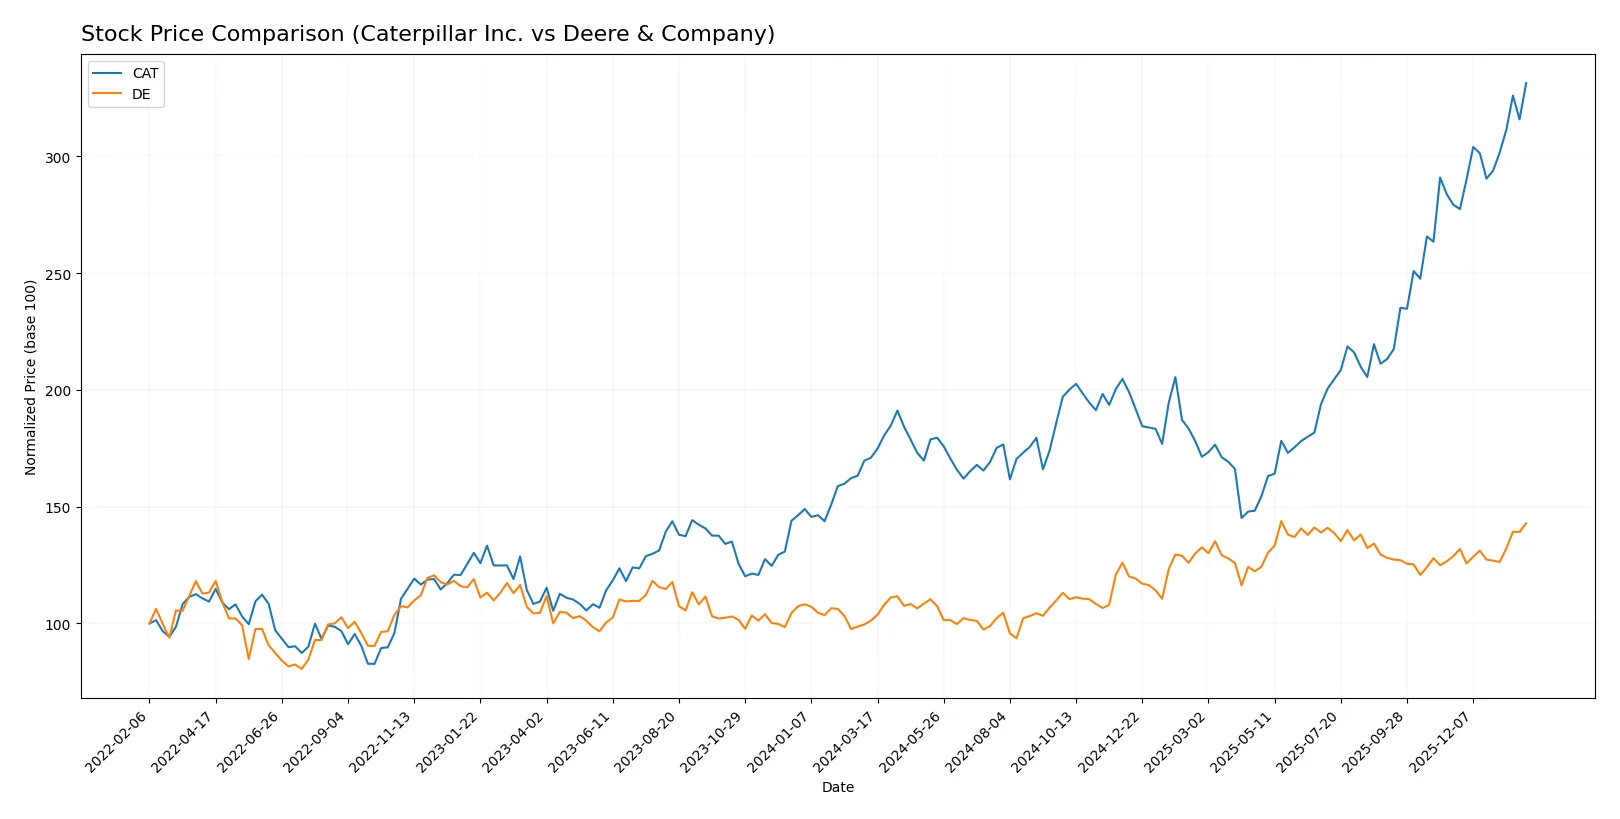
Trend Comparison
Caterpillar’s stock surged 93.8% over the last year, marking a bullish trend with accelerating price gains and high volatility, peaking at 657.36 from a low of 288.08.
Deere’s stock rose 41.14% in the same period, also bullish with acceleration, but showed lower volatility and a smaller price range between 346.03 and 531.48.
Caterpillar outperformed Deere with a significantly higher total return and stronger recent price acceleration, delivering the best market performance in this comparison.
Target Prices
Analysts project strong upside potential for Caterpillar Inc. and Deere & Company based on consensus targets.
| Company | Target Low | Target High | Consensus |
|---|---|---|---|
| Caterpillar Inc. | 395 | 805 | 666.92 |
| Deere & Company | 458 | 612 | 529.5 |
Caterpillar’s consensus target of $667 sits slightly above its current price of $657, indicating modest appreciation potential. Deere’s consensus target near $530 aligns closely with its current $528 price, suggesting a stable outlook from analysts.

Don’t Let Luck Decide Your Entry Point
Optimize your entry points with our advanced ProRealTime indicators. You’ll get efficient buy signals with precise price targets for maximum performance. Start outperforming now!
How do institutions grade them?
Caterpillar Inc. Grades
Here are recent grades and actions from leading grading companies for Caterpillar Inc.:
| Grading Company | Action | New Grade | Date |
|---|---|---|---|
| JP Morgan | Maintain | Overweight | 2024-10-14 |
| Morgan Stanley | Downgrade | Underweight | 2024-10-14 |
| Truist Securities | Maintain | Buy | 2024-10-09 |
| Citigroup | Maintain | Buy | 2024-10-09 |
| B of A Securities | Maintain | Buy | 2024-09-30 |
| Evercore ISI Group | Maintain | In Line | 2024-08-19 |
| B of A Securities | Maintain | Buy | 2024-08-07 |
| Truist Securities | Maintain | Buy | 2024-08-07 |
| UBS | Maintain | Sell | 2024-08-07 |
| Barclays | Maintain | Equal Weight | 2024-08-07 |
Deere & Company Grades
Below are Deere & Company’s recent grades and rating actions by reputable institutions:
| Grading Company | Action | New Grade | Date |
|---|---|---|---|
| Jefferies | Maintain | Hold | 2025-12-09 |
| DA Davidson | Maintain | Buy | 2025-12-01 |
| RBC Capital | Maintain | Outperform | 2025-11-28 |
| Evercore ISI Group | Maintain | In Line | 2025-11-28 |
| Oppenheimer | Maintain | Outperform | 2025-11-28 |
| Truist Securities | Maintain | Buy | 2025-11-28 |
| UBS | Upgrade | Buy | 2025-10-17 |
| JP Morgan | Maintain | Neutral | 2025-10-14 |
| Truist Securities | Maintain | Buy | 2025-10-08 |
| Oppenheimer | Maintain | Outperform | 2025-09-18 |
Which company has the best grades?
Deere & Company holds stronger and more consistent buy and outperform ratings from major firms, suggesting higher confidence among analysts. Caterpillar shows mixed opinions, with some downgrades and sell ratings that may signal caution for investors.
Risks specific to each company
The following categories identify the critical pressure points and systemic threats facing both firms in the 2026 market environment:
1. Market & Competition
Caterpillar Inc.
- Faces intense competition in construction and mining equipment, with a broad product range supporting market resilience.
Deere & Company
- Competes strongly in agricultural machinery with precision agriculture focus but narrower construction segment exposure.
2. Capital Structure & Debt
Caterpillar Inc.
- Moderate leverage with debt-to-equity ratio of 2.03 and interest coverage at 12.23, indicating manageable debt risk.
Deere & Company
- Higher leverage with debt-to-equity at 2.46 and weaker interest coverage of 2.97, raising concerns about debt-servicing capacity.
3. Stock Volatility
Caterpillar Inc.
- Beta of 1.57 suggests above-market volatility, increasing risk during economic downturns.
Deere & Company
- Beta of 1.01 implies near-market volatility, offering relative stability for investors.
4. Regulatory & Legal
Caterpillar Inc.
- Subject to environmental and safety regulations globally, with exposure to legal risks in multiple jurisdictions.
Deere & Company
- Faces regulatory scrutiny especially in environmental compliance due to agricultural chemical use and machinery emissions.
5. Supply Chain & Operations
Caterpillar Inc.
- Complex global supply chain with risks from raw material costs and geopolitical disruptions.
Deere & Company
- Supply chain concentrated in agricultural equipment, vulnerable to component shortages and logistic delays.
6. ESG & Climate Transition
Caterpillar Inc.
- Pressured to innovate cleaner engines and reduce emissions amid rising ESG standards.
Deere & Company
- Actively developing precision agriculture to improve sustainability but still challenged by fossil fuel dependence.
7. Geopolitical Exposure
Caterpillar Inc.
- Significant global footprint subjects it to tariffs, trade tensions, and currency fluctuations.
Deere & Company
- More regionally focused but exposed to trade policies affecting agricultural exports and machinery sales.
Which company shows a better risk-adjusted profile?
Caterpillar’s strongest risk lies in its stock volatility and global geopolitical exposure, while Deere faces elevated capital structure and debt servicing risks. Caterpillar’s higher interest coverage and Altman Z-score reflect superior financial stability. Deere’s moderate Altman Z-score and greater leverage increase caution. I conclude Caterpillar shows a better risk-adjusted profile, supported by its safer debt position and stronger liquidity despite higher market volatility.
Final Verdict: Which stock to choose?
Caterpillar’s superpower lies in its robust profitability and steadily improving operational efficiency. Its growing ROIC suggests increasing value creation, despite a debt level that warrants caution. Caterpillar fits well within an Aggressive Growth portfolio seeking companies with rising returns and strong market momentum.
Deere’s strategic moat centers on its solid brand and recurring revenue streams, supported by a safer liquidity profile. However, its declining ROIC and elevated leverage signal caution. Deere might suit a GARP portfolio focused on stability but mindful of slower growth and operational headwinds.
If you prioritize aggressive value creation and rising profitability, Caterpillar outshines Deere with superior returns and market traction. However, if you seek better liquidity and a more conservative risk profile, Deere offers better stability despite its slower growth trajectory. Both require vigilance around their leverage and earnings trends for prudent risk management.
Disclaimer: Investment carries a risk of loss of initial capital. The past performance is not a reliable indicator of future results. Be sure to understand risks before making an investment decision.
Go Further
I encourage you to read the complete analyses of Caterpillar Inc. and Deere & Company to enhance your investment decisions: