Home > Comparison > Industrials > CAT vs CMCO
The strategic rivalry between Caterpillar Inc. and Columbus McKinnon Corporation shapes the industrial machinery landscape. Caterpillar dominates as a capital-intensive industrial giant with diverse heavy equipment and energy segments. Columbus McKinnon operates as a specialized, high-margin motion solutions provider focused on material handling. This analysis pits broad industrial scale against niche expertise to identify which trajectory delivers superior risk-adjusted returns for diversified portfolios.
Table of contents
Companies Overview
Caterpillar Inc. and Columbus McKinnon Corporation are major players in the industrial machinery sector, each with distinct market roles.
Caterpillar Inc.: Global Construction and Mining Equipment Leader
Caterpillar dominates global construction and mining machinery markets. Its core revenue stems from heavy equipment sales including excavators, loaders, and mining trucks. In 2026, Caterpillar focuses on integrating autonomous vehicle technology and expanding its Energy & Transportation segment to enhance industrial efficiency. Its diverse product portfolio underpins a robust competitive advantage.
Columbus McKinnon Corporation: Intelligent Motion Solutions Specialist
Columbus McKinnon excels in designing and manufacturing motion control and material handling equipment globally. It generates revenue from hoists, cranes, rigging gear, and power delivery systems tailored to multiple industries. The company’s 2026 strategy emphasizes automation, safety systems, and expanding its footprint in industrial automation and supply chain solutions. Its niche in motion technology creates a focused market presence.
Strategic Collision: Similarities & Divergences
Both companies serve industrial sectors but differ sharply in scale and scope. Caterpillar pursues a broad product ecosystem targeting heavy construction and mining, while Columbus McKinnon specializes in precision motion control for material handling. Their competition centers on infrastructure and automation technologies. Caterpillar’s vast scale contrasts with Columbus McKinnon’s specialized focus, shaping distinct investment risk and reward profiles.
Income Statement Comparison
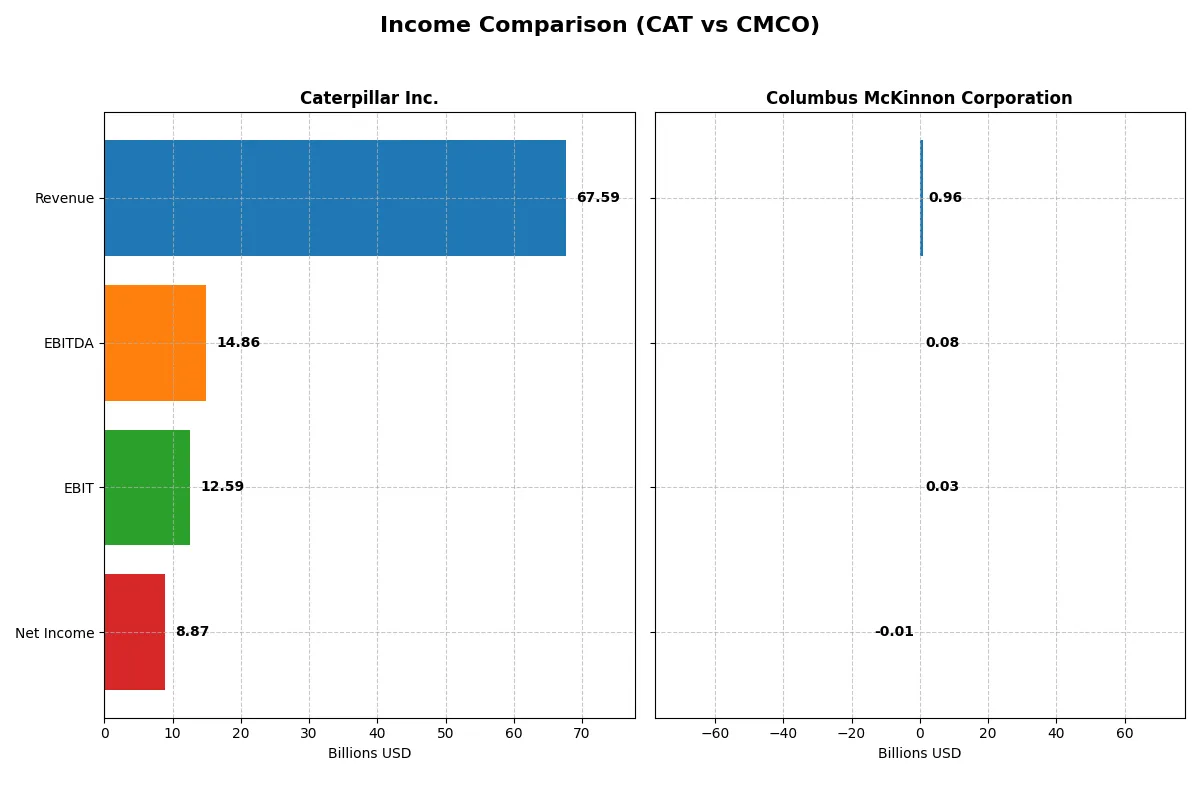
This data dissects the core profitability and scalability of both corporate engines to reveal who dominates the bottom line:
| Metric | Caterpillar Inc. (CAT) | Columbus McKinnon Corporation (CMCO) |
|---|---|---|
| Revenue | 67.6B | 963M |
| Cost of Revenue | 45.7B | 637M |
| Operating Expenses | 10.6B | 271M |
| Gross Profit | 21.9B | 326M |
| EBITDA | 14.9B | 75M |
| EBIT | 12.6B | 27M |
| Interest Expense | 1.03B | 32M |
| Net Income | 8.87B | -5.1M |
| EPS | 18.9 | -0.18 |
| Fiscal Year | 2025 | 2024 |
Income Statement Analysis: The Bottom-Line Duel
This income statement comparison exposes which company runs a more efficient and profitable corporate engine in recent years.
Caterpillar Inc. Analysis
Caterpillar’s revenue rose steadily from $51B in 2021 to $67.6B in 2025, with net income climbing from $6.5B to $8.9B. Its gross margin hovers around 32%, signaling robust cost control. Despite a 2025 dip in gross profit and net income margins, Caterpillar maintains healthy profitability and operational efficiency.
Columbus McKinnon Corporation Analysis
Columbus McKinnon’s revenue grew from $650M in 2020 to just under $1B in 2024 but reversed to $963M in 2025. Net income swung from positive $9.1M in 2020 to a $5.1M loss in 2025. Its gross margin of approximately 34% remains solid, but EBIT and net margins deteriorated, highlighting operational challenges and margin pressure.
Margin Strength vs. Profit Consistency
Caterpillar clearly outperforms Columbus McKinnon with stronger net margins and consistent profit growth over five years. While Columbus McKinnon shows revenue gains, its profitability falters sharply. Investors seeking steady earnings and operational resilience will find Caterpillar’s profile more compelling.
Financial Ratios Comparison
These vital ratios act as a diagnostic tool to expose the underlying fiscal health, valuation premiums, and capital efficiency of the companies compared below:
| Ratios | Caterpillar Inc. (CAT) | Columbus McKinnon Corporation (CMCO) |
|---|---|---|
| ROE | 41.6% | -0.6% |
| ROIC | 11.4% | 3.3% |
| P/E | 30.1 | -94.7 |
| P/B | 12.5 | 0.55 |
| Current Ratio | 1.44 | 1.81 |
| Quick Ratio | 0.94 | 1.04 |
| D/E | 2.03 | 0.61 |
| Debt-to-Assets | 44.0% | 31.1% |
| Interest Coverage | 10.9 | 1.68 |
| Asset Turnover | 0.69 | 0.55 |
| Fixed Asset Turnover | 4.46 | 9.07 |
| Payout ratio | 31.0% | -156.5% |
| Dividend yield | 1.03% | 1.65% |
| Fiscal Year | 2025 | 2024 |
Efficiency & Valuation Duel: The Vital Signs
Ratios act as a company’s DNA, revealing hidden risks and operational excellence that shape investor confidence and stock performance.
Caterpillar Inc.
Caterpillar posts robust profitability with a 41.6% ROE and a 13.1% net margin, signaling efficient core operations. However, its valuation appears stretched, with a P/E of 30.1 and a P/B of 12.5, above typical industry norms. The 1.03% dividend yield offers modest shareholder returns alongside reinvestment in R&D at 3.2% of revenue.
Columbus McKinnon Corporation
Columbus McKinnon struggles with negative ROE (-0.58%) and net margin (-0.53%), reflecting operational challenges. Yet, valuation metrics like a P/B of 0.55 and a negative P/E indicate undervaluation or market skepticism. The company maintains a higher dividend yield of 1.65%, despite weak profitability, signaling a focus on income distribution over growth.
Premium Valuation vs. Operational Safety
Caterpillar delivers superior profitability and operational efficiency but trades at a premium valuation. Columbus McKinnon offers a cheaper valuation with income appeal but faces profitability headwinds. Investors prioritizing stable returns and operational strength may prefer Caterpillar, while those seeking value and yield might lean toward Columbus McKinnon.
Which one offers the Superior Shareholder Reward?
I find Caterpillar (CAT) offers a superior shareholder reward compared to Columbus McKinnon (CMCO). CAT yields 1.03%-1.7% with a sustainable payout ratio near 25%-31%. Its robust free cash flow (FCF) coverage supports dividends and aggressive buybacks exceeding $5B annually. Conversely, CMCO’s yield hovers around 0.65%-1.65% but suffers from negative net margins and volatile earnings. CMCO’s payout ratio is erratic, risking sustainability. Its buyback activity is minimal, limiting total return. Historically in industrial sectors, consistent dividends paired with meaningful buybacks, like CAT’s, signal durable capital allocation and value creation. I conclude CAT delivers a more attractive total return profile for 2026 investors.
Comparative Score Analysis: The Strategic Profile
The radar chart reveals the fundamental DNA and trade-offs of Caterpillar Inc. and Columbus McKinnon Corporation:
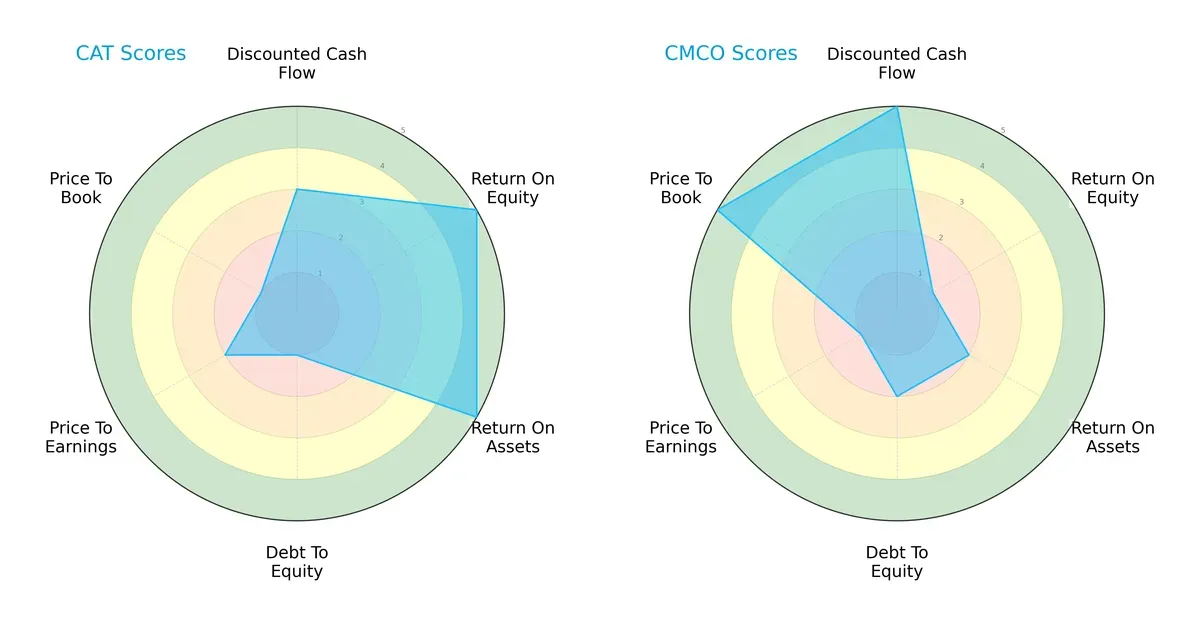
Caterpillar shows strong operational efficiency with top ROE and ROA scores (5 each), but it carries a heavy debt burden (Debt/Equity score 1). Columbus McKinnon excels in discounted cash flow valuation (DCF score 5) and boasts a favorable price-to-book ratio (5), yet it lags in profitability (ROE 1, ROA 2). Caterpillar has a more balanced profitability profile, while Columbus McKinnon leans on valuation advantages.
Bankruptcy Risk: Solvency Showdown
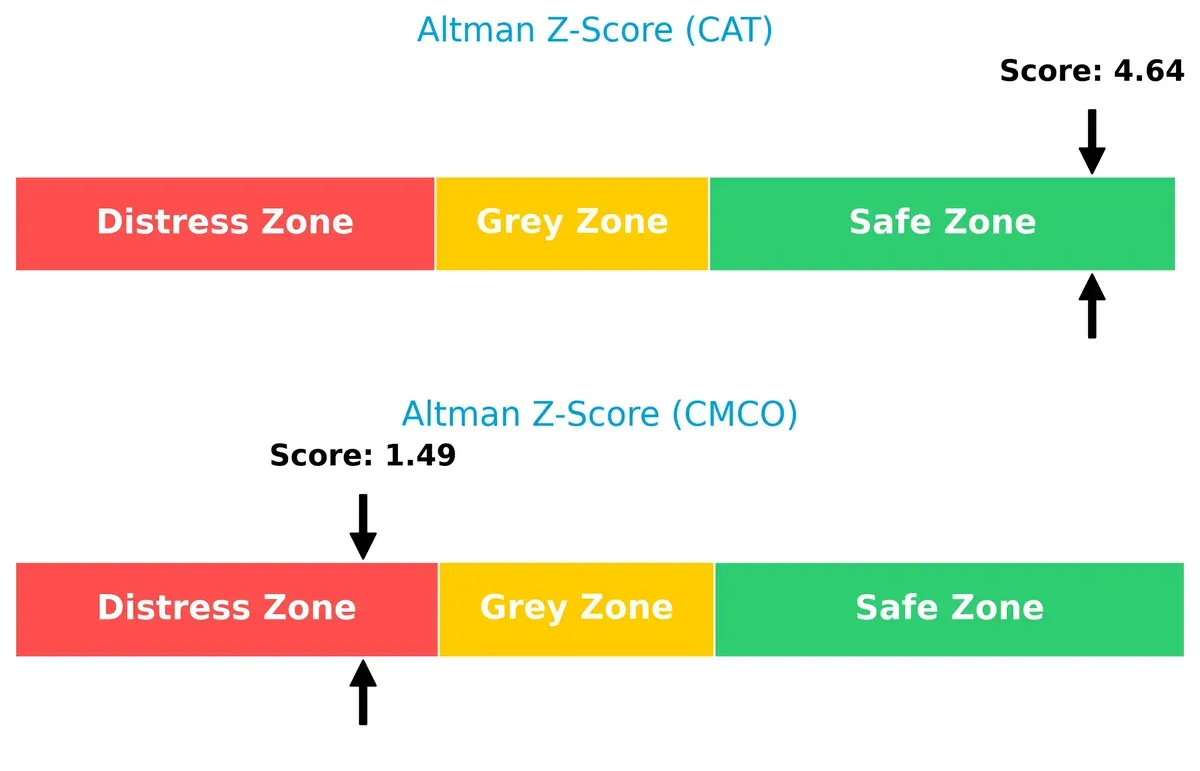
Caterpillar’s Altman Z-Score of 4.64 places it firmly in the safe zone, signaling strong long-term solvency. Columbus McKinnon, with a 1.49 score, falls in the distress zone, indicating elevated bankruptcy risk in the current cycle:
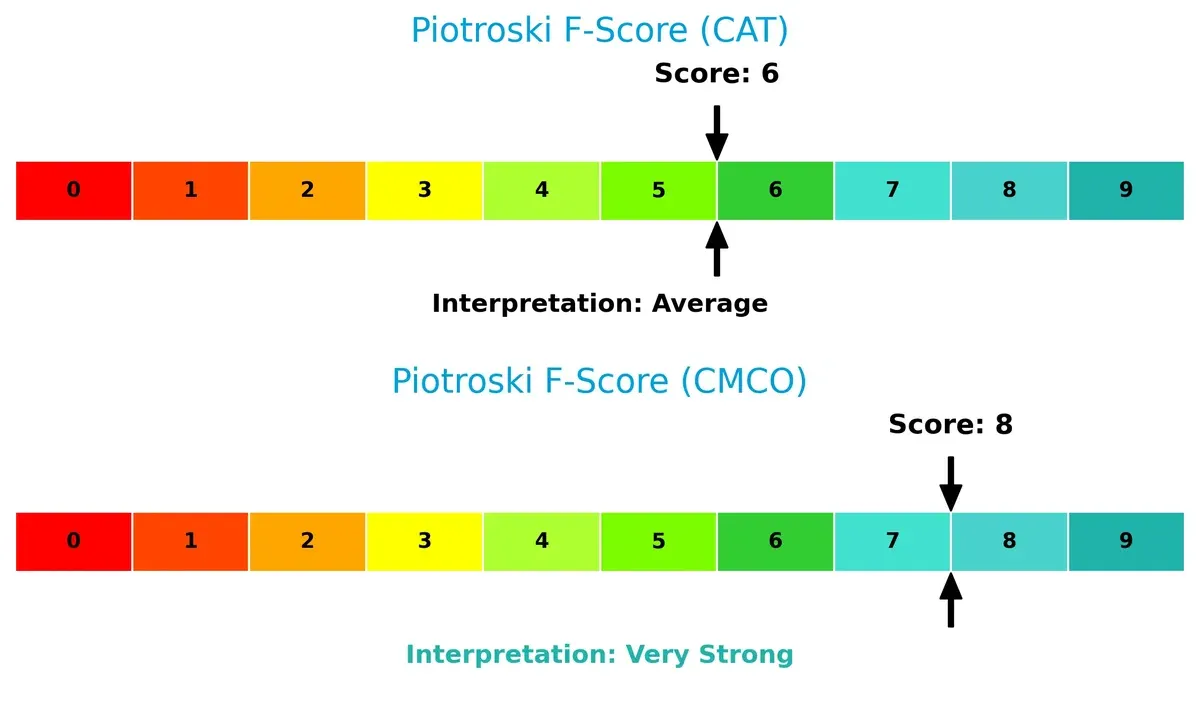
Financial Health: Quality of Operations
Columbus McKinnon’s Piotroski score of 8 signals very strong financial health, suggesting solid profitability and operational efficiency. Caterpillar’s score of 6 is average, raising mild concerns about internal financial metrics compared to its peer:
How are the two companies positioned?
This section dissects the operational DNA of Caterpillar and Columbus McKinnon by comparing their revenue distribution and internal strengths and weaknesses. The goal is to confront their economic moats to identify which model offers the most resilient competitive advantage today.
Revenue Segmentation: The Strategic Mix
This visual comparison dissects how Caterpillar Inc. and Columbus McKinnon Corporation diversify their income streams and reveals their primary sector bets:
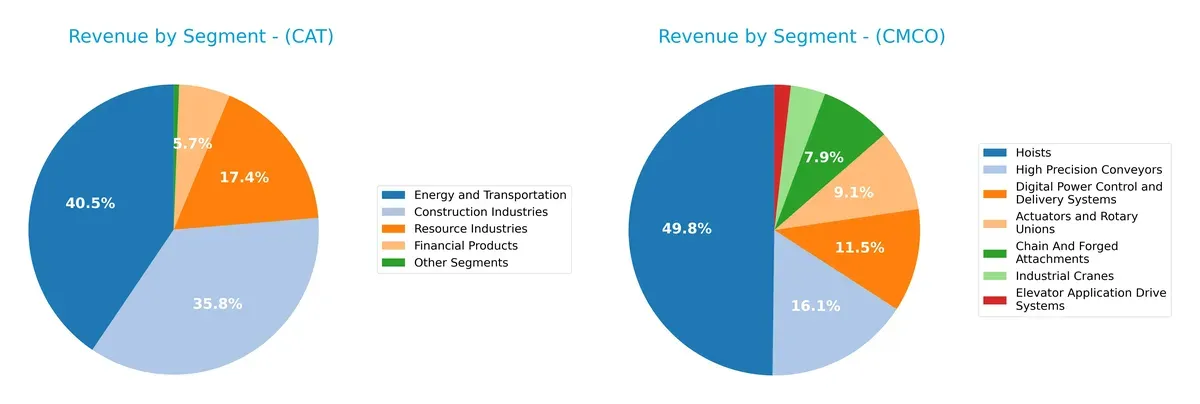
Caterpillar’s revenue spans large sectors: Energy and Transportation anchors at $28.9B, Construction Industries yields $25.5B, and Resource Industries adds $12.4B. This mix reflects a strong industrial ecosystem lock-in with balanced exposure. Columbus McKinnon, by contrast, pivots heavily on Hoists at $480M, with other segments below $160M, showing concentration risk but also niche dominance in material handling. Caterpillar’s scale dwarfs Columbus, highlighting infrastructure breadth versus specialized focus.
Strengths and Weaknesses Comparison
This table compares the strengths and weaknesses of Caterpillar Inc. and Columbus McKinnon Corporation:
Caterpillar Inc. Strengths
- Diverse revenue streams across construction, energy, resource industries, and financial products
- Strong net margin and ROE indicating high profitability
- Global presence with significant sales in North America, EMEA, Asia Pacific, and Latin America
- Favorable fixed asset turnover showing efficient use of assets
Columbus McKinnon Corporation Strengths
- Revenue diversified across multiple product lines including hoists, conveyors, and cranes
- Favorable WACC and valuation multiples indicate cost-effective capital and market undervaluation
- Strong current and quick ratios suggest good short-term liquidity
- Favorable fixed asset turnover reflects efficient asset management
Caterpillar Inc. Weaknesses
- High debt-to-equity ratio and elevated P/E and P/B ratios raise financial risk concerns
- WACC slightly above ROIC, indicating possible capital allocation inefficiencies
- Neutral liquidity ratios could be improved for better short-term resilience
Columbus McKinnon Corporation Weaknesses
- Negative net margin and ROE signal ongoing profitability challenges
- Weak interest coverage ratio raises concerns about debt servicing ability
- Lower asset turnover compared to Caterpillar limits operational efficiency
Caterpillar exhibits broad diversification and strong profitability but carries notable financial leverage risks. Columbus McKinnon shows good liquidity and capital cost advantages but struggles with profitability and interest coverage. Both companies face distinct strategic priorities reflected in their financial profiles.
The Moat Duel: Analyzing Competitive Defensibility
A structural moat is the only shield guarding long-term profits from relentless competition erosion. Let’s dissect the defensive strengths of Caterpillar and Columbus McKinnon:
Caterpillar Inc.: Industrial Scale and Brand Endurance Moat
Caterpillar leverages cost advantage and brand power, reflected in a slightly favorable moat with improving ROIC and stable margins. Its global footprint and autonomous equipment innovations could deepen this advantage in 2026.
Columbus McKinnon Corporation: Specialized Engineering and Niche Market Moat
Columbus McKinnon relies on intangible assets like proprietary motion solutions, but its declining ROIC signals weakening competitiveness. Unlike Caterpillar, its narrow market focus limits scale benefits, though automation tech offers growth potential.
Moat Battle: Scale Economies vs. Niche Innovation
Caterpillar’s wider moat stems from scale and diversified markets, while Columbus McKinnon faces a shrinking competitive edge. Caterpillar’s rising profitability better equips it to defend market share in 2026.
Which stock offers better returns?
Over the past year, Caterpillar’s stock soared nearly 94%, showing strong upward momentum. Columbus McKinnon’s shares fell sharply by 50%, despite recent signs of recovery and increased buyer dominance.
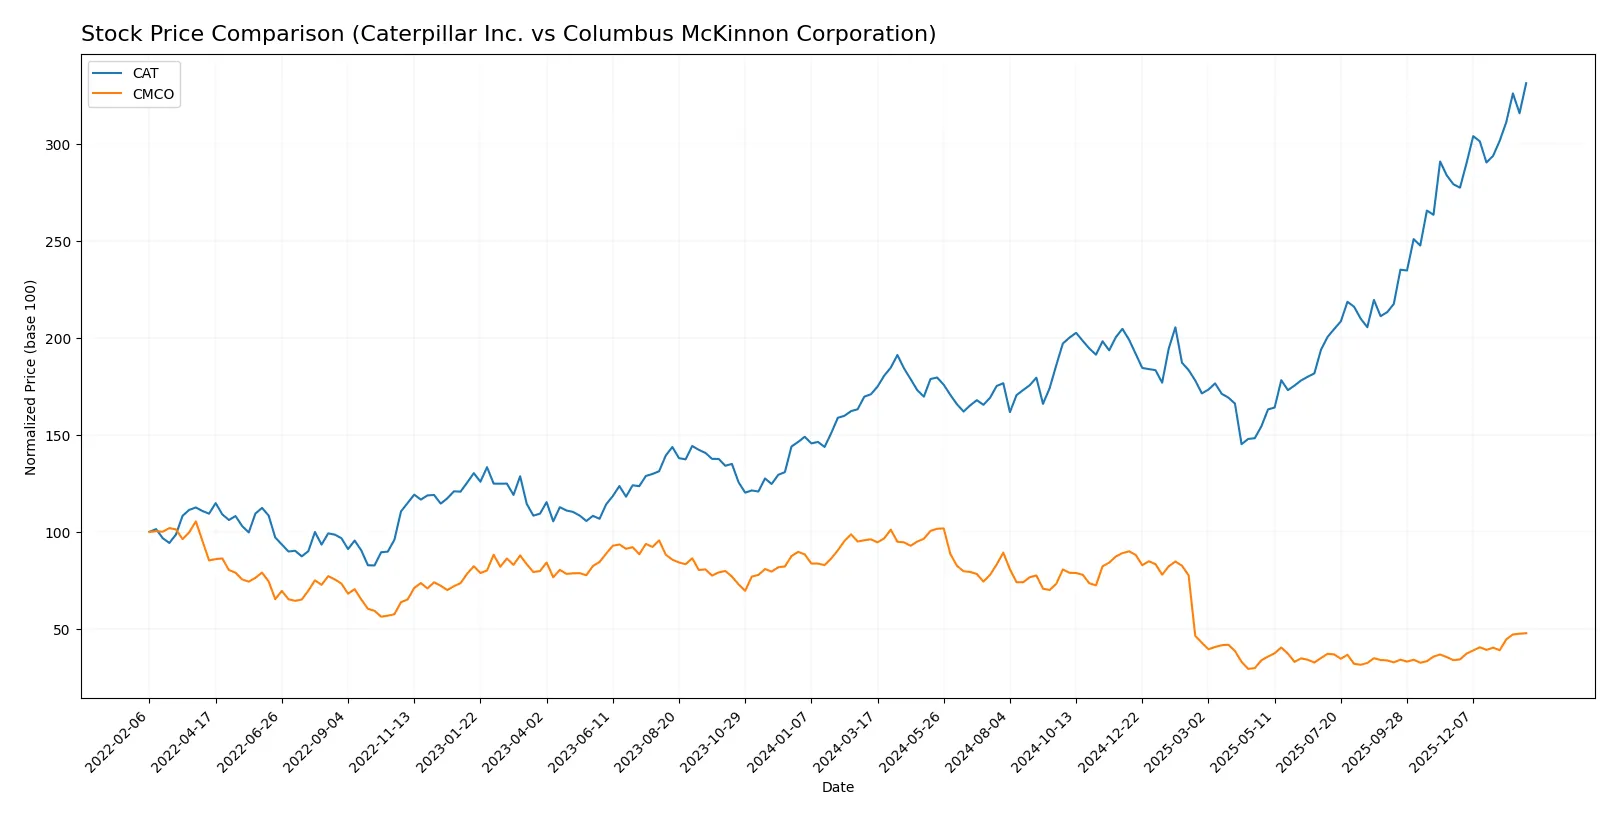
Trend Comparison
Caterpillar’s stock surged 93.8% over the past 12 months, marking a bullish trend with accelerating gains and a high price range between 288.08 and 657.36.
Columbus McKinnon’s stock declined 50.33% over the same period, reflecting a bearish trend despite recent 41% gains and strong buyer dominance since November 2025.
Caterpillar outperformed Columbus McKinnon, delivering the highest market returns with sustained acceleration and superior price appreciation.
Target Prices
Analysts present a varied but constructive target consensus for Caterpillar Inc. and Columbus McKinnon Corporation.
| Company | Target Low | Target High | Consensus |
|---|---|---|---|
| Caterpillar Inc. | 395 | 805 | 666.92 |
| Columbus McKinnon Corporation | 15 | 15 | 15 |
Caterpillar’s consensus target of $666.92 slightly exceeds its current price of $657.36, signaling modest upside potential. Columbus McKinnon’s flat $15 target contrasts with its $21.08 market price, suggesting possible overvaluation or market optimism beyond analyst views.

Don’t Let Luck Decide Your Entry Point
Optimize your entry points with our advanced ProRealTime indicators. You’ll get efficient buy signals with precise price targets for maximum performance. Start outperforming now!
How do institutions grade them?
The following tables summarize recent institutional grades for Caterpillar Inc. and Columbus McKinnon Corporation:
Caterpillar Inc. Grades
Here are recent grades given by leading financial institutions for Caterpillar Inc.:
| Grading Company | Action | New Grade | Date |
|---|---|---|---|
| JP Morgan | maintain | Overweight | 2024-10-14 |
| Morgan Stanley | downgrade | Underweight | 2024-10-14 |
| Truist Securities | maintain | Buy | 2024-10-09 |
| Citigroup | maintain | Buy | 2024-10-09 |
| B of A Securities | maintain | Buy | 2024-09-30 |
| Evercore ISI Group | maintain | In Line | 2024-08-19 |
| B of A Securities | maintain | Buy | 2024-08-07 |
| Truist Securities | maintain | Buy | 2024-08-07 |
| UBS | maintain | Sell | 2024-08-07 |
| Barclays | maintain | Equal Weight | 2024-08-07 |
Columbus McKinnon Corporation Grades
The following table details institutional grades recently issued for Columbus McKinnon Corporation:
| Grading Company | Action | New Grade | Date |
|---|---|---|---|
| DA Davidson | downgrade | Neutral | 2025-02-11 |
| DA Davidson | maintain | Buy | 2024-02-05 |
| DA Davidson | maintain | Buy | 2022-10-04 |
| DA Davidson | maintain | Buy | 2022-10-03 |
| Barrington Research | maintain | Outperform | 2022-07-29 |
| Barrington Research | maintain | Outperform | 2022-07-28 |
| JP Morgan | downgrade | Neutral | 2022-05-26 |
| Barrington Research | maintain | Outperform | 2022-05-26 |
| Barrington Research | maintain | Outperform | 2022-05-25 |
| JP Morgan | downgrade | Neutral | 2022-05-25 |
Which company has the best grades?
Caterpillar holds a broader range of recent upgrades with multiple “Buy” and an “Overweight” rating from JP Morgan. Columbus McKinnon’s grades show downgrades to “Neutral” from prior “Buy” and “Outperform” ratings. Investors might view Caterpillar’s stronger consensus as a signal of greater institutional confidence.
Risks specific to each company
The following categories identify the critical pressure points and systemic threats facing both firms in the 2026 market environment:
1. Market & Competition
Caterpillar Inc.
- Faces intense global competition in construction and mining equipment, requiring constant innovation and scale.
Columbus McKinnon Corporation
- Operates in a niche industrial motion solutions market, exposed to sector-specific demand fluctuations.
2. Capital Structure & Debt
Caterpillar Inc.
- High debt-to-equity ratio at 2.03 signals elevated leverage risk despite strong interest coverage.
Columbus McKinnon Corporation
- Moderate leverage with debt-to-equity at 0.61 but weak interest coverage (0.83) raises refinancing concerns.
3. Stock Volatility
Caterpillar Inc.
- Beta of 1.568 indicates higher volatility than the market, reflecting cyclical exposure.
Columbus McKinnon Corporation
- Lower beta at 1.289 suggests somewhat less volatility but still above market average.
4. Regulatory & Legal
Caterpillar Inc.
- Subject to environmental regulations and trade policies impacting global operations.
Columbus McKinnon Corporation
- Faces regulatory scrutiny over industrial safety standards and product certifications.
5. Supply Chain & Operations
Caterpillar Inc.
- Complex global supply chain vulnerable to raw material price swings and geopolitical disruptions.
Columbus McKinnon Corporation
- Smaller scale supply chain with risks tied to specific component sourcing and manufacturing capacity.
6. ESG & Climate Transition
Caterpillar Inc.
- Pressured to innovate toward low-emission machinery amid tightening emissions standards.
Columbus McKinnon Corporation
- ESG initiatives less visible but necessary to meet evolving industrial customer demands.
7. Geopolitical Exposure
Caterpillar Inc.
- Significant exposure to global trade tensions and volatile emerging markets.
Columbus McKinnon Corporation
- Primarily US-focused with limited but material exposure to international markets.
Which company shows a better risk-adjusted profile?
Caterpillar’s primary risk is its elevated leverage, which strains financial flexibility despite strong operating metrics. Columbus McKinnon struggles with profitability and interest coverage, signaling operational and financial stress. Caterpillar’s scale and safer Altman Z-Score (4.64 vs. 1.49) offer a better cushion. Columbus McKinnon’s distress zone Altman score and weak interest coverage heighten bankruptcy risk. Caterpillar’s superior profitability and cash flow stability justify greater confidence despite market volatility.
Final Verdict: Which stock to choose?
Caterpillar Inc. commands attention with its unmatched efficiency in capital deployment and robust profitability. Its growing ROIC signals improving competitive positioning. A point of vigilance remains its elevated debt levels, which may pressure financial flexibility. Caterpillar suits portfolios focused on resilient industrial growth and value creation.
Columbus McKinnon Corporation’s strategic moat lies in its niche manufacturing expertise and asset-light model, offering a stable cash flow profile. It presents a safer balance sheet relative to Caterpillar but struggles with profitability and declining ROIC. This stock fits investors seeking turnaround potential within a risk-conscious framework.
If you prioritize durable competitive advantages and consistent value creation, Caterpillar outshines with stronger profitability and market momentum. However, if you seek a more conservative risk profile with potential recovery upside, Columbus McKinnon offers better stability despite current operational headwinds. Each appeals to distinct investor avatars balancing growth and risk tolerance.
Disclaimer: Investment carries a risk of loss of initial capital. The past performance is not a reliable indicator of future results. Be sure to understand risks before making an investment decision.
Go Further
I encourage you to read the complete analyses of Caterpillar Inc. and Columbus McKinnon Corporation to enhance your investment decisions: