Carvana Co. and Copart, Inc. are two prominent players transforming the vehicle marketplace through innovative digital platforms. Carvana focuses on e-commerce for used car buying and selling, while Copart excels in online vehicle auctions and remarketing services worldwide. Their overlapping presence in auto-related digital services makes this comparison compelling. Join me as we analyze both companies to identify which offers the most promising investment opportunity in 2026.

Table of contents
Companies Overview
I will begin the comparison between Carvana and Copart by providing an overview of these two companies and their main differences.
Carvana Overview
Carvana Co. operates an e-commerce platform dedicated to buying and selling used cars in the United States. Founded in 2012 and based in Tempe, Arizona, Carvana offers services including vehicle acquisition, inspection, online shopping, financing, logistics, and post-sale support. It positions itself as a comprehensive digital car dealership within the consumer cyclical sector, employing about 17,400 people.
Copart Overview
Copart, Inc., headquartered in Dallas, Texas, specializes in online auctions and vehicle remarketing services across multiple countries, including the US, UK, and Germany. Incorporated in 1982, Copart utilizes advanced auction technology to serve licensed dismantlers, rebuilders, dealers, and the public. Operating within the industrials sector, Copart employs around 13,800 people and offers a broad range of vehicle processing and remarketing services.
Key similarities and differences
Both Carvana and Copart operate online platforms focused on the automotive sector, but their business models differ. Carvana centers on direct consumer sales of used vehicles through e-commerce, while Copart facilitates vehicle remarketing primarily via online auctions for dealers and dismantlers. Carvana is positioned in consumer cyclical, whereas Copart is classified under industrials, reflecting their distinct operational focuses and market approaches.
Income Statement Comparison
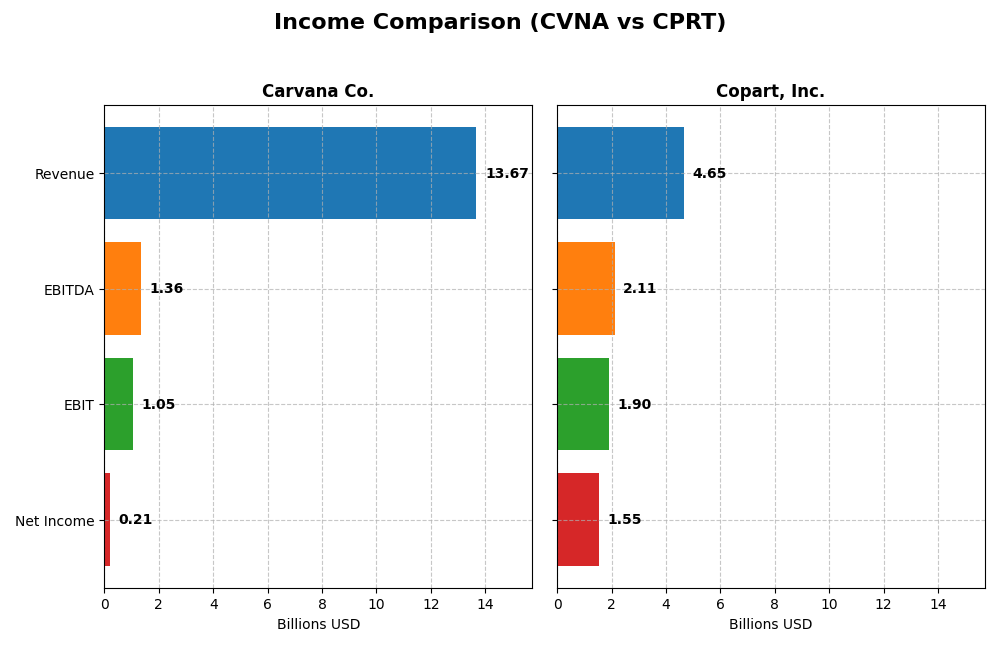
The following table compares the most recent fiscal year income statement metrics for Carvana Co. and Copart, Inc., providing a clear financial snapshot for each company.
| Metric | Carvana Co. (CVNA) | Copart, Inc. (CPRT) |
|---|---|---|
| Market Cap | 100.4B | 38.6B |
| Revenue | 13.67B | 4.65B |
| EBITDA | 1.36B | 2.11B |
| EBIT | 1.05B | 1.90B |
| Net Income | 210M | 1.55B |
| EPS | 1.72 | 1.61 |
| Fiscal Year | 2024 | 2025 |
Income Statement Interpretations
Carvana Co.
Carvana Co. showed strong revenue growth of 26.94% in 2024, reaching $13.7B, with net income rising significantly over the 2020-2024 period. Margins remain mostly stable, with a gross margin near 19.8% and neutral EBIT margin at 7.7%. The recent year saw improved profitability despite a net margin decline, reflecting operational gains and better interest expense control.
Copart, Inc.
Copart, Inc. experienced steady revenue increases, growing 9.7% in 2025 to $4.65B, with solid net income growth and a consistently higher gross margin of 45.2%. EBIT and net margins remain strong at 40.8% and 33.4%, respectively. The latest year showed continued margin strength and modest EPS growth, though operating expenses grew slightly faster than revenue.
Which one has the stronger fundamentals?
Both companies have favorable income statement trends, but Copart exhibits stronger and more stable margins, notably with a high net margin above 30%. Carvana’s rapid revenue and net income growth are positive but come with narrower margins and recent net margin volatility. Copart’s balanced margin performance and consistent profitability reflect more robust fundamentals in 2025.
Financial Ratios Comparison
The table below compares key financial ratios for Carvana Co. and Copart, Inc. based on their most recent fiscal year data, providing insight into profitability, liquidity, leverage, efficiency, and shareholder returns.
| Ratios | Carvana Co. (CVNA) 2024 | Copart, Inc. (CPRT) 2025 |
|---|---|---|
| ROE | 16.7% | 16.9% |
| ROIC | 13.3% | 14.7% |
| P/E | 118.5 | 28.2 |
| P/B | 19.7 | 4.8 |
| Current Ratio | 3.64 | 8.25 |
| Quick Ratio | 2.44 | 8.19 |
| D/E (Debt-to-Equity) | 4.80 | 0.01 |
| Debt-to-Assets | 71.3% | 1.0% |
| Interest Coverage | 1.54 | 0 (not reported) |
| Asset Turnover | 1.61 | 0.46 |
| Fixed Asset Turnover | 4.26 | 1.26 |
| Payout ratio | 0 | 0 |
| Dividend yield | 0% | 0% |
Interpretation of the Ratios
Carvana Co.
Carvana shows a mixed ratio profile with only 28.57% favorable indicators. Key concerns include a high price-to-earnings ratio of 118.48 and elevated debt-to-equity at 4.8, alongside a current ratio of 3.64 flagged as unfavorable. Asset turnover ratios are strong, but the overall evaluation is unfavorable. Carvana does not pay dividends, reflecting a reinvestment focus amid profitability challenges.
Copart, Inc.
Copart presents a stronger ratio set, with half of the metrics favorable and a slightly favorable global opinion. It boasts a robust net margin of 33.41% and a low debt-to-assets ratio of 1.03%. Current ratio is high but considered unfavorable due to possible inefficiency. Copart also does not pay dividends, likely prioritizing growth and operational reinvestment over distributions.
Which one has the best ratios?
Copart holds the advantage with 50% favorable ratios and a solid profitability profile, contrasting with Carvana’s 28.57% favorable and multiple financial stress points. Despite Copart’s slightly unfavorable valuation ratios, its low leverage and strong returns offer a comparatively more balanced financial structure.
Strategic Positioning
This section compares the strategic positioning of Carvana Co. and Copart, Inc., focusing on Market position, Key segments, and Exposure to technological disruption:
Carvana Co.
- Large market cap ($100B) in auto dealerships, high beta indicates volatile competitive pressure.
- Primarily focused on used vehicle sales ($9.7B in 2024) and complementary products/services.
- Operates e-commerce platform with auction sites, integrating logistics and customer support digitally.
Copart, Inc.
- Mid-sized market cap ($38B) in specialty services, lower beta reflects moderate competitive pressure.
- Diversified services including online auctions, vehicle remarketing, and wholesale remarketing.
- Leverages advanced internet auction technology and proprietary tools like Copart 360 and IntelliSeller.
Carvana Co. vs Copart, Inc. Positioning
Carvana concentrates on e-commerce auto retailing with a focus on used vehicle sales, while Copart offers diversified online auction and vehicle remarketing services globally. Carvana’s scale contrasts with Copart’s broader service scope and international presence, each with distinct operational focuses.
Which has the best competitive advantage?
Copart shows a slightly favorable moat with value creation despite declining ROIC, indicating some sustainable competitive advantage. Carvana’s slightly unfavorable moat suggests it is shedding value but improving profitability, reflecting higher risk in competitive positioning.
Stock Comparison
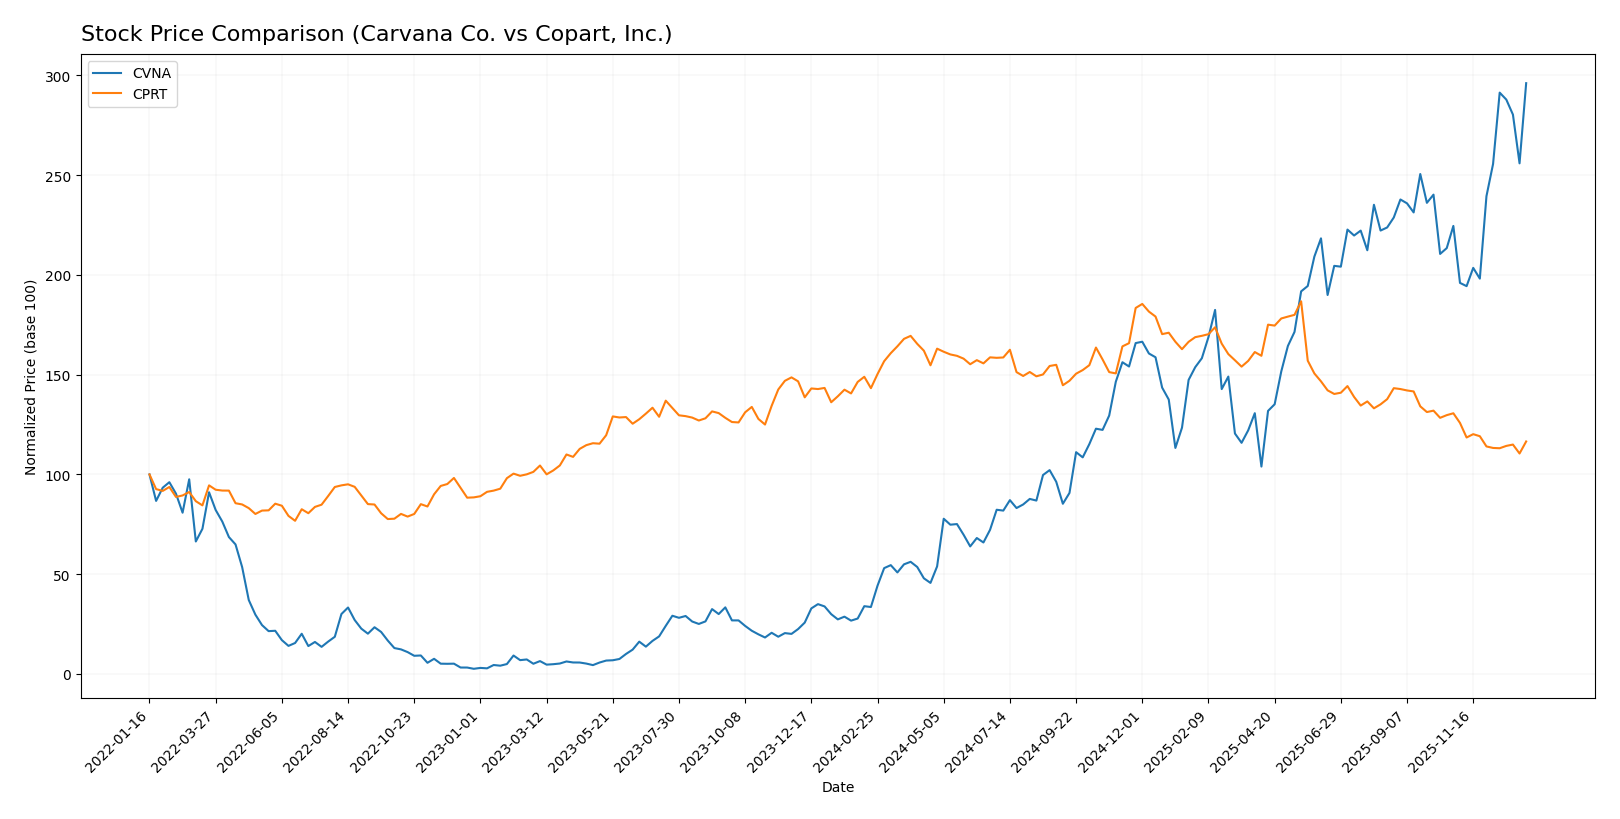
The stock price movements of Carvana Co. and Copart, Inc. over the past year reveal contrasting trends, with Carvana showing significant growth and acceleration, while Copart experiences a steady decline and deceleration.
Trend Analysis
Carvana Co. (CVNA) exhibited a strong bullish trend over the past 12 months, with a remarkable 782.41% price increase, acceleration in trend, and high volatility indicated by a 106.51 std deviation. The stock reached a high of 463.09 and a low of 52.48.
Copart, Inc. (CPRT) showed a bearish trend over the same period, with an 18.65% price decline, deceleration in trend, and relatively low volatility at a 6.2 std deviation. The highest price recorded was 63.84, and the lowest was 37.77.
Comparing both stocks, Carvana delivered the highest market performance with a substantial price gain, whereas Copart experienced a notable decline in value over the past year.
Target Prices
Analysts provide a clear target price consensus for both Carvana Co. and Copart, Inc., reflecting varied expectations.
| Company | Target High | Target Low | Consensus |
|---|---|---|---|
| Carvana Co. | 550 | 360 | 455.67 |
| Copart, Inc. | 62 | 33 | 49 |
Carvana’s consensus target price of 455.67 is slightly below its current price of 463.21, suggesting cautious optimism. Copart’s target consensus at 49 is notably above the current price of 39.83, indicating potential upside according to analysts.
Analyst Opinions Comparison
This section compares analysts’ ratings and grades for Carvana Co. and Copart, Inc.:
Rating Comparison
Carvana Co. Rating
- Rating: C+ with a very favorable overall status
- Discounted Cash Flow Score: 1, very unfavorable
- ROE Score: 5, very favorable
- ROA Score: 4, favorable
- Debt To Equity Score: 1, very unfavorable
- Overall Score: 2, moderate
Copart, Inc. Rating
- Rating: A with a very favorable overall status
- Discounted Cash Flow Score: 4, favorable
- ROE Score: 4, favorable
- ROA Score: 5, very favorable
- Debt To Equity Score: 5, very favorable
- Overall Score: 4, favorable
Which one is the best rated?
Based strictly on the provided data, Copart, Inc. is better rated with an A rating and favorable to very favorable scores across key metrics, while Carvana Co. holds a C+ rating with several very unfavorable scores.
Scores Comparison
Here is a comparison of the Altman Z-Score and Piotroski Score for Carvana Co. and Copart, Inc.:
CVNA Scores
- Altman Z-Score: 10.95, indicating a safe zone with low bankruptcy risk.
- Piotroski Score: 7, showing strong financial health but not very strong.
CPRT Scores
- Altman Z-Score: 26.31, indicating a safe zone with very low bankruptcy risk.
- Piotroski Score: 6, reflecting average financial strength.
Which company has the best scores?
Based strictly on the provided data, CPRT has a higher Altman Z-Score, indicating stronger financial stability, while CVNA has a better Piotroski Score, suggesting stronger overall financial health. The scores show different strengths for each company.
Grades Comparison
The following tables summarize recent reliable grades assigned to Carvana Co. and Copart, Inc.:
Carvana Co. Grades
This table shows recent grades from established grading companies for Carvana Co.:
| Grading Company | Action | New Grade | Date |
|---|---|---|---|
| Evercore ISI Group | Maintain | In Line | 2025-12-23 |
| Wedbush | Maintain | Outperform | 2025-12-19 |
| BTIG | Maintain | Buy | 2025-12-19 |
| Citigroup | Maintain | Buy | 2025-12-12 |
| Barclays | Maintain | Overweight | 2025-12-11 |
| Jefferies | Maintain | Buy | 2025-12-11 |
| Evercore ISI Group | Maintain | In Line | 2025-12-09 |
| B of A Securities | Maintain | Buy | 2025-12-08 |
| Wedbush | Upgrade | Outperform | 2025-11-24 |
| Needham | Maintain | Buy | 2025-11-17 |
The overall trend for Carvana Co. is positive with multiple buy and outperform ratings maintained and some upgrades, indicating confidence among analysts.
Copart, Inc. Grades
This table presents recent grades from reputable grading firms for Copart, Inc.:
| Grading Company | Action | New Grade | Date |
|---|---|---|---|
| JP Morgan | Maintain | Neutral | 2025-11-24 |
| Baird | Maintain | Outperform | 2025-11-21 |
| Barclays | Maintain | Underweight | 2025-11-21 |
| Stephens & Co. | Maintain | Equal Weight | 2025-09-05 |
| HSBC | Upgrade | Buy | 2025-09-04 |
| Baird | Maintain | Outperform | 2025-07-17 |
| JP Morgan | Maintain | Neutral | 2025-05-23 |
| Baird | Maintain | Outperform | 2025-02-21 |
| JP Morgan | Maintain | Neutral | 2024-11-19 |
| Baird | Maintain | Outperform | 2024-09-05 |
Copart’s grades show a mixed but generally positive pattern, with several outperform ratings balanced by neutral and underweight opinions.
Which company has the best grades?
Copart, Inc. holds a consensus rating of “Buy” with a balanced mix of outperform and buy grades, while Carvana Co. shows a consensus of “Hold” despite more buy ratings. This suggests Copart may be viewed as having stronger analyst support, potentially impacting investor confidence differently.
Strengths and Weaknesses
Below is a comparative overview of key strengths and weaknesses for Carvana Co. (CVNA) and Copart, Inc. (CPRT) based on recent financial and market data.
| Criterion | Carvana Co. (CVNA) | Copart, Inc. (CPRT) |
|---|---|---|
| Diversification | Primarily used vehicle sales (9.68B in 2024), limited other product/service sales (1.15B) | Balanced product (678M) and strong service revenue (3.97B) |
| Profitability | Low net margin (1.54%), high ROIC (13.32%) but below WACC (19.24%) indicating value destruction | High net margin (33.41%), ROIC (14.7%) above WACC (8.94%), creating value |
| Innovation | Growing ROIC trend (+207%), indicating improving efficiency and potential innovation | Declining ROIC trend (-35%), suggesting challenges in maintaining innovation or efficiency |
| Global presence | Limited data, mainly U.S.-focused vehicle sales | Well-established international presence via online vehicle auction services |
| Market Share | Significant in online used vehicle market, but facing profitability challenges | Strong market share in vehicle salvage and auction services, stable financial ratios |
Key takeaways: Carvana shows growth potential with improving ROIC but struggles with profitability and capital efficiency. Copart demonstrates solid profitability and value creation despite a declining ROIC trend, supported by diversified revenue streams and a strong market position. Investors should weigh Carvana’s growth prospects against its financial risks, while Copart offers a more stable, slightly favorable investment profile.
Risk Analysis
Below is a comparative table highlighting key risks for Carvana Co. (CVNA) and Copart, Inc. (CPRT) based on the most recent data from fiscal years 2024 and 2025.
| Metric | Carvana Co. (CVNA) | Copart, Inc. (CPRT) |
|---|---|---|
| Market Risk | High beta (3.55) indicates strong volatility | Moderate beta (1.10) shows less volatility |
| Debt level | High debt-to-equity (4.8) and debt/assets (71.3%) | Very low debt-to-equity (0.01) and debt/assets (1.03%) |
| Regulatory Risk | Moderate, auto dealership regulations apply | Moderate, across multiple countries and sectors |
| Operational Risk | Complex logistics and e-commerce platform | Diverse auction and remarketing services globally |
| Environmental Risk | Medium, vehicle lifecycle impacts | Medium, salvage and recycling services involved |
| Geopolitical Risk | Low, primarily US operations | Moderate, operates in multiple international markets |
Carvana faces significant financial risk due to its high leverage and market volatility, which may impact stability despite favorable return on equity. Copart’s low debt and diversified global presence reduce financial risk, though geopolitical exposure is higher. Investors should weigh Carvana’s growth potential against its debt burden and Copart’s steadier financial profile amid international uncertainties.
Which Stock to Choose?
Carvana Co. (CVNA) shows a favorable income statement with 71% positive metrics and strong revenue growth of 145% over five years. However, its financial ratios are mostly unfavorable (71%), with high debt levels and a slightly unfavorable MOAT indicating value destruction despite improving profitability. The company holds a moderate overall rating of C+.
Copart, Inc. (CPRT) presents a highly favorable income statement (79% positive), stable profit margins, and consistent growth. Its financial ratios are slightly favorable (50%), supported by low debt and a slightly favorable MOAT reflecting value creation despite a declining ROIC trend. CPRT benefits from a stronger overall rating of A.
Investors seeking growth potential might find CVNA’s improving profitability and strong income growth appealing, while those prioritizing financial stability and value creation may consider CPRT’s solid ratios and higher rating as more favorable. The choice could depend on the investor’s risk tolerance and strategy focus.
Disclaimer: Investment carries a risk of loss of initial capital. The past performance is not a reliable indicator of future results. Be sure to understand risks before making an investment decision.
Go Further
I encourage you to read the complete analyses of Carvana Co. and Copart, Inc. to enhance your investment decisions: