Home > Comparison > Industrials > TT vs CARR
The strategic rivalry between Trane Technologies plc and Carrier Global Corporation shapes the evolution of the Industrials sector. Trane operates as a diversified HVAC and transport refrigeration manufacturer, emphasizing integrated energy solutions. Carrier focuses on advanced HVAC, refrigeration, and fire & security systems with a technology-driven approach. This analysis compares their operational models and growth strategies to identify which offers the superior risk-adjusted profile for a balanced, diversified portfolio.
Table of contents
Companies Overview
Trane Technologies and Carrier Global stand as major players in the global HVAC and refrigeration markets.
Trane Technologies plc: Global HVAC and Transport Refrigeration Leader
Trane Technologies dominates the heating, ventilation, and air conditioning (HVAC) sector through its design, manufacturing, and servicing of HVAC and transport refrigeration solutions. Its revenue stems from a diverse product range including chillers, heat pumps, and hybrid refrigeration systems. In 2026, the company emphasizes energy-efficient technologies and integrated building management systems to capture rising demand for sustainable solutions.
Carrier Global Corporation: Comprehensive Building Systems Innovator
Carrier Global operates across HVAC, refrigeration, and fire & security segments, generating revenue from products and services such as air conditioners, transport refrigeration, and building automation. The company focuses on expanding its digital and connected solutions in 2026, aiming to enhance operational efficiency and safety for commercial and residential customers worldwide.
Strategic Collision: Similarities & Divergences
Both companies compete fiercely in the HVAC and refrigeration markets, yet Trane prioritizes energy efficiency while Carrier pushes digital integration and security. Trane’s product-heavy, service-inclusive model contrasts with Carrier’s multi-segment approach combining HVAC, refrigeration, and fire safety. Their differing strategies create distinct investment profiles: Trane offers a focused industrial play, whereas Carrier presents diversified exposure across building technologies.
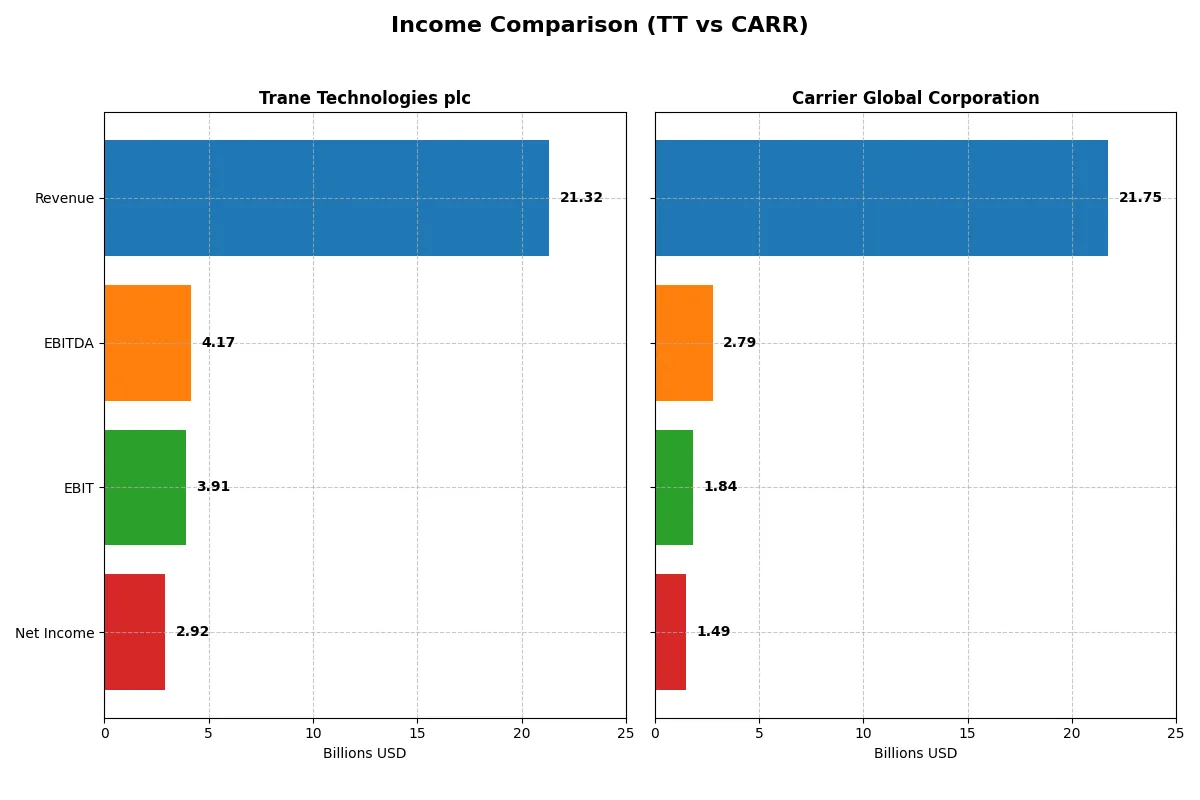
Income Statement Comparison
This data dissects the core profitability and scalability of both corporate engines to reveal who dominates the bottom line:
| Metric | Trane Technologies plc (TT) | Carrier Global Corporation (CARR) |
|---|---|---|
| Revenue | 21.3B | 21.7B |
| Cost of Revenue | 13.6B | 16.1B |
| Operating Expenses | 3.74B | 3.48B |
| Gross Profit | 7.7B | 5.63B |
| EBITDA | 4.17B | 2.79B |
| EBIT | 3.91B | 1.84B |
| Interest Expense | 0.23B | 0.35B |
| Net Income | 2.92B | 1.49B |
| EPS | 13.09 | 1.74 |
| Fiscal Year | 2025 | 2025 |
Income Statement Analysis: The Bottom-Line Duel
This income statement comparison reveals which company runs a more efficient and profitable corporate engine over recent years.
Trane Technologies plc Analysis
Trane Technologies shows a steady revenue climb from $14.1B in 2021 to $21.3B in 2025, doubling net income from $1.4B to $2.9B. Its gross margin holds strong near 36%, while net margin expands to 13.7%, signaling robust cost control and operational leverage. The 2025 results demonstrate accelerating profitability and disciplined expense management.
Carrier Global Corporation Analysis
Carrier’s revenue fluctuates, peaking at $22.5B in 2024 before declining to $21.7B in 2025. Net income drops sharply from $5.6B in 2024 to $1.5B in 2025, driven by compressed margins—gross margin falls to 25.9% and net margin shrinks below 7%. The latest year reflects weakening earnings momentum and margin pressure amid rising costs.
Margin Strength vs. Earnings Stability
Trane Technologies outperforms Carrier with superior margin expansion and consistent profit growth over five years. Carrier’s recent earnings volatility and margin erosion contrast sharply with Trane’s disciplined cost structure and expanding net income. For investors focused on steady profitability and margin resilience, Trane’s profile stands out as more attractive.
Financial Ratios Comparison
These vital ratios act as a diagnostic tool to expose the underlying fiscal health, valuation premiums, and capital efficiency of the companies compared below:
| Ratios | Trane Technologies (TT) | Carrier Global (CARR) |
|---|---|---|
| ROE | 33.9% | 10.8% |
| ROIC | 20.3% | 5.8% |
| P/E | 29.8 | 29.7 |
| P/B | 10.1 | 3.2 |
| Current Ratio | 1.25 | 1.20 |
| Quick Ratio | 0.92 | 0.85 |
| D/E (Debt-to-Equity) | 0.54 | 0.92 |
| Debt-to-Assets | 21.5% | 34.1% |
| Interest Coverage | 17.4 | 6.2 |
| Asset Turnover | 1.00 | 0.58 |
| Fixed Asset Turnover | 9.47 | 5.86 |
| Payout Ratio | 28.7% | 51.7% |
| Dividend Yield | 0.96% | 1.74% |
| Fiscal Year | 2025 | 2025 |
Efficiency & Valuation Duel: The Vital Signs
Ratios act as a company’s DNA, revealing hidden risks and operational excellence that shape investor confidence and valuation integrity.
Trane Technologies plc
Trane displays robust profitability with a 33.9% ROE and a 13.7% net margin, signaling operational efficiency. Its P/E of 29.8 and P/B of 10.1 mark the stock as expensive. Dividend yield at 0.96% is low, indicating a preference for reinvestment over high payouts, supporting growth and capital discipline.
Carrier Global Corporation
Carrier shows moderate profitability, with a 10.8% ROE and 6.9% net margin, reflecting operational neutrality. Its P/E of 29.7 is similar to Trane’s, but a lower P/B of 3.2 suggests less valuation stretch. Dividend yield at 1.74% is higher, offering more income focus, though overall ratios remain neutral.
Premium Valuation vs. Operational Safety
Trane commands a premium valuation justified by superior returns on equity and capital employed, balancing risk with operational strength. Carrier offers a more neutral profile with higher income yield but weaker profitability. Growth-oriented investors may prefer Trane, while income-focused investors might lean toward Carrier.
Which one offers the Superior Shareholder Reward?
I see Trane Technologies (TT) and Carrier Global (CARR) both pay dividends but differ sharply in their distribution strategies. TT yields about 0.96%, with a moderate payout ratio near 29%, supporting a strong free cash flow (FCF) coverage ratio around 2.6x. TT also pursues steady buybacks, enhancing shareholder returns sustainably. CARR offers a higher dividend yield near 1.74% but at a payout ratio above 50%, signaling riskier sustainability. Its FCF coverage is weaker, especially in 2024, suggesting dividend pressure. Buyback activity at CARR is less consistent, reducing total yield. TT’s balanced dividends plus disciplined buybacks deliver a more sustainable and attractive total return profile in 2026. I favor TT for superior long-term shareholder reward.
Comparative Score Analysis: The Strategic Profile
The radar chart reveals the fundamental DNA and trade-offs of Trane Technologies plc and Carrier Global Corporation:
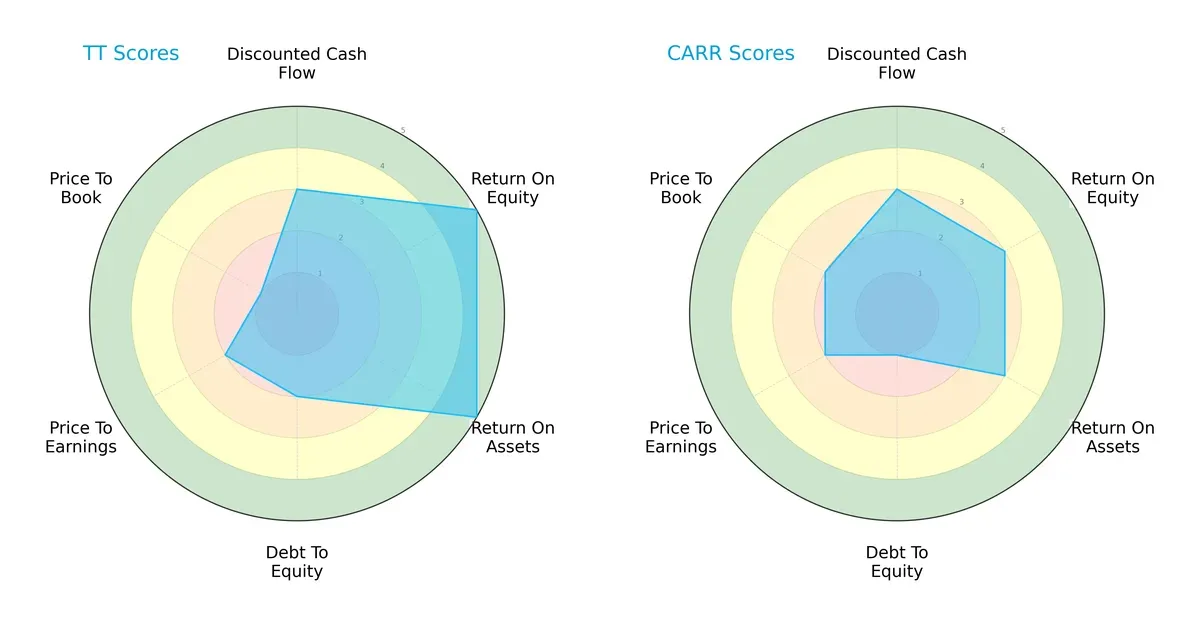
Trane Technologies shows superior profitability with stronger ROE (5 vs. 3) and ROA (5 vs. 3) scores. Carrier lags with weaker debt management (1 vs. 2) and valuation metrics (PE and PB scores). Trane’s profile is more balanced, while Carrier relies on moderate DCF strength but suffers from valuation and leverage disadvantages.
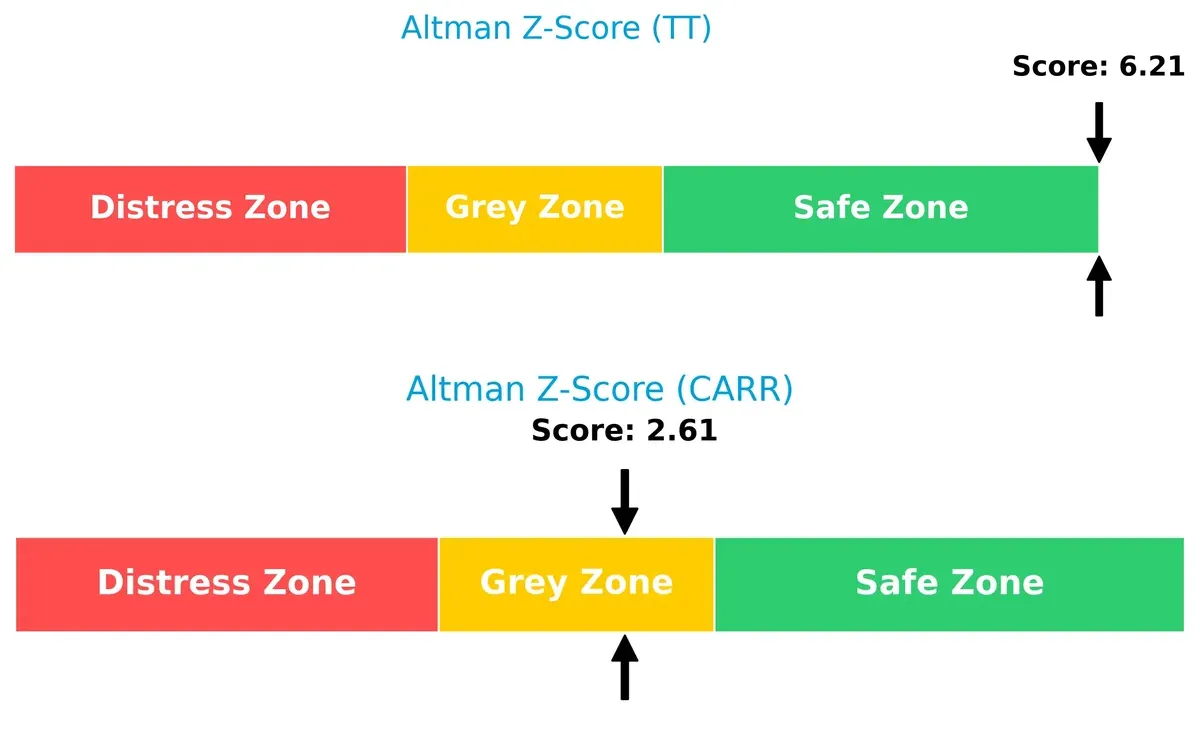
Bankruptcy Risk: Solvency Showdown
Trane’s Altman Z-Score (6.21) signals a robust financial position, well within the safe zone. Carrier’s score (2.61) falls into the grey zone, indicating moderate bankruptcy risk in this cycle:
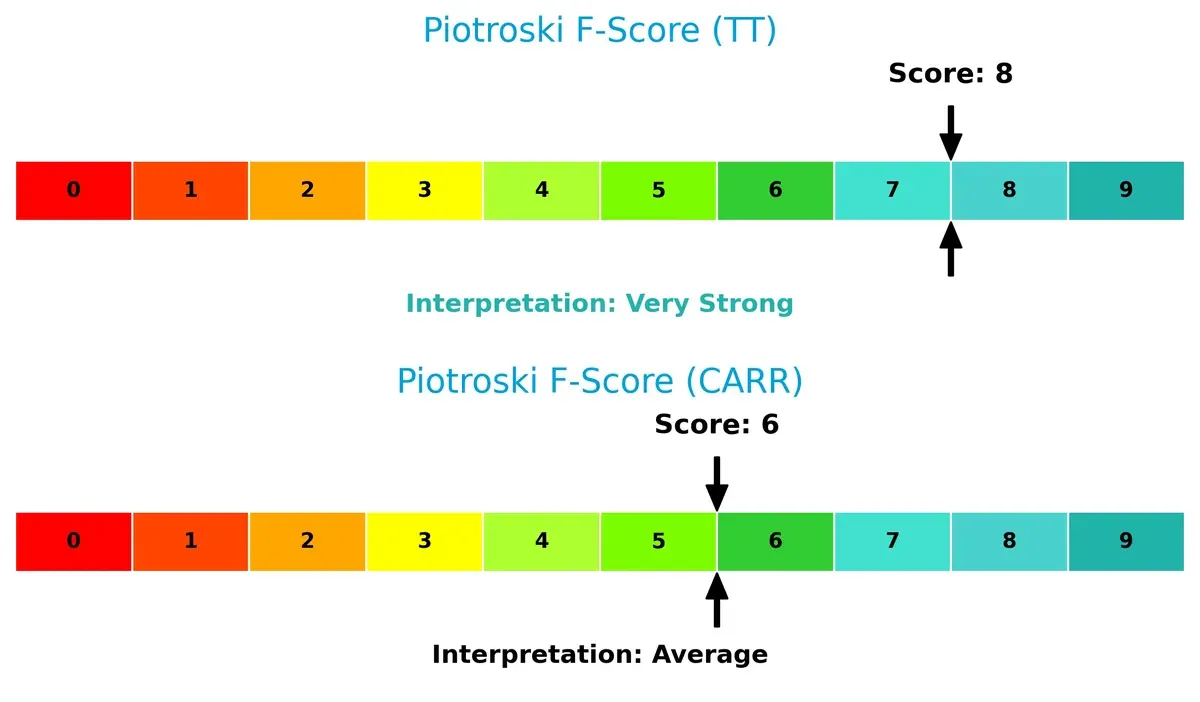
Financial Health: Quality of Operations
Trane scores an 8 on the Piotroski F-Score, reflecting very strong financial health. Carrier’s 6 signals average operational quality, raising caution about internal metrics compared to Trane:
How are the two companies positioned?
This section dissects the operational DNA of TT and CARR by comparing their revenue distribution and analyzing internal strengths and weaknesses. The goal is to confront their economic moats and identify which business model offers the most resilient, sustainable competitive advantage today.
Revenue Segmentation: The Strategic Mix
The following visual comparison dissects how both firms diversify their income streams and where their primary sector bets lie:
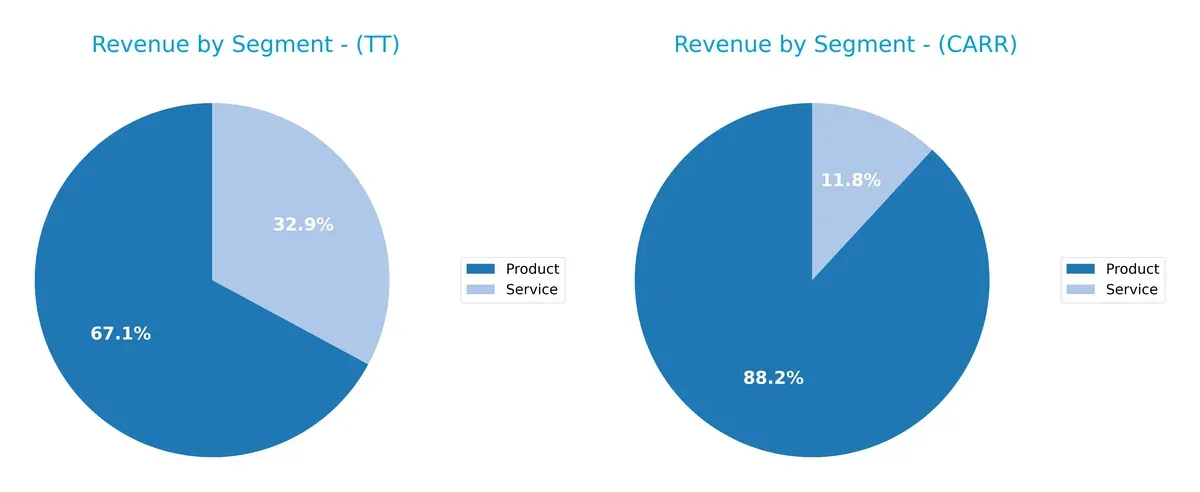
Trane Technologies (TT) balances revenue between Product (13.3B) and Service (6.5B), showing a more diversified model. Carrier Global (CARR) relies heavily on Product (19.9B) with a smaller Service slice (2.5B), anchoring its revenue in product sales. TT’s mix suggests resilience through service stability, while CARR’s concentration exposes it to product cycle risks but leverages infrastructure dominance.
Strengths and Weaknesses Comparison
This table compares the Strengths and Weaknesses of Trane Technologies plc and Carrier Global Corporation:
TT Strengths
- Higher net margin at 13.69%
- Strong ROE of 33.93%
- ROIC well above WACC at 20.26%
- Favorable debt to assets at 21.55%
- Strong interest coverage at 17.17
- Higher fixed asset turnover at 9.47
- Balanced product and service revenue mix
- Significant revenue from Americas and EMEA
CARR Strengths
- Stable interest coverage at 5.33
- Favorable fixed asset turnover at 5.86
- Large product revenue base at $19B+
- Diversified geographic presence with strong U.S. and Europe sales
- Moderate dividend yield at 1.74%
- Neutral current and quick ratios
TT Weaknesses
- High P/E ratio at 29.82, unfavorable relative to sector
- Elevated price-to-book at 10.12
- Dividend yield under 1% considered low
- Quick ratio below 1 at 0.92 indicates moderate liquidity risk
- Debt to equity ratio moderate at 0.54
- Asset turnover neutral at 1.0
CARR Weaknesses
- Lower profitability with net margin at 6.87% and ROE at 10.82%
- ROIC barely above 5.8% against WACC near 8.7%
- Price-to-book at 3.21 still unfavorable
- Quick ratio low at 0.85
- Higher debt to equity at 0.92
- Asset turnover weak at 0.58
Trane Technologies shows stronger profitability metrics and efficient capital use, but high valuation multiples and modest liquidity warrant caution. Carrier Global demonstrates a more neutral financial profile with weaker profitability and asset utilization but maintains solid product revenues and geographic diversification. Both companies must balance growth ambitions with financial prudence amid sector challenges.
The Moat Duel: Analyzing Competitive Defensibility
A structural moat alone shields long-term profits from competition’s relentless erosion. Here’s how two HVAC giants stack up:
Trane Technologies plc: Robust Value Creator Through Operational Excellence
Trane’s moat stems from cost advantage and durable brand strength, reflected in an 11% ROIC premium over WACC and rising profitability. Expansion into energy-efficient solutions in 2026 should deepen this moat.
Carrier Global Corporation: Struggling with Eroding Returns and Competitive Pressure
Carrier relies on brand recognition but suffers from declining ROIC, now 3% below WACC, signaling value destruction. Its weaker margin profile contrasts sharply with Trane’s. Opportunities in digital building automation could disrupt if executed well.
Cost Leadership vs. Value Drain: The Battle for HVAC Supremacy
Trane’s wide, expanding moat outmatches Carrier’s shrinking competitive edge. Trane’s efficient capital use and margin stability better defend market share against mounting competition.
Which stock offers better returns?
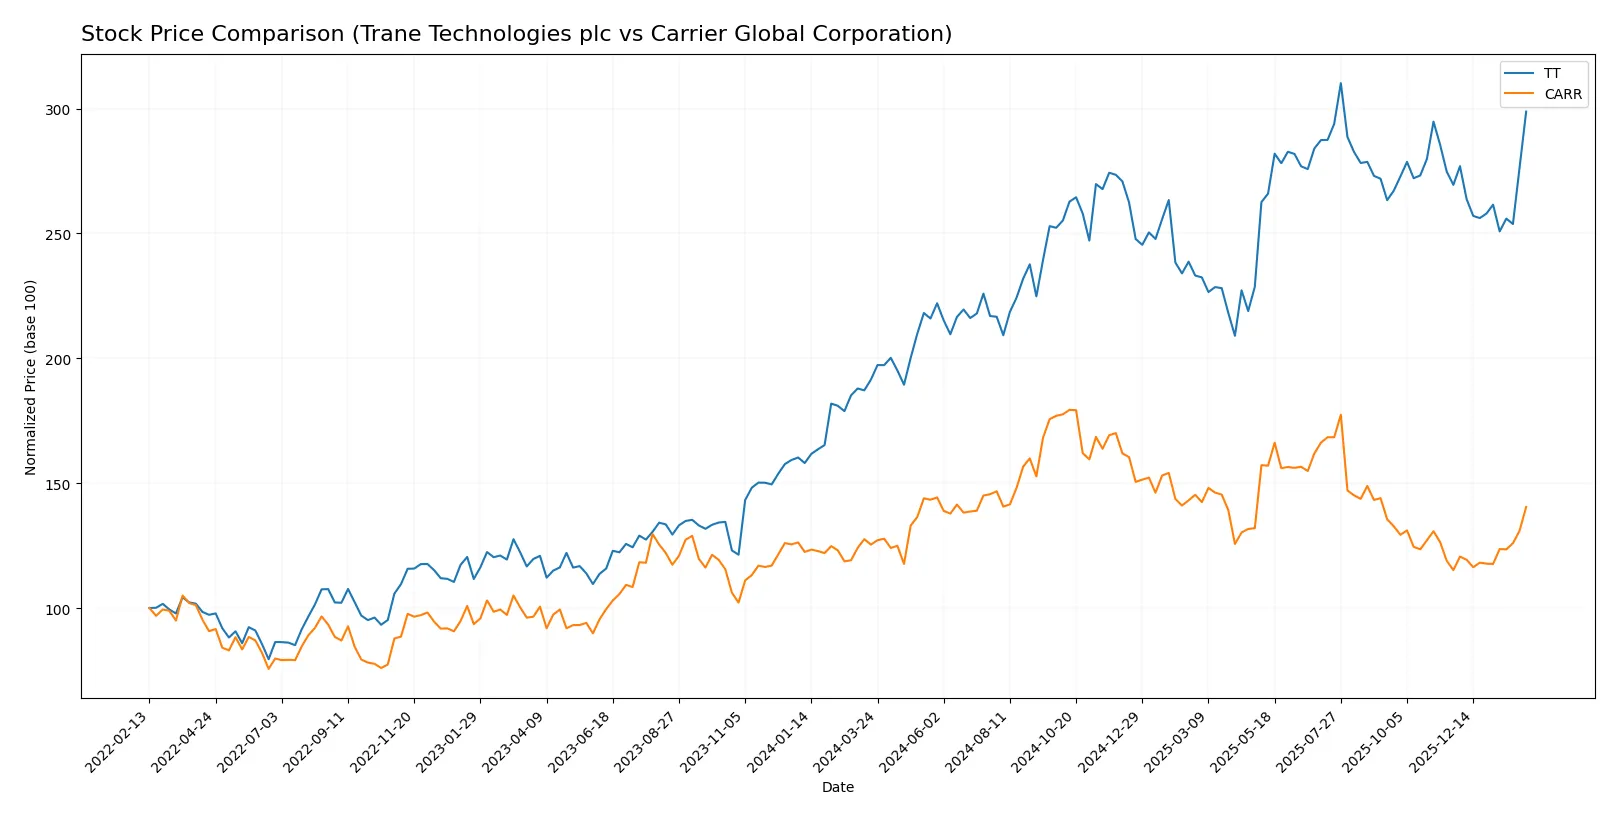
The past year shows distinct bullish trends for both stocks, with Trane Technologies exhibiting strong price acceleration and greater volatility compared to Carrier Global’s steadier gains.
Trend Comparison
Trane Technologies’ stock rose 56.06% over the past 12 months, marking a clear bullish trend with accelerating momentum and notable volatility, hitting a high of 472.07 and a low of 288.27.
Carrier Global’s stock gained 12.04% over the same period, also bullish with acceleration but lower volatility, ranging between 52.41 and 81.61, reflecting more stable upward movement.
Comparing both, Trane Technologies delivered the highest market performance with a more pronounced price increase and stronger acceleration than Carrier Global.
Target Prices
Analysts show a moderately bullish consensus for both Trane Technologies plc and Carrier Global Corporation.
| Company | Target Low | Target High | Consensus |
|---|---|---|---|
| Trane Technologies plc | 370 | 520 | 471.88 |
| Carrier Global Corporation | 55 | 74 | 67.88 |
Trane Technologies’ consensus target exceeds its current price of 455, implying upside potential. Carrier’s target consensus at 67.88 also suggests moderate appreciation from its current 63.92.

Don’t Let Luck Decide Your Entry Point
Optimize your entry points with our advanced ProRealTime indicators. You’ll get efficient buy signals with precise price targets for maximum performance. Start outperforming now!
How do institutions grade them?
Here is a summary of recent institutional grades for Trane Technologies plc and Carrier Global Corporation:
Trane Technologies plc Grades
The table below shows the latest grades assigned to Trane Technologies plc by major institutions.
| Grading Company | Action | New Grade | Date |
|---|---|---|---|
| Wells Fargo | Maintain | Underweight | 2026-01-30 |
| Citigroup | Maintain | Buy | 2026-01-30 |
| RBC Capital | Maintain | Sector Perform | 2026-01-30 |
| Barclays | Maintain | Overweight | 2026-01-30 |
| JP Morgan | Maintain | Neutral | 2026-01-30 |
| Oppenheimer | Maintain | Outperform | 2026-01-30 |
| Oppenheimer | Upgrade | Outperform | 2026-01-20 |
| Morgan Stanley | Maintain | Overweight | 2026-01-13 |
| Barclays | Maintain | Overweight | 2026-01-07 |
| UBS | Maintain | Buy | 2026-01-05 |
Carrier Global Corporation Grades
Below are the most recent institutional grades for Carrier Global Corporation.
| Grading Company | Action | New Grade | Date |
|---|---|---|---|
| RBC Capital | Maintain | Outperform | 2026-02-06 |
| Wells Fargo | Maintain | Equal Weight | 2026-02-06 |
| Citigroup | Maintain | Buy | 2026-02-06 |
| JP Morgan | Maintain | Neutral | 2026-01-16 |
| Citigroup | Maintain | Buy | 2026-01-12 |
| Mizuho | Maintain | Outperform | 2026-01-05 |
| UBS | Maintain | Buy | 2026-01-05 |
| Barclays | Maintain | Overweight | 2025-12-10 |
| RBC Capital | Maintain | Outperform | 2025-12-05 |
| Wells Fargo | Maintain | Equal Weight | 2025-12-04 |
Which company has the best grades?
Carrier Global Corporation receives more consistent high grades such as Outperform and Buy from multiple firms. Trane Technologies shows a wider range, including Underweight. Carrier’s stronger grades may suggest greater institutional confidence, potentially influencing investor sentiment positively.
Risks specific to each company
The following categories identify the critical pressure points and systemic threats facing both firms in the 2026 market environment:
1. Market & Competition
Trane Technologies plc
- Strong net margin (13.69%) and ROIC (20.26%) indicate competitive strength.
Carrier Global Corporation
- Moderate margins (6.87%) and ROIC (5.84%) suggest more pressure from competitors.
2. Capital Structure & Debt
Trane Technologies plc
- Debt-to-assets at 21.55% with strong interest coverage (17.17x) signals prudent leverage.
Carrier Global Corporation
- Higher debt-to-assets (34.07%) and lower interest coverage (5.33x) raise financial risk concerns.
3. Stock Volatility
Trane Technologies plc
- Beta of 1.211 shows moderate volatility in line with industrial sector norms.
Carrier Global Corporation
- Higher beta at 1.335 reflects greater stock price fluctuations and market sensitivity.
4. Regulatory & Legal
Trane Technologies plc
- Global operations expose it to diverse regulatory environments, increasing compliance complexity.
Carrier Global Corporation
- Operating heavily in US markets, it faces stringent domestic regulations in HVAC and fire safety sectors.
5. Supply Chain & Operations
Trane Technologies plc
- Extensive global supply chain may face disruptions but benefits from scale and diversification.
Carrier Global Corporation
- Complex operations across HVAC, refrigeration, and security segments increase operational risk.
6. ESG & Climate Transition
Trane Technologies plc
- Leading in energy-efficient HVAC and refrigeration solutions aligns with climate transition trends.
Carrier Global Corporation
- ESG efforts growing but lag behind peers in integrating sustainability deeply into product lines.
7. Geopolitical Exposure
Trane Technologies plc
- Headquarters in Ireland and global footprint expose it to EU and global geopolitical tensions.
Carrier Global Corporation
- US-centric base limits some geopolitical risks but increases exposure to US-China trade tensions.
Which company shows a better risk-adjusted profile?
Trane Technologies faces less financial leverage risk and shows stronger profitability, reflected in a safe Altman Z-score of 6.21 versus Carrier’s 2.61 in the grey zone. Carrier’s higher debt and volatility raise concerns. Trane’s leadership in ESG and global diversification further improve its risk profile. The most impactful risk for Trane is global regulatory complexity, while Carrier struggles most with capital structure strain. Trane’s superior interest coverage and robust margins justify confidence despite market headwinds.
Final Verdict: Which stock to choose?
Trane Technologies plc (TT) stands out as a cash-generating powerhouse with a strong and growing economic moat. Its disciplined capital allocation drives high returns on invested capital well above the cost of capital. A point of vigilance is its rich valuation, which may temper near-term upside. TT fits well in an aggressive growth portfolio seeking durable competitive advantage.
Carrier Global Corporation (CARR) offers a strategic moat anchored in steady recurring revenue streams and operational resilience. It presents a safer profile than TT, though its profitability metrics trail and ROIC is declining, signaling value erosion. CARR suits a more conservative GARP investor who values stability with moderate growth expectations.
If you prioritize long-term value creation and expanding profitability, Trane Technologies outshines with superior capital efficiency and growth momentum. However, if you seek relative safety and income with less exposure to valuation risk, Carrier provides better stability despite weaker returns. Both profiles warrant cautious analysis given differing risk-reward dynamics.
Disclaimer: Investment carries a risk of loss of initial capital. The past performance is not a reliable indicator of future results. Be sure to understand risks before making an investment decision.
Go Further
I encourage you to read the complete analyses of Trane Technologies plc and Carrier Global Corporation to enhance your investment decisions: