Home > Comparison > Industrials > CARR vs MAS
The strategic rivalry between Carrier Global Corporation and Masco Corporation shapes the competitive landscape of the Industrials sector. Carrier operates as a diversified provider of HVAC, refrigeration, and fire & security technologies, while Masco specializes in home improvement and building products. This analysis explores their contrasting operational models and evaluates which company offers superior risk-adjusted returns for a diversified portfolio amid evolving market dynamics.
Table of contents
Companies Overview
Carrier Global Corporation and Masco Corporation both hold significant positions in the construction industry, shaping building environments worldwide.
Carrier Global Corporation: Global HVAC and Building Systems Leader
Carrier Global Corporation dominates the HVAC, refrigeration, and fire & security markets. It generates revenues through heating, cooling, ventilation products, and building automation services tailored for residential and commercial clients. In 2026, Carrier focuses strategically on integrating digital solutions and expanding its aftermarket services to enhance customer retention and operational efficiency.
Masco Corporation: Diverse Home Improvement Products Provider
Masco Corporation excels in designing and distributing plumbing and decorative architectural products across North America and Europe. It earns revenue via branded faucets, valves, paints, and lighting fixtures sold to wholesalers and retailers. The company’s 2026 strategy emphasizes product innovation and expanding its connected water and smart home offerings to capture evolving consumer preferences.
Strategic Collision: Similarities & Divergences
Both firms serve the construction sector but diverge in approach: Carrier operates a technology-driven, integrated systems model, while Masco pursues a broad product portfolio with strong brand diversification. They compete primarily in delivering solutions that enhance building functionality and aesthetics. Carrier offers a tech-heavy investment profile; Masco appeals through consumer-facing product breadth and steady brand equity.
Income Statement Comparison
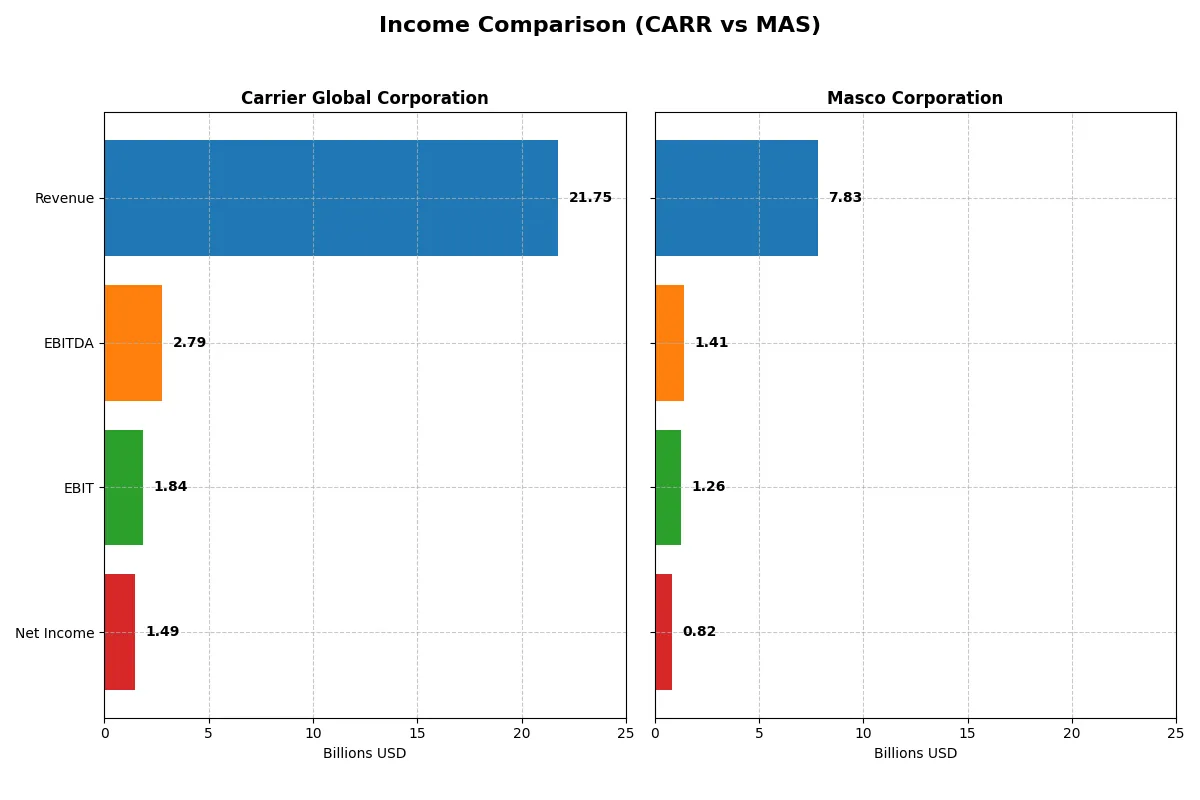
This data dissects the core profitability and scalability of both corporate engines to reveal who dominates the bottom line:
| Metric | Carrier Global Corporation (CARR) | Masco Corporation (MAS) |
|---|---|---|
| Revenue | 21.7B | 7.83B |
| Cost of Revenue | 16.1B | 5.0B |
| Operating Expenses | 3.48B | 1.47B |
| Gross Profit | 5.63B | 2.83B |
| EBITDA | 2.79B | 1.41B |
| EBIT | 1.84B | 1.26B |
| Interest Expense | 345M | 99M |
| Net Income | 1.49B | 822M |
| EPS | 1.74 | 3.77 |
| Fiscal Year | 2025 | 2024 |
Income Statement Analysis: The Bottom-Line Duel
This income statement comparison reveals which company runs the more efficient and profitable corporate engine in recent years.
Carrier Global Corporation Analysis
Carrier’s revenue grew modestly by 5.5% over five years but declined 3.3% last year to $21.7B. Gross margin stands at a favorable 25.9%, yet net income fell sharply by over 70% in 2025 to $1.48B. The shrinking EBIT margin of 8.5% signals weakening operational efficiency and profit momentum.
Masco Corporation Analysis
Masco posted a stable 8.9% revenue growth over five years, slipping 1.7% to $7.83B in 2024. Its gross margin of 36.2% and EBIT margin of 16.1% remain solidly favorable. Despite a 7.9% net margin decline last year, Masco’s net income at $822M reflects better overall profitability and operational discipline.
Margin Strength vs. Profit Scale
Masco delivers stronger margins and better operational efficiency, despite smaller scale and slower recent growth. Carrier boasts higher revenue but suffers marked net income erosion and margin contraction. For investors, Masco’s robust profitability profile appears more attractive than Carrier’s declining earnings momentum.
Financial Ratios Comparison
These vital ratios act as a diagnostic tool to expose the underlying fiscal health, valuation premiums, and capital efficiency of the companies compared below:
| Ratios | Carrier Global Corporation (CARR) | Masco Corporation (MAS) |
|---|---|---|
| ROE | 10.8% | -293.6% |
| ROIC | 5.8% | 29.3% |
| P/E | 29.7 | 19.2 |
| P/B | 3.21 | -56.5 |
| Current Ratio | 1.20 | 1.75 |
| Quick Ratio | 0.85 | 1.15 |
| D/E (Debt-to-Equity) | 0.92 | -11.5 |
| Debt-to-Assets | 34.1% | 64.1% |
| Interest Coverage | 6.23 | 13.77 |
| Asset Turnover | 0.58 | 1.56 |
| Fixed Asset Turnover | 5.86 | 5.81 |
| Payout Ratio | 51.7% | 30.9% |
| Dividend Yield | 1.74% | 1.61% |
| Fiscal Year | 2025 | 2024 |
Efficiency & Valuation Duel: The Vital Signs
Financial ratios act as a company’s DNA, unveiling hidden risks and operational excellence that drive investor decisions.
Carrier Global Corporation
Carrier shows neutral core profitability with a 10.8% ROE and a modest 6.9% net margin, indicating steady but unspectacular returns. The stock trades expensive with a 29.7 P/E and stretched valuation metrics. Carrier offers a 1.74% dividend yield, balancing shareholder returns with ongoing reinvestment in R&D at nearly 3% of revenue.
Masco Corporation
Masco delivers strong operational efficiency, boasting a 29.3% ROIC and a healthy 10.5% net margin. Its P/E of 19.25 suggests a fair valuation relative to peers. Despite a negative ROE due to accounting factors, Masco maintains robust cash flow and a 1.61% dividend yield, prioritizing stable payouts and disciplined capital allocation.
Valuation Discipline vs. Operational Strength
Masco offers a better balance of operational efficiency and valuation discipline, supporting sustainable returns with less risk. Carrier’s higher valuation demands caution given its moderate profitability. Growth-oriented investors may prefer Carrier’s R&D focus, while income-focused investors may lean toward Masco’s stable dividends.
Which one offers the Superior Shareholder Reward?
I compare Carrier Global Corporation (CARR) and Masco Corporation (MAS) on dividends, payout ratios, and buybacks. CARR yields 1.74% with a high payout ratio near 52%, supported by solid free cash flow coverage (~81%). MAS offers a higher yield at 1.61%, but with a lower payout ratio (~31%) and stronger free cash flow coverage (84%). Both emphasize buybacks; MAS’s consistent free cash flow per share (~4.16–5.2) supports more aggressive repurchases than CARR’s (~2.0–2.6). MAS’s leaner payout and robust buybacks suggest a more sustainable distribution strategy. In 2026, I favor MAS for a superior total return, blending income and capital return with prudent cash flow management.
Comparative Score Analysis: The Strategic Profile
The radar chart reveals the fundamental DNA and trade-offs of Carrier Global Corporation and Masco Corporation’s financial profiles:
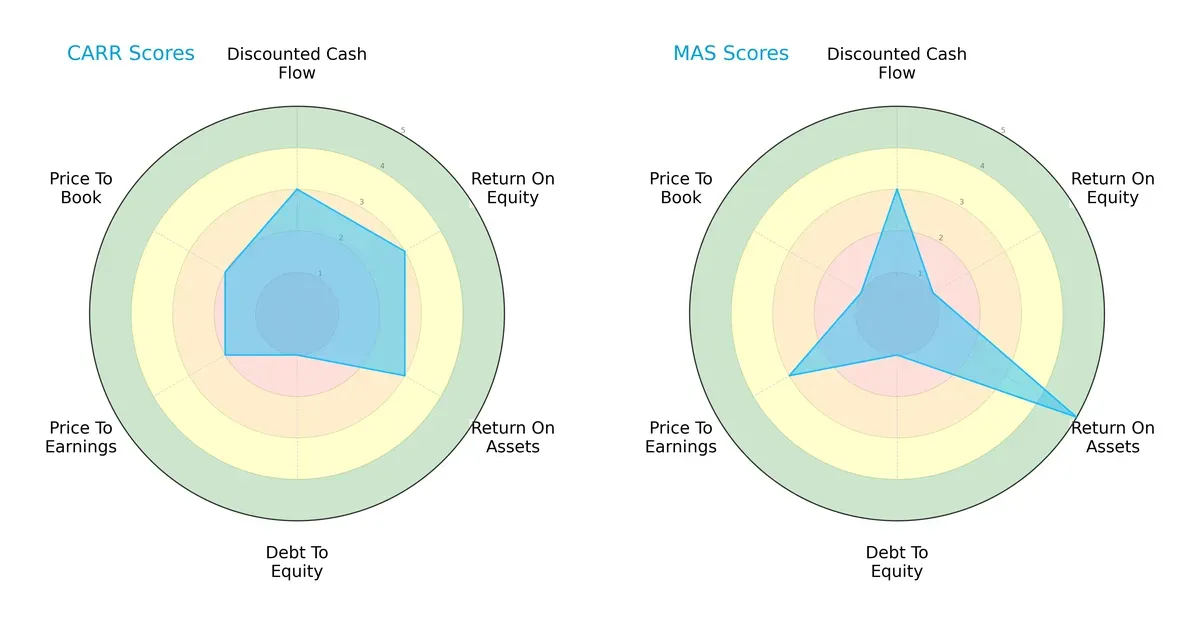
Carrier shows moderate strength in ROE and ROA, but a very unfavorable debt-to-equity score drags its balance down. Masco excels in ROA and offers better valuation via P/E, yet suffers poor ROE and price-to-book ratios. Overall, Carrier has a more balanced profile, while Masco relies heavily on asset efficiency.
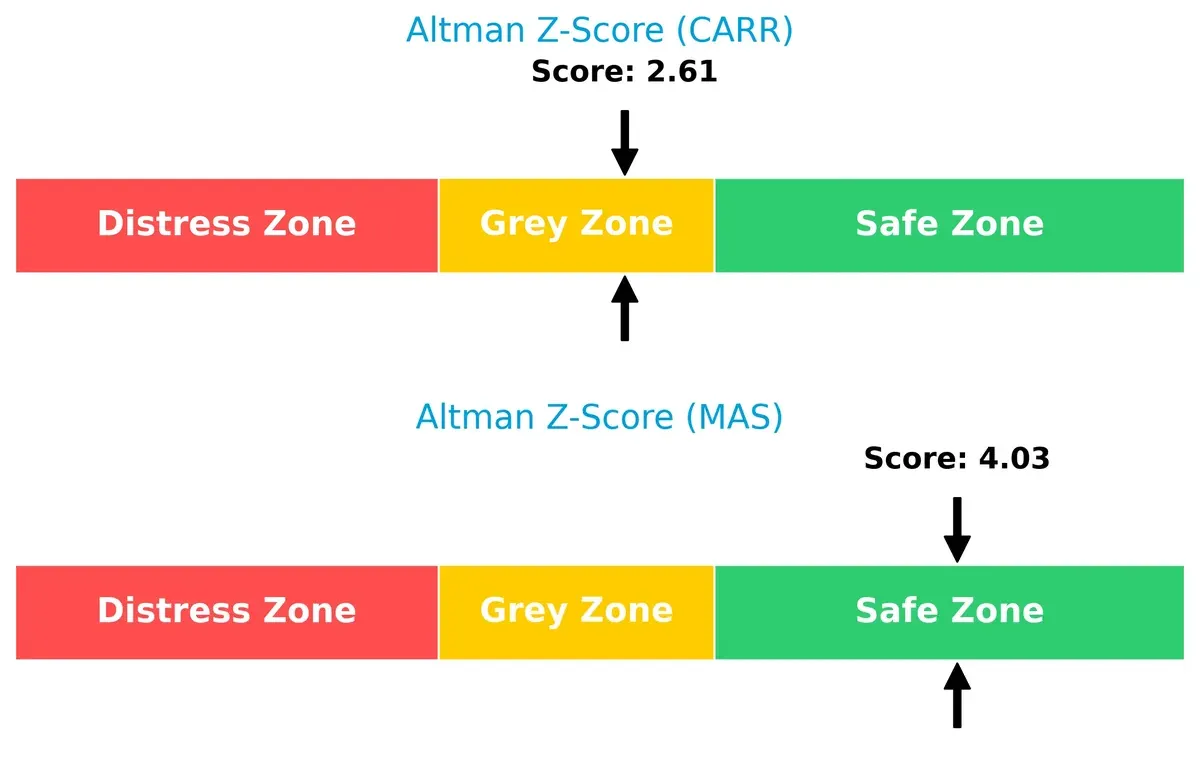
Bankruptcy Risk: Solvency Showdown
Masco’s Altman Z-Score of 4.03 places it firmly in the safe zone, signaling strong long-term solvency. Carrier, at 2.61, sits in the grey zone, indicating moderate bankruptcy risk in turbulent cycles:
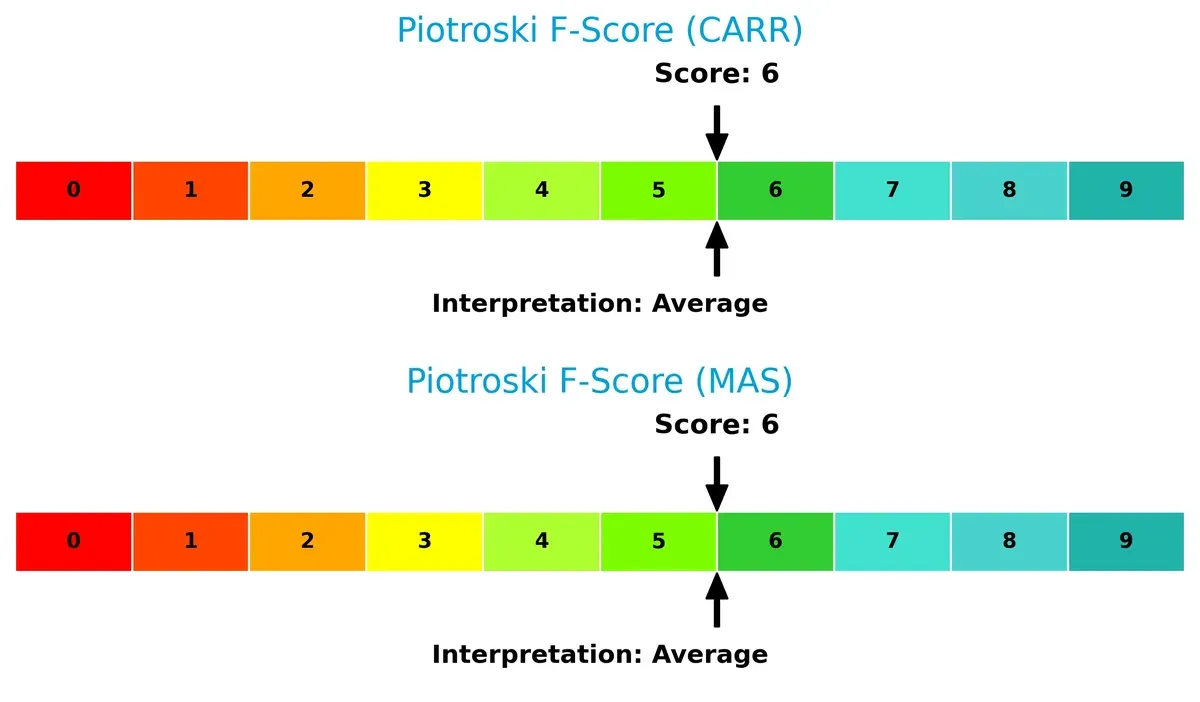
Financial Health: Quality of Operations
Both companies score a 6 on the Piotroski F-Score, reflecting average financial health. Neither shows acute red flags, but neither demonstrates peak operational strength either:
How are the two companies positioned?
This section dissects the operational DNA of Carrier and Masco by comparing their revenue distribution by segment and internal strengths and weaknesses. The goal is to confront their economic moats to reveal which business model delivers the most resilient, sustainable competitive advantage today.
Revenue Segmentation: The Strategic Mix
This visual comparison dissects how Carrier Global Corporation and Masco Corporation diversify their income streams and where their primary sector bets lie:
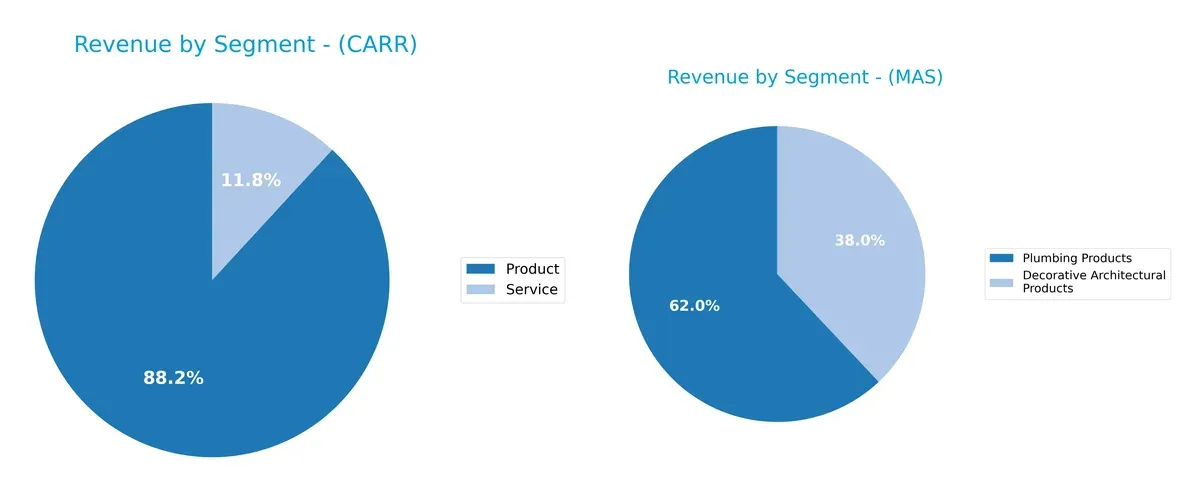
Carrier Global relies heavily on its Product segment, which dwarfs its Service revenue at $19.2B versus $2.6B in 2025. Masco shows a more balanced mix, with Plumbing Products anchoring $4.9B and Decorative Architectural Products contributing $3B in 2024. Carrier’s concentration signals infrastructure dominance but raises reliance risk. Masco’s diversified architecture reduces vulnerability and supports ecosystem lock-in across home improvement markets.
Strengths and Weaknesses Comparison
This table compares the Strengths and Weaknesses of Carrier Global Corporation and Masco Corporation:
Carrier Global Corporation Strengths
- Diverse revenue from products and services
- Strong US and European market presence
- Favorable interest coverage and fixed asset turnover ratios
Masco Corporation Strengths
- Higher net margin and ROIC
- Favorable liquidity ratios and asset turnover
- Strong North American presence with foreign market diversification
Carrier Global Corporation Weaknesses
- Neutral profitability with ROIC below WACC
- Unfavorable valuation multiples (PE and PB)
- Moderate diversification outside US
Masco Corporation Weaknesses
- Negative ROE indicating potential equity issues
- High debt to assets ratio
- Lower geographic diversification beyond North America
Carrier shows stable but neutral profitability and solid asset efficiency, relying heavily on the US market. Masco excels in profitability and liquidity but faces risks from high leverage and weak equity returns. Both companies exhibit distinct geographic and financial profiles affecting their strategic positioning.
The Moat Duel: Analyzing Competitive Defensibility
A structural moat is the only barrier protecting long-term profits from relentless competitive erosion. Let’s dissect these defenses in detail:
Carrier Global Corporation: Intangible Assets & Product Integration Moat
Carrier leverages its broad HVAC and fire/security product portfolio as a strong intangible asset moat. Yet, declining ROIC and shrinking margins signal eroding profitability in 2026. New digital building automation could deepen the moat if executed well.
Masco Corporation: Cost Advantage and Brand Portfolio Moat
Masco’s moat stems from a cost advantage and diversified home improvement brands. It sustains superior ROIC well above WACC, reflecting efficient capital use and margin resilience. Expansion into connected water products offers promising growth avenues in 2026.
Moat Battle: Intangible Assets vs. Cost Leadership and Brand Equity
Masco’s wider and growing moat clearly outmatches Carrier’s shrinking economic profit and declining ROIC. Masco is better positioned to defend and grow market share amid sector pressures.
Which stock offers better returns?
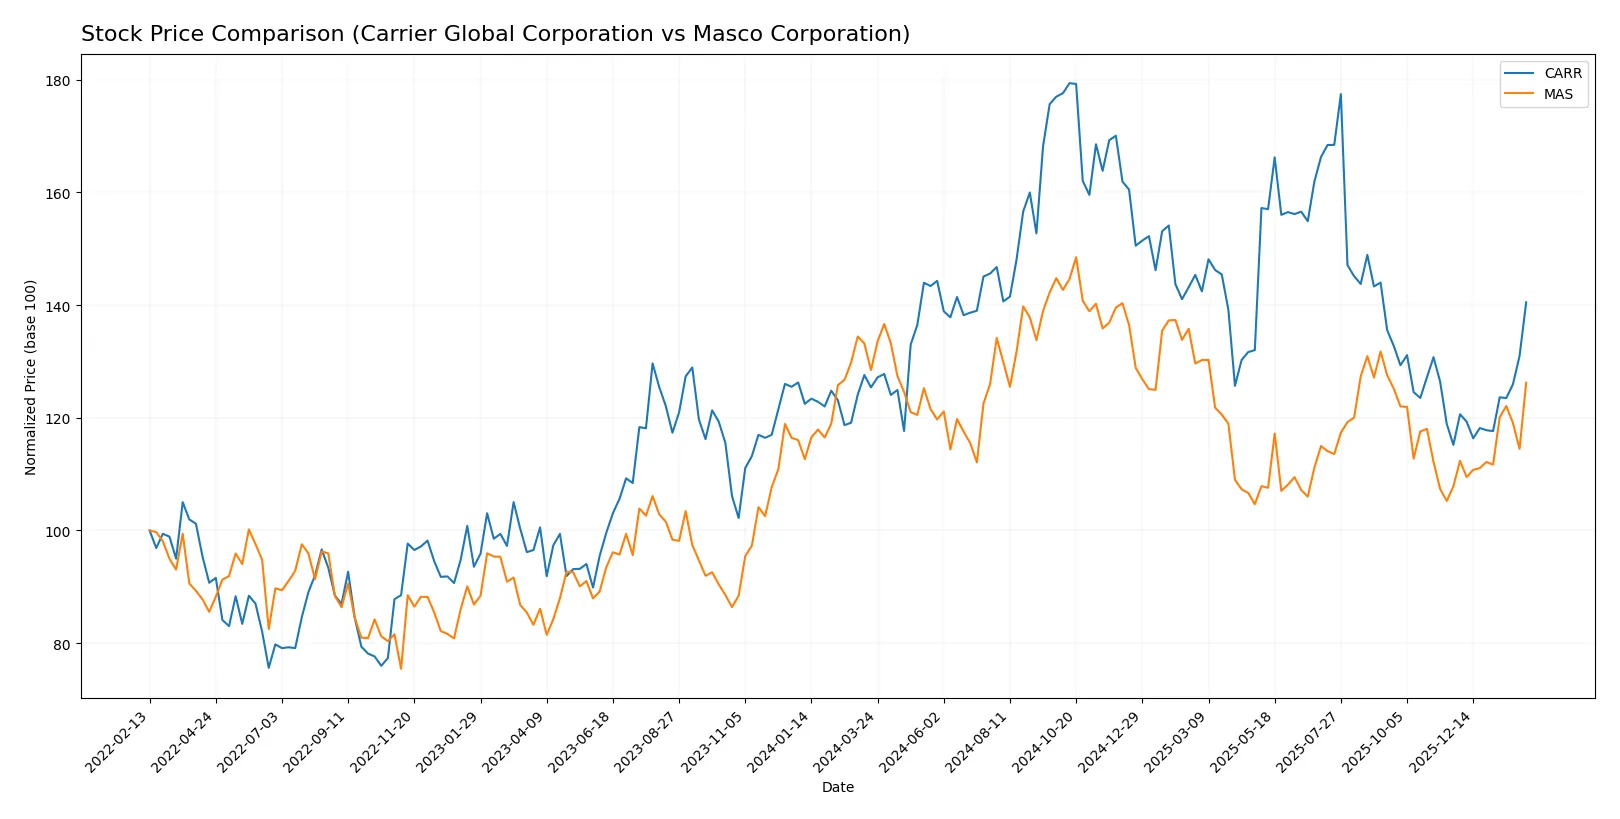
The past year showed clear divergence in price trends: Carrier Global’s stock advanced strongly, while Masco’s price declined marginally despite recent positive momentum.
Trend Comparison
Carrier Global’s stock rose 12.04% over the past 12 months, marking a bullish trend with accelerating gains and a price range between 52.41 and 81.61.
Masco’s stock fell 1.74% in the same period, signaling a bearish trend despite acceleration, with prices fluctuating from 60.42 to 85.71.
Carrier Global outperformed Masco overall, delivering the highest market returns during the past year based on price appreciation.
Target Prices
Analysts present a moderately bullish consensus for Carrier Global Corporation and Masco Corporation.
| Company | Target Low | Target High | Consensus |
|---|---|---|---|
| Carrier Global Corporation | 55 | 74 | 67.88 |
| Masco Corporation | 67 | 84 | 77 |
Carrier’s target consensus sits about 6% above its current price of 63.92, indicating modest upside. Masco shows a stronger potential gain with consensus nearly 6.5 points above its 72.87 price, reflecting more optimistic analyst sentiment.

Don’t Let Luck Decide Your Entry Point
Optimize your entry points with our advanced ProRealTime indicators. You’ll get efficient buy signals with precise price targets for maximum performance. Start outperforming now!
How do institutions grade them?
Carrier Global Corporation Grades
The following table summarizes recent grades from established grading firms for Carrier Global Corporation.
| Grading Company | Action | New Grade | Date |
|---|---|---|---|
| RBC Capital | maintain | Outperform | 2026-02-06 |
| Wells Fargo | maintain | Equal Weight | 2026-02-06 |
| Citigroup | maintain | Buy | 2026-02-06 |
| JP Morgan | maintain | Neutral | 2026-01-16 |
| Citigroup | maintain | Buy | 2026-01-12 |
| Mizuho | maintain | Outperform | 2026-01-05 |
| UBS | maintain | Buy | 2026-01-05 |
| Barclays | maintain | Overweight | 2025-12-10 |
| RBC Capital | maintain | Outperform | 2025-12-05 |
| Wells Fargo | maintain | Equal Weight | 2025-12-04 |
Masco Corporation Grades
The following table summarizes recent grades from established grading firms for Masco Corporation.
| Grading Company | Action | New Grade | Date |
|---|---|---|---|
| Wells Fargo | maintain | Overweight | 2026-01-14 |
| Citigroup | maintain | Neutral | 2026-01-08 |
| Wells Fargo | upgrade | Overweight | 2025-12-15 |
| Barclays | downgrade | Equal Weight | 2025-12-08 |
| Argus Research | maintain | Buy | 2025-11-05 |
| Barclays | maintain | Overweight | 2025-10-30 |
| Wells Fargo | maintain | Equal Weight | 2025-10-30 |
| UBS | maintain | Buy | 2025-10-30 |
| Evercore ISI Group | maintain | In Line | 2025-10-30 |
| RBC Capital | maintain | Sector Perform | 2025-10-30 |
Which company has the best grades?
Carrier Global receives consistently positive grades, with multiple “Buy” and “Outperform” ratings from top firms. Masco shows a mix of “Overweight,” “Buy,” and “Neutral” grades but also experienced recent downgrades. Carrier’s stronger consensus may signal higher institutional confidence.
Risks specific to each company
The following categories identify the critical pressure points and systemic threats facing both firms in the 2026 market environment:
1. Market & Competition
Carrier Global Corporation
- Operates in HVAC and refrigeration with strong brand presence but faces intense competition and technological disruption.
Masco Corporation
- Home improvement and plumbing products leader with broad brand portfolio facing competitive pricing and innovation pressures.
2. Capital Structure & Debt
Carrier Global Corporation
- Moderate debt-to-assets ratio at 34%, manageable interest coverage of 5.33, but debt-to-equity score flagged very unfavorable.
Masco Corporation
- High debt-to-assets at 64%, excellent interest coverage of 12.73, but debt-to-equity score also very unfavorable, indicating leverage risk.
3. Stock Volatility
Carrier Global Corporation
- Beta of 1.335 suggests above-market volatility, potentially increasing investor risk during downturns.
Masco Corporation
- Slightly lower beta at 1.285, indicating moderately high volatility but marginally less than Carrier.
4. Regulatory & Legal
Carrier Global Corporation
- Subject to building codes, environmental regulations, and product safety standards globally, with rising compliance costs.
Masco Corporation
- Faces regulatory hurdles in product safety, environmental laws, and international trade, with potential legal challenges in multiple jurisdictions.
5. Supply Chain & Operations
Carrier Global Corporation
- Relies on complex global supply chains for HVAC and refrigeration components, vulnerable to disruption and rising raw material costs.
Masco Corporation
- Supply chain exposed to raw material price volatility and logistical challenges, particularly in plumbing and decorative hardware segments.
6. ESG & Climate Transition
Carrier Global Corporation
- Increasing pressure to innovate energy-efficient HVAC systems aligned with climate goals, risking capital expenditure spikes.
Masco Corporation
- Faces ESG scrutiny on manufacturing emissions and sustainable product lines; must balance green investments with cost control.
7. Geopolitical Exposure
Carrier Global Corporation
- Global footprint exposes it to trade tensions, tariffs, and foreign policy shifts impacting supply chain and sales.
Masco Corporation
- Primarily North American focus reduces geopolitical risk but international operations still exposed to tariffs and trade policy changes.
Which company shows a better risk-adjusted profile?
Masco’s standout strengths include a favorable Altman Z-score in the safe zone and stronger profitability metrics, despite high leverage. Carrier’s moderate leverage and weaker debt metrics create caution. Carrier’s higher beta indicates more market risk. Both firms face operational and regulatory headwinds, but Masco’s superior capital efficiency and risk scores suggest a better risk-adjusted profile. Notably, Masco’s Altman Z-score of 4.03 signals robust financial stability versus Carrier’s grey zone 2.61, justifying my concern over Carrier’s leverage risks.
Final Verdict: Which stock to choose?
Carrier Global Corporation (CARR) excels as a cash generator with solid operational efficiency, particularly in asset turnover. Its main point of vigilance lies in its declining profitability trend and value destruction, signaling potential headwinds. CARR fits an aggressive growth portfolio willing to tolerate cyclical risks for upside.
Masco Corporation (MAS) stands out with a robust strategic moat, evidenced by its strong ROIC well above WACC and steadily improving profitability. Its financial safety profile surpasses CARR’s, offering more stable returns despite some leverage concerns. MAS aligns well with a GARP (Growth at a Reasonable Price) investor seeking quality and resilience.
If you prioritize dynamic growth and operational leverage, CARR is the compelling choice due to its cash flow strength despite profitability pressures. However, if you seek sustainable value creation with better stability, MAS offers superior capital efficiency and a durable competitive advantage, albeit with moderate leverage risks.
Disclaimer: Investment carries a risk of loss of initial capital. The past performance is not a reliable indicator of future results. Be sure to understand risks before making an investment decision.
Go Further
I encourage you to read the complete analyses of Carrier Global Corporation and Masco Corporation to enhance your investment decisions: