Home > Comparison > Industrials > CARR vs LII
The strategic rivalry between Carrier Global Corporation and Lennox International Inc. shapes the competitive landscape of the industrial construction sector. Carrier operates as a diversified provider of HVAC, refrigeration, and fire & security technologies, while Lennox focuses on specialized heating, cooling, and refrigeration solutions. This analysis examines their divergent business models to identify which offers superior risk-adjusted returns for a diversified portfolio amid evolving market demands.
Table of contents
Companies Overview
Carrier Global Corporation and Lennox International Inc. dominate the HVAC and refrigeration markets with distinct scale and strategies.
Carrier Global Corporation: Global HVAC and Building Automation Leader
Carrier Global Corporation specializes in heating, ventilation, air conditioning, and refrigeration solutions worldwide. Its core revenue derives from three segments: HVAC, Refrigeration, and Fire & Security, offering products and services spanning commercial and residential markets. In 2026, Carrier emphasizes expanding digital and building automation technologies to enhance operational efficiency and customer integration.
Lennox International Inc.: Premium Residential and Commercial HVAC Innovator
Lennox International Inc. focuses on residential and commercial heating, cooling, and refrigeration primarily in North America. It generates revenue through three segments targeting new construction and replacement markets. In 2026, Lennox prioritizes product innovation and service excellence, leveraging direct sales and distribution networks to strengthen market penetration.
Strategic Collision: Similarities & Divergences
Both companies compete in HVAC and refrigeration but diverge in scale and market reach—Carrier operates globally with a broader product mix, while Lennox concentrates on North America with premium offerings. Their battleground lies in commercial and residential HVAC solutions, battling for technological leadership and customer loyalty. Carrier’s diversified portfolio contrasts with Lennox’s focused specialization, shaping distinct risk and growth profiles for investors.
Income Statement Comparison
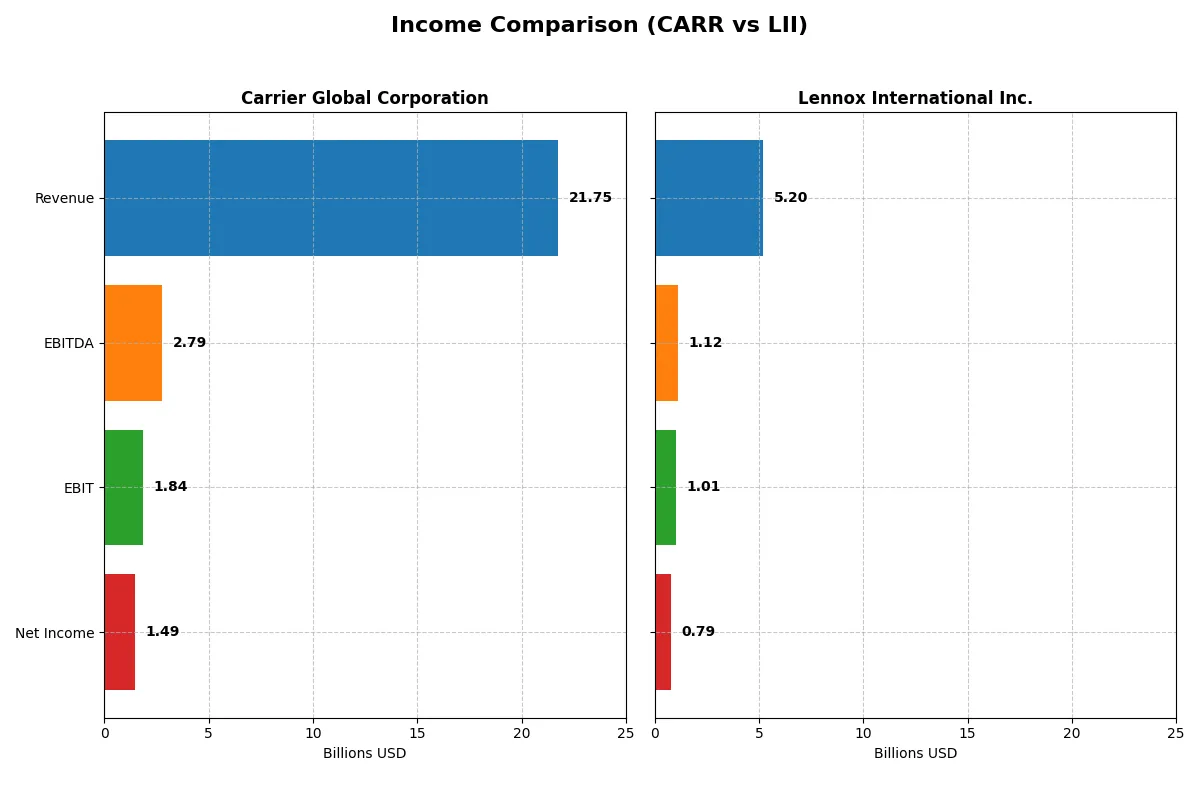
The following data dissects the core profitability and scalability of both corporate engines to reveal who dominates the bottom line:
| Metric | Carrier Global Corporation (CARR) | Lennox International Inc. (LII) |
|---|---|---|
| Revenue | 21.7B | 5.2B |
| Cost of Revenue | 16.1B | 3.5B |
| Operating Expenses | 3.5B | 700M |
| Gross Profit | 5.6B | 1.7B |
| EBITDA | 2.8B | 1.1B |
| EBIT | 1.8B | 1.0B |
| Interest Expense | 345M | 41M |
| Net Income | 1.5B | 786M |
| EPS | 1.74 | 22.31 |
| Fiscal Year | 2025 | 2025 |
Income Statement Analysis: The Bottom-Line Duel
This income statement comparison reveals which company runs a more efficient and profitable business engine through recent financial performance.
Carrier Global Corporation Analysis
Carrier’s revenue grew modestly by 5.5% from 2021 to 2025 but dipped 3.3% in 2025 alone. Gross margin remains favorable at 25.9%, yet net income declined by over 10% across five years. The latest year shows a sharp 72% drop in net margin and EPS, signaling weakened profitability and operational momentum.
Lennox International Inc. Analysis
Lennox achieved a strong 23.9% revenue increase over five years despite a slight 2.7% decline in 2025. Its gross margin of 33% and robust 19.5% EBIT margin highlight operational efficiency. Net income soared nearly 70% overall, with net margin and EPS growth reflecting sustained profitability and margin expansion in the latest period.
Margin Strength vs. Growth Resilience
Lennox outperforms Carrier with superior margins and consistent net income growth, demonstrating robust operational leverage. Carrier struggles with shrinking profitability despite scale. For investors, Lennox’s profile offers a more attractive combination of margin strength and earnings momentum.
Financial Ratios Comparison
These vital ratios act as a diagnostic tool to expose the underlying fiscal health, valuation premiums, and capital efficiency of the companies compared below:
| Ratios | Carrier Global Corporation (CARR) | Lennox International Inc. (LII) |
|---|---|---|
| ROE | 10.82% | 67.60% |
| ROIC | 5.84% | 25.51% |
| P/E | 29.7 | 21.56 |
| P/B | 3.21 | 14.57 |
| Current Ratio | 1.20 | 1.60 |
| Quick Ratio | 0.85 | 0.63 |
| D/E | 0.92 | 1.77 |
| Debt-to-Assets | 34.1% | 50.6% |
| Interest Coverage | 6.23 | 24.83 |
| Asset Turnover | 0.58 | 1.27 |
| Fixed Asset Turnover | 5.86 | 4.18 |
| Payout ratio | 51.7% | 22.0% |
| Dividend yield | 1.74% | 1.02% |
| Fiscal Year | 2025 | 2025 |
Efficiency & Valuation Duel: The Vital Signs
Ratios act as the company’s DNA, exposing hidden operational strengths and lurking risks behind stock prices.
Carrier Global Corporation
Carrier shows a neutral 10.82% ROE, signaling modest profitability, but its P/E of 29.7 marks the stock as stretched relative to earnings. Margins remain moderate at 6.87%, reflecting cautious efficiency. The 1.74% dividend yield offers steady shareholder returns, balancing reinvestment with modest income distribution.
Lennox International Inc.
Lennox delivers a powerful 67.6% ROE and a robust 15.13% net margin, demonstrating highly efficient operations. Its P/E of 21.56 appears reasonable, though a high P/B of 14.57 signals premium valuation. The 1.02% dividend yield complements strong reinvestment in growth, underscoring a confident capital allocation strategy.
Premium Valuation vs. Operational Safety
Lennox’s superior profitability and operational efficiency contrast with Carrier’s more modest returns but conservative valuation. Lennox offers greater reward but carries higher valuation risk. Carrier appeals to investors favoring stability and steady income. The choice hinges on appetite for growth versus risk management.
Which one offers the Superior Shareholder Reward?
I compare Carrier Global Corporation (CARR) and Lennox International Inc. (LII) on their shareholder return strategies. CARR offers a 1.74% dividend yield with a high 52% payout ratio, signaling income but limited reinvestment. Its buybacks are modest, reflecting cautious capital allocation amid moderate free cash flow (2.0/share). LII yields 1.02% with a 22% payout ratio, prioritizing growth through substantial buybacks and reinvestment of robust free cash flow (18.3/share). LII’s higher operating margins (19.5% vs. CARR’s 8.5%) and stronger free cash flow coverage underpin a more sustainable, growth-oriented distribution model. I find LII’s blend of dividends and aggressive buybacks offers superior total shareholder reward in 2026.
Comparative Score Analysis: The Strategic Profile
The radar chart reveals the fundamental DNA and trade-offs of Carrier Global Corporation and Lennox International Inc.:
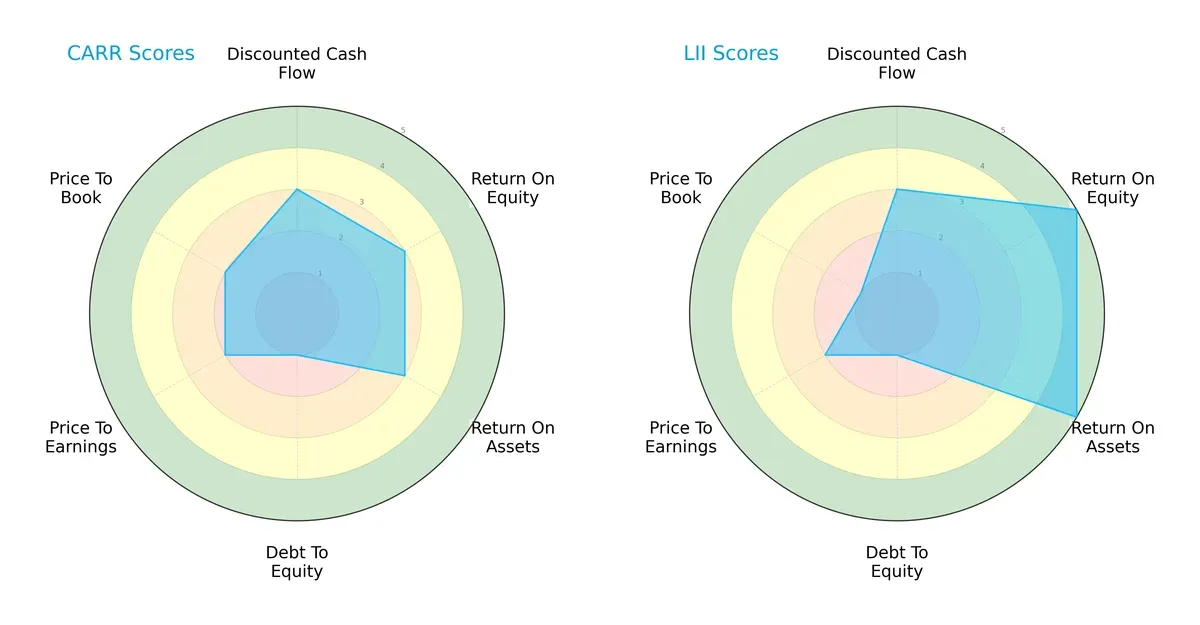
Lennox International shows a stronger operational efficiency with very favorable ROE and ROA scores (5 each) compared to Carrier’s moderate scores (3 each). Both firms share weak debt management (score 1), signaling balance sheet risk. Carrier displays a more balanced valuation profile (PE and PB scores at 2) versus Lennox’s more unfavorable valuation (PE 2, PB 1). Overall, Lennox leans on superior profitability, while Carrier offers a steadier valuation trade-off.
Bankruptcy Risk: Solvency Showdown
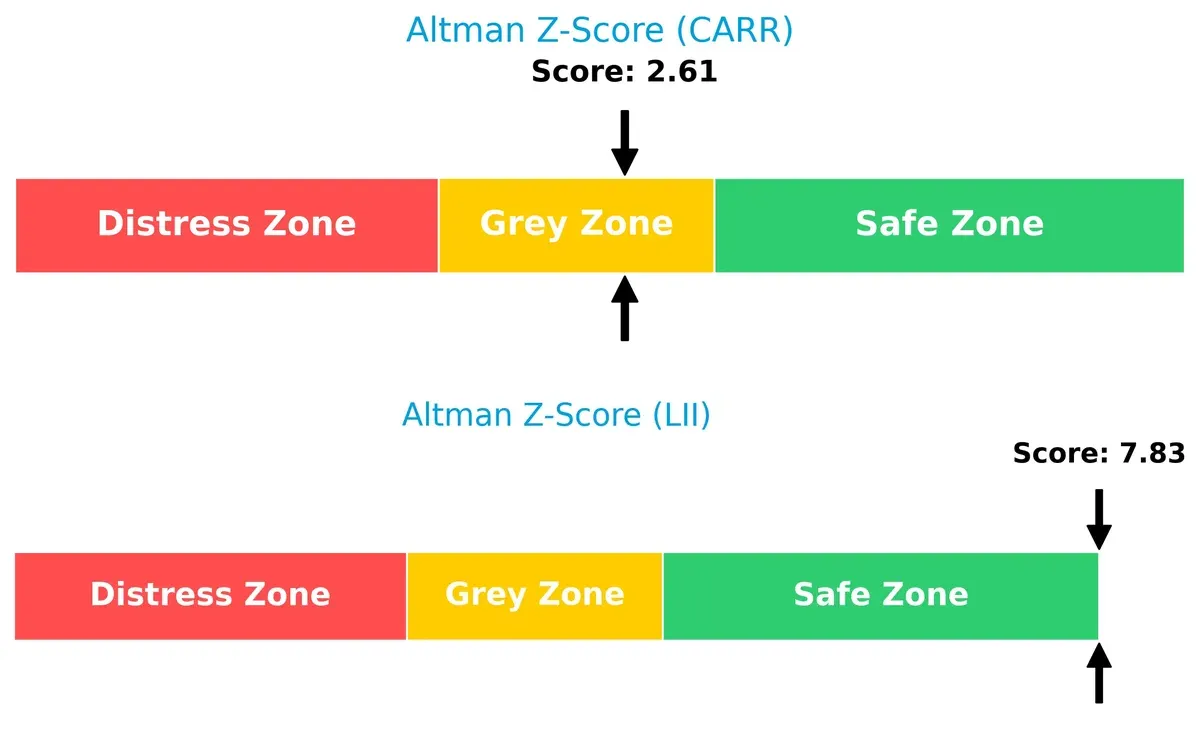
Lennox’s Altman Z-Score of 7.83 places it firmly in the safe zone, signaling robust solvency and low bankruptcy risk versus Carrier’s 2.61, which sits in the grey zone with moderate distress risk in this cycle:
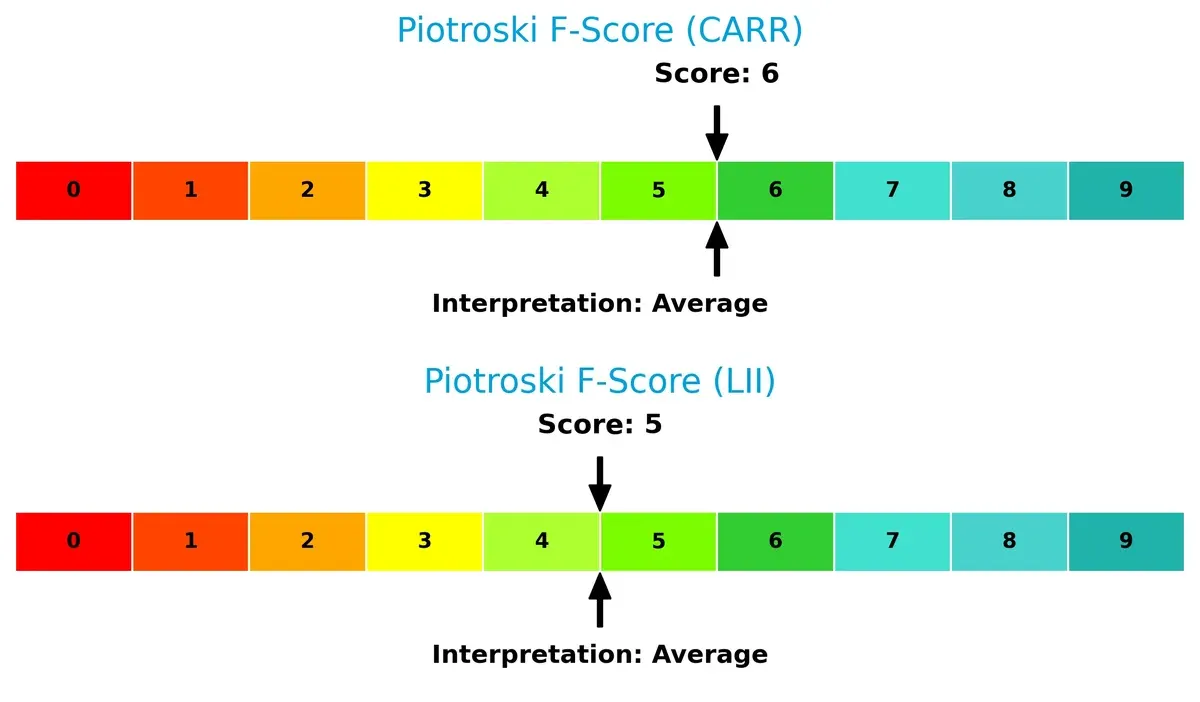
Financial Health: Quality of Operations
Carrier’s Piotroski F-Score of 6 slightly outperforms Lennox’s 5, indicating marginally stronger internal financial health. Neither firm exhibits critical red flags, but Carrier edges Lennox in operational quality metrics:
How are the two companies positioned?
This section dissects the operational DNA of Carrier and Lennox by comparing their revenue distribution and internal dynamics. The final objective is to confront their economic moats to identify which model offers the most resilient and sustainable advantage today.
Revenue Segmentation: The Strategic Mix
This visual comparison dissects how Carrier Global Corporation and Lennox International diversify income streams and reveals their primary sector bets:
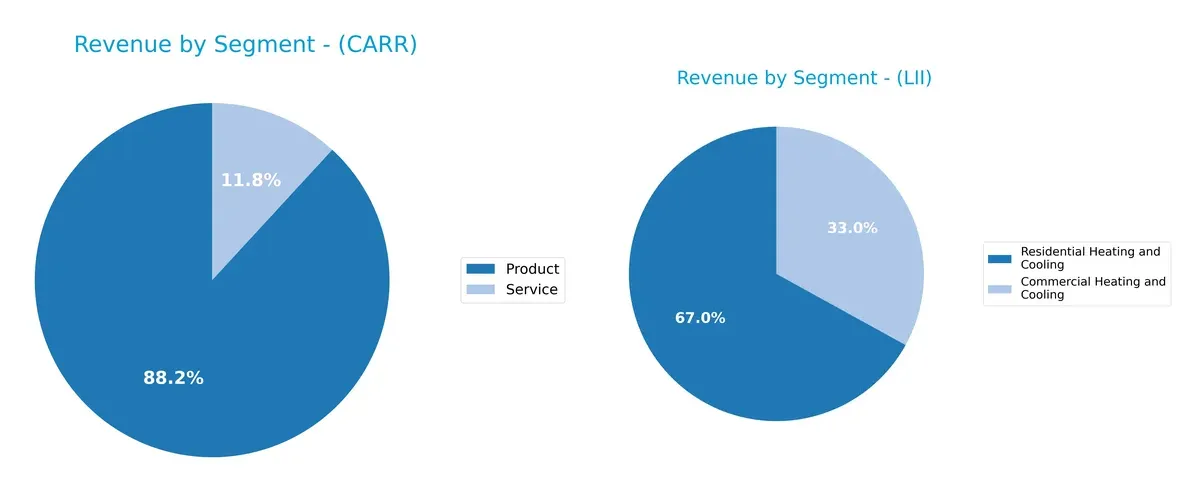
Carrier Global leans heavily on its Product segment, generating $19.2B in 2025, dwarfing its Service revenue of $2.57B. Lennox International shows a more balanced mix, anchoring $3.58B in Residential Heating and Cooling and $1.76B in Commercial Heating and Cooling. Carrier’s concentration signals a product-driven moat but risks market cyclicality. Lennox’s diversified heating and cooling focus mitigates risk, leveraging infrastructure demand across sectors.
Strengths and Weaknesses Comparison
This table compares the Strengths and Weaknesses of Carrier Global Corporation and Lennox International Inc.:
Carrier Strengths
- Diverse revenue streams from products and services
- Stable U.S. market with $11.1B revenue
- Favorable interest coverage and fixed asset turnover
Lennox Strengths
- High profitability with 15.13% net margin
- Strong ROE at 67.6% and ROIC at 25.51%
- Favorable current ratio and asset turnover
Carrier Weaknesses
- Neutral to unfavorable valuation metrics (PE 29.7, PB 3.21)
- Moderate liquidity ratios (current 1.2, quick 0.85)
- Neutral profitability metrics (ROE 10.82%, ROIC 5.84%)
Lennox Weaknesses
- High debt levels with D/E 1.77 and 50.57% debt-to-assets
- Unfavorable quick ratio at 0.63 and PB 14.57
- Limited international presence with minimal foreign revenue
Carrier exhibits stable diversification and financial stability but moderate profitability and valuation challenges. Lennox shows robust profitability and operational efficiency but carries higher leverage and weaker international diversification. These factors shape each company’s strategic focus on growth and risk management.
The Moat Duel: Analyzing Competitive Defensibility
A structural moat is the only shield preserving long-term profits from relentless competition erosion. Here’s how Carrier Global and Lennox International stack up:
Carrier Global Corporation: Intangible Assets and Scale Advantage
Carrier leans on its broad product portfolio and brand power across HVAC, refrigeration, and security. This translates into stable margins but declining ROIC signals weakening capital efficiency. New digital building automation could deepen its moat if executed well in 2026.
Lennox International Inc.: Cost Advantage with Operational Efficiency
Lennox boasts higher gross and net margins driven by superior cost controls and focused market segments. Its ROIC well above WACC shows efficient capital use, although a declining trend warns of margin pressure. Expansion in commercial HVAC and refrigeration markets offers growth potential.
Capital Efficiency vs. Scale and Brand Power
Lennox’s wider moat stems from consistent value creation and robust margins, whereas Carrier’s moat is shallower, with deteriorating returns. Lennox remains better positioned to defend market share amid rising cost pressures and competitive dynamics.
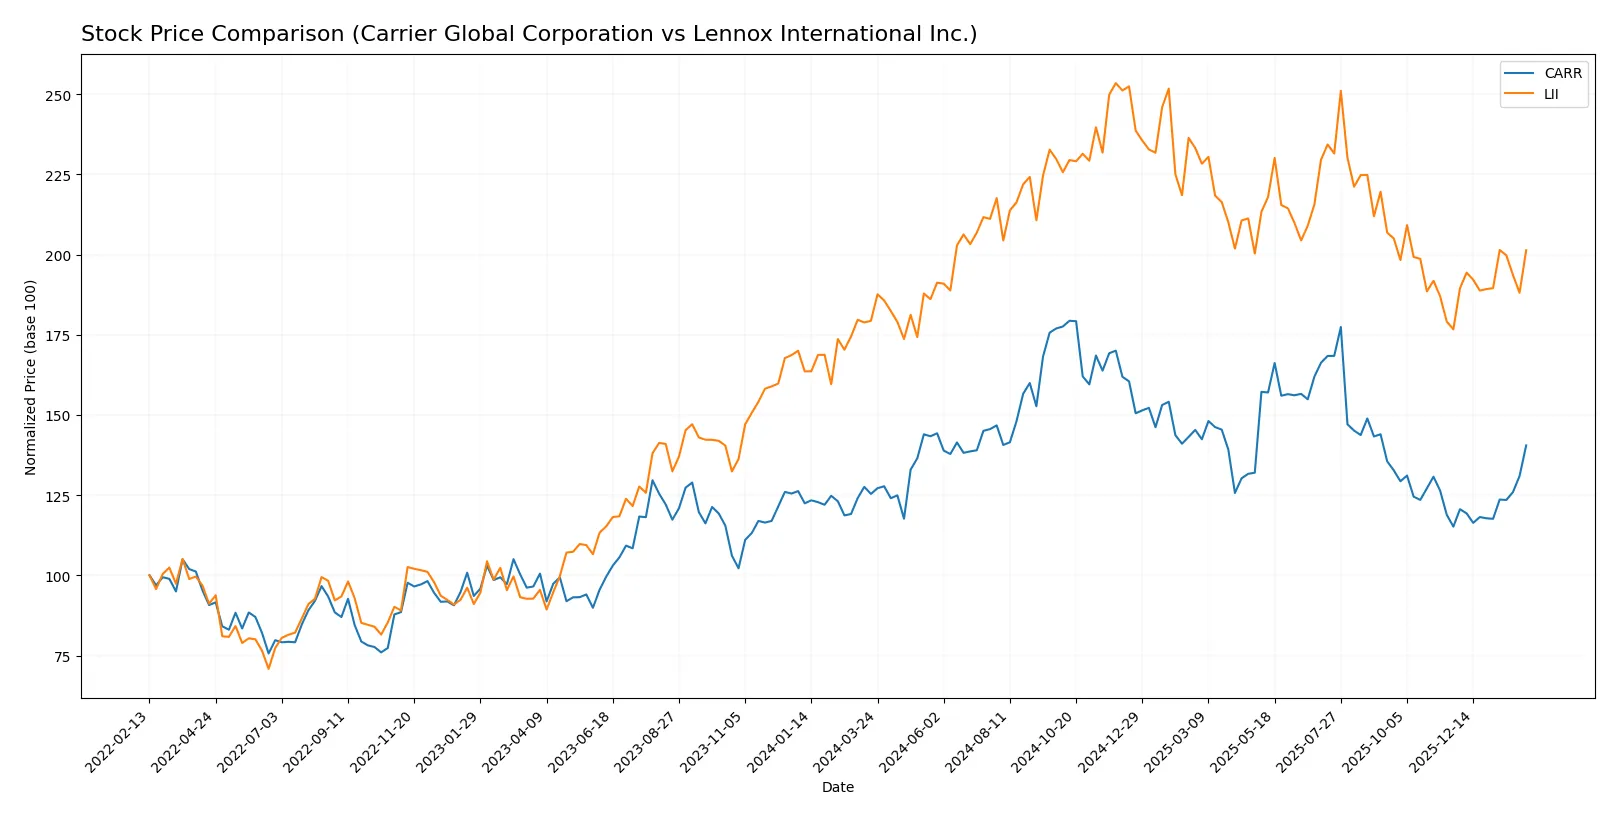
Which stock offers better returns?
Over the past year, both Carrier Global Corporation and Lennox International Inc. showed strong upward price momentum, with Carrier exhibiting steadier acceleration and Lennox facing higher volatility.
Trend Comparison
Carrier Global’s stock rose 12.04% over the past 12 months, showing a bullish trend with accelerating momentum and moderate volatility (7.59 std deviation). The price moved between 52.41 and 81.61.
Lennox International’s stock increased 12.26% over the same period, also bullish with acceleration but significantly higher volatility (53.16 std deviation). Its price ranged from 457.15 to 667.13.
Comparing both, Lennox slightly outperformed Carrier in total returns but with much greater volatility, indicating higher risk alongside potentially higher reward.
Target Prices
Analysts set a bullish consensus for Carrier Global Corporation and Lennox International Inc.
| Company | Target Low | Target High | Consensus |
|---|---|---|---|
| Carrier Global Corporation | 55 | 74 | 67.88 |
| Lennox International Inc. | 450 | 667 | 555 |
The consensus target for Carrier exceeds its current $63.92 price, signaling moderate upside. Lennox’s $555 target also surpasses the $529.96 market price, reflecting optimistic growth expectations.

Don’t Let Luck Decide Your Entry Point
Optimize your entry points with our advanced ProRealTime indicators. You’ll get efficient buy signals with precise price targets for maximum performance. Start outperforming now!
How do institutions grade them?
Here is a comparison of the latest institutional grades for Carrier Global Corporation and Lennox International Inc.:
Carrier Global Corporation Grades
The following table summarizes recent grades from major financial institutions for Carrier Global Corporation:
| Grading Company | Action | New Grade | Date |
|---|---|---|---|
| RBC Capital | Maintain | Outperform | 2026-02-06 |
| Wells Fargo | Maintain | Equal Weight | 2026-02-06 |
| Citigroup | Maintain | Buy | 2026-02-06 |
| JP Morgan | Maintain | Neutral | 2026-01-16 |
| Citigroup | Maintain | Buy | 2026-01-12 |
| Mizuho | Maintain | Outperform | 2026-01-05 |
| UBS | Maintain | Buy | 2026-01-05 |
| Barclays | Maintain | Overweight | 2025-12-10 |
| RBC Capital | Maintain | Outperform | 2025-12-05 |
| Wells Fargo | Maintain | Equal Weight | 2025-12-04 |
Lennox International Inc. Grades
The following table summarizes recent grades from major financial institutions for Lennox International Inc.:
| Grading Company | Action | New Grade | Date |
|---|---|---|---|
| Morgan Stanley | Maintain | Underweight | 2026-02-02 |
| Wells Fargo | Maintain | Equal Weight | 2026-01-29 |
| RBC Capital | Maintain | Sector Perform | 2026-01-29 |
| JP Morgan | Maintain | Underweight | 2026-01-16 |
| Barclays | Maintain | Overweight | 2026-01-07 |
| Barclays | Maintain | Overweight | 2025-12-11 |
| Wells Fargo | Maintain | Equal Weight | 2025-12-04 |
| Wolfe Research | Upgrade | Peer Perform | 2025-11-13 |
| UBS | Maintain | Neutral | 2025-10-27 |
| JP Morgan | Maintain | Underweight | 2025-10-23 |
Which company has the best grades?
Carrier Global Corporation consistently receives higher grades, including multiple “Outperform” and “Buy” ratings. Lennox International shows mixed ratings with several “Underweight” and “Equal Weight” grades. Investors may interpret Carrier’s stronger consensus as a sign of greater institutional confidence.
Risks specific to each company
The following categories identify critical pressure points and systemic threats facing both firms in the 2026 market environment:
1. Market & Competition
Carrier Global Corporation
- Faces intense competition in HVAC and building automation with moderate margin pressure.
Lennox International Inc.
- Benefits from strong market positioning and higher net margins, but faces aggressive pricing in commercial HVAC.
2. Capital Structure & Debt
Carrier Global Corporation
- Maintains moderate debt-to-assets (34%) with interest coverage at 5.33x, signaling manageable leverage.
Lennox International Inc.
- Exhibits higher leverage (debt-to-assets 50.6%, debt-to-equity 1.77) despite strong interest coverage (24.7x), raising financial risk concerns.
3. Stock Volatility
Carrier Global Corporation
- Beta at 1.335 indicates above-market volatility, reflecting sensitivity to sector cycles.
Lennox International Inc.
- Slightly lower beta of 1.188 suggests relatively less price volatility compared to Carrier.
4. Regulatory & Legal
Carrier Global Corporation
- Subject to global HVAC and refrigeration regulations, with exposure to building codes and environmental standards.
Lennox International Inc.
- Faces similar regulatory landscape, with additional scrutiny in commercial refrigeration and energy efficiency mandates.
5. Supply Chain & Operations
Carrier Global Corporation
- Operations rely on global supply chains vulnerable to disruptions; moderate asset turnover (0.58) reflects operational efficiency challenges.
Lennox International Inc.
- Higher asset turnover (1.27) indicates efficient operations but exposure to component cost inflation remains a risk.
6. ESG & Climate Transition
Carrier Global Corporation
- Increasing pressure to innovate in energy-efficient HVAC and refrigeration to meet climate goals.
Lennox International Inc.
- Stronger focus on sustainable products but must navigate transition risks in refrigerants and energy consumption.
7. Geopolitical Exposure
Carrier Global Corporation
- Global presence exposes Carrier to trade tensions and tariffs, notably in emerging markets.
Lennox International Inc.
- Primarily focused on North America but still faces geopolitical risks from supply chain dependencies abroad.
Which company shows a better risk-adjusted profile?
Lennox’s most significant risk is its elevated financial leverage, which amplifies vulnerability to interest rate hikes despite robust profitability. Carrier’s key risk centers on market volatility and operational efficiency amid competitive pressures. Overall, Lennox displays a slightly better risk-adjusted profile, supported by superior Altman Z-Score (7.8 vs. 2.6) and stronger profitability metrics. However, Carrier’s more conservative leverage provides a cushion against financial distress in turbulent markets.
Final Verdict: Which stock to choose?
Carrier Global Corporation’s superpower lies in its operational resilience and solid interest coverage, reflecting efficient management of debt costs. However, its shrinking profitability and value-destroying capital returns remain points of vigilance. Carrier fits best in portfolios seeking steady income with moderate growth exposure.
Lennox International Inc. commands a strategic moat through superior returns on invested capital and a robust operating margin, signaling strong competitive positioning. Despite higher leverage risks, its consistent value creation and profitability offer better stability than Carrier. Lennox suits investors aiming for growth with reasonable safety margins.
If you prioritize operational efficiency and income stability, Carrier presents a compelling scenario, albeit with caution on its declining ROIC. However, if you seek growth backed by a credible economic moat and stronger earnings performance, Lennox outshines as the more resilient choice. Both require careful risk assessment aligned with your investment strategy.
Disclaimer: Investment carries a risk of loss of initial capital. The past performance is not a reliable indicator of future results. Be sure to understand risks before making an investment decision.
Go Further
I encourage you to read the complete analyses of Carrier Global Corporation and Lennox International Inc. to enhance your investment decisions: