Home > Comparison > Industrials > JCI vs CARR
The strategic rivalry between Johnson Controls International plc and Carrier Global Corporation shapes the global industrial construction sector. Johnson Controls operates as a diversified building systems and smart solutions provider, while Carrier focuses on HVAC, refrigeration, and fire & security technologies. This head-to-head contrasts a broad industrial conglomerate against a specialized technology leader. This analysis aims to identify which company offers a superior risk-adjusted return for investors seeking durable exposure in industrials.
Table of contents
Companies Overview
Johnson Controls International plc and Carrier Global Corporation stand as pivotal players in the global building technology sector.
Johnson Controls International plc: Global Building Technology Leader
Johnson Controls dominates the building solutions market, generating revenue through engineering, manufacturing, and servicing HVAC, security, and fire protection systems. Its core revenue engine includes integrated electronic security and energy efficiency solutions. In 2026, the company strategically focuses on expanding smart building technologies and retrofitting non-residential facilities worldwide.
Carrier Global Corporation: HVAC and Refrigeration Specialist
Carrier Global Corporation excels in HVAC, refrigeration, and fire & security technologies, serving residential and commercial clients globally. Its primary revenue driver comes from HVAC products and aftermarket services, including building automation solutions. In 2026, Carrier prioritizes digital refrigeration and integrated fire and security systems to enhance operational efficiency and customer value.
Strategic Collision: Similarities & Divergences
Both companies compete fiercely in HVAC and building automation but differ in scope and strategy. Johnson Controls pursues a broad integrated solutions approach across multiple building systems, while Carrier focuses on specialized HVAC and refrigeration innovation. Their market battle centers on smart building technologies and energy efficiency. These distinctions create contrasting investment profiles: Johnson Controls offers diversified exposure, whereas Carrier presents targeted growth in HVAC and refrigeration niches.
Income Statement Comparison
This data dissects the core profitability and scalability of both corporate engines to reveal who dominates the bottom line:
| Metric | Johnson Controls International plc (JCI) | Carrier Global Corporation (CARR) |
|---|---|---|
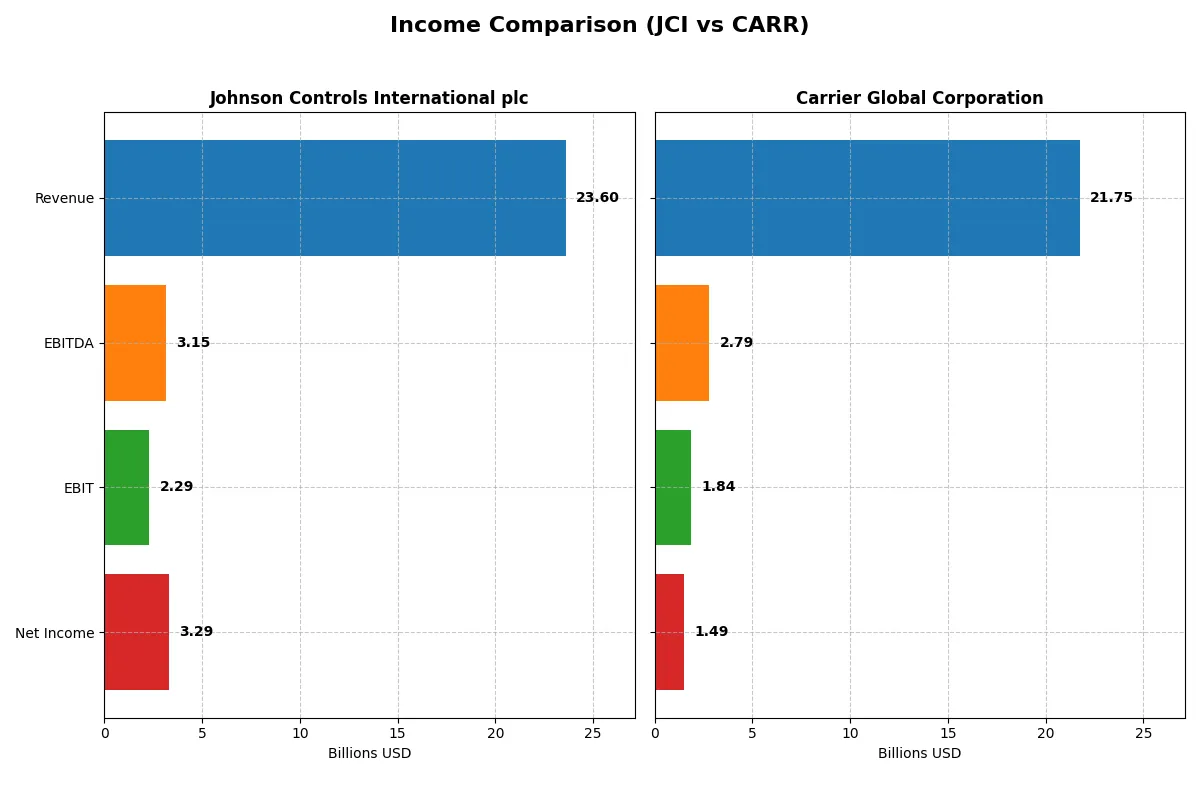
| Revenue | 23.6B | 21.7B |
| Cost of Revenue | 15.0B | 16.1B |
| Operating Expenses | 5.8B | 3.5B |
| Gross Profit | 8.6B | 5.6B |
| EBITDA | 3.2B | 2.8B |
| EBIT | 2.3B | 1.8B |
| Interest Expense | 157M | 345M |
| Net Income | 3.3B | 1.5B |
| EPS | 2.64 | 1.74 |
| Fiscal Year | 2025 | 2025 |
Income Statement Analysis: The Bottom-Line Duel
This income statement comparison reveals which company converts revenue into profits more efficiently, exposing the core strength of their business models.
Johnson Controls International plc Analysis
Johnson Controls grew revenue modestly from 2024 to 2025, reaching $23.6B. Gross margin remains strong at 36.4%, while net margin improved to nearly 14%. The company’s net income more than doubled over five years, signaling robust margin expansion and operational efficiency gains in 2025.
Carrier Global Corporation Analysis
Carrier’s revenue declined by 3.3% in 2025 to $21.7B, with gross margin slipping to 25.9%. Net margin fell sharply to 6.9%, reflecting weaker profitability and cost pressures. Net income dropped over 10% across the period, highlighting challenges in sustaining earnings momentum.
Margin Power vs. Revenue Scale
Johnson Controls demonstrates superior margin strength and consistent net income growth, while Carrier struggles with shrinking profitability despite a similar revenue scale. Johnson Controls’ profile offers investors a clearer path to sustainable profits, making it the more fundamentally resilient business based on current income statement trends.
Financial Ratios Comparison
These vital ratios act as a diagnostic tool to expose the underlying fiscal health, valuation premiums, and capital efficiency of the companies compared below:
| Ratios | Johnson Controls International plc (JCI) | Carrier Global Corporation (CARR) |
|---|---|---|
| ROE | 25.5% | 10.8% |
| ROIC | 8.7% | 5.8% |
| P/E | 21.8 | 29.7 |
| P/B | 5.54 | 3.21 |
| Current Ratio | 0.93 | 1.20 |
| Quick Ratio | 0.76 | 0.85 |
| D/E | 0.87 | 0.92 |
| Debt-to-Assets | 29.5% | 34.1% |
| Interest Coverage | 18.0 | 6.2 |
| Asset Turnover | 0.62 | 0.58 |
| Fixed Asset Turnover | 10.8 | 5.86 |
| Payout ratio | 29.7% | 51.7% |
| Dividend yield | 1.36% | 1.74% |
| Fiscal Year | 2025 | 2025 |
Efficiency & Valuation Duel: The Vital Signs
Financial ratios act as a company’s DNA, unveiling hidden risks and operational efficiency that shape investor confidence.
Johnson Controls International plc
Johnson Controls posts a robust 25.5% ROE and a healthy 13.95% net margin, signaling strong profitability. Its P/E at 21.8 is fairly valued, but a high P/B of 5.54 raises caution. The 1.36% dividend yield offers steady shareholder returns, balancing reinvestment in R&D at 1.16% of revenue.
Carrier Global Corporation
Carrier’s profitability is more muted, with a 10.8% ROE and 6.87% net margin, indicating moderate efficiency. The stock trades at a stretched P/E of 29.7, while its P/B of 3.21 is less concerning. A 1.74% dividend yield provides income, complemented by a higher R&D spend of 2.87%, supporting future growth.
Valuation Discipline vs. Growth Orientation
Johnson Controls combines superior profitability with reasonable valuation and consistent dividends, presenting a balanced risk-reward profile. Carrier’s higher valuation and growth-focused capital allocation appeal to investors prioritizing expansion over value. Each fits distinct investor appetites: value-seekers lean toward Johnson Controls, growth-oriented investors may prefer Carrier.
Which one offers the Superior Shareholder Reward?
I observe Johnson Controls (JCI) maintains a consistent dividend yield around 1.9% with a payout ratio near 59%, supported by robust free cash flow coverage (~70%). Their buyback program strengthens total returns steadily. Carrier Global (CARR) offers a lower dividend yield (~1.7%) with a conservative payout (~52%) but shows erratic free cash flow support and a weaker buyback intensity. JCI’s balanced distribution strategy delivers more sustainable, long-term value creation. I conclude JCI offers the superior total shareholder reward in 2026.
Comparative Score Analysis: The Strategic Profile
The radar chart reveals the fundamental DNA and trade-offs of Johnson Controls International and Carrier Global, highlighting their financial strengths and weaknesses:
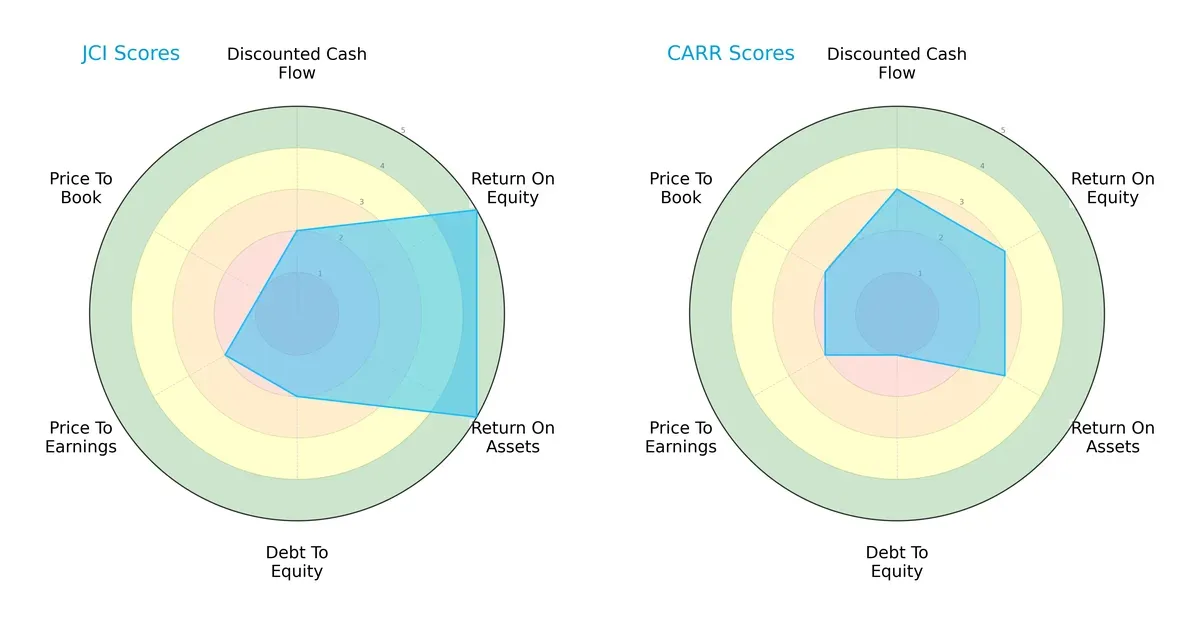
Johnson Controls (JCI) excels in profitability with very favorable ROE and ROA scores (5 each), while Carrier (CARR) scores moderately in these areas (3 each). JCI struggles with valuation metrics, showing very unfavorable P/B (1) and unfavorable P/E (2) scores, whereas CARR presents slightly better valuation scores. Debt management is a clear weakness for both, but CARR’s debt-to-equity score (1) is worse than JCI’s (2). Overall, JCI offers a more balanced profile driven by strong operational efficiency, while CARR relies more on moderate cash flow and valuation metrics.
Bankruptcy Risk: Solvency Showdown
The Altman Z-Score places both firms in the grey zone, indicating moderate bankruptcy risk in this cycle:
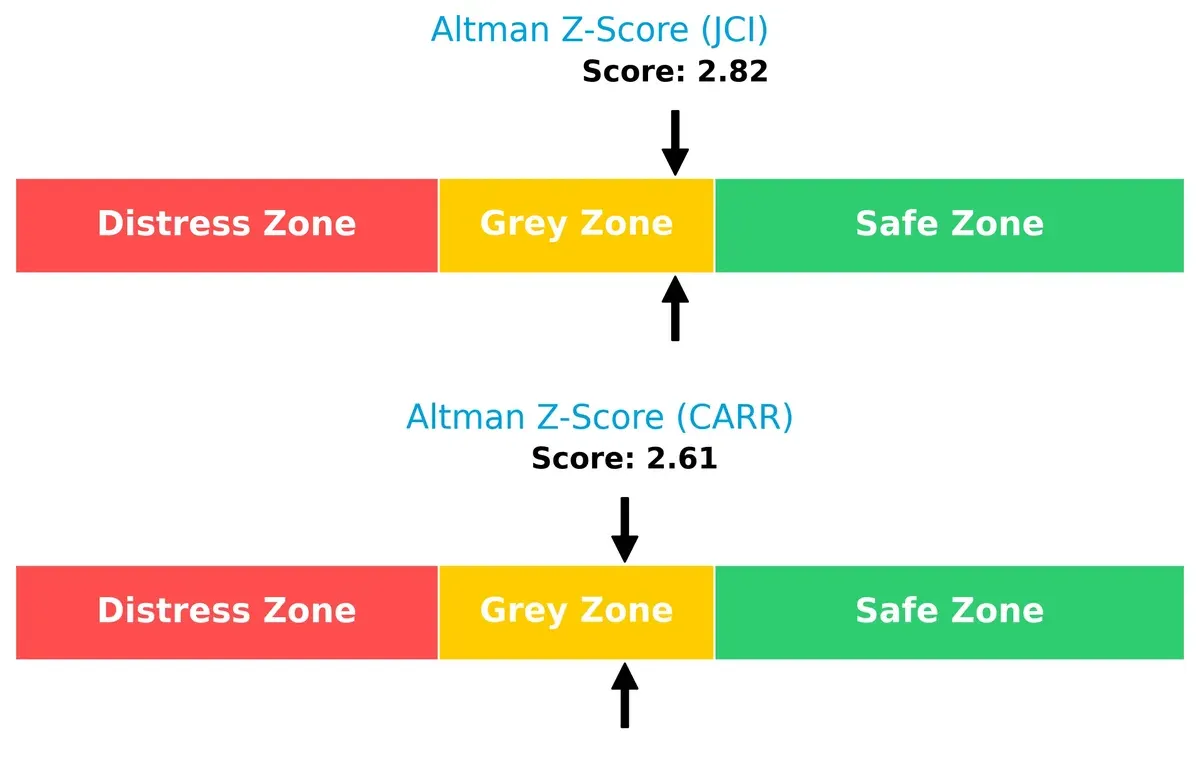
JCI’s score of 2.82 slightly outperforms CARR’s 2.61, suggesting marginally better financial stability. Neither company is in the safe zone, so prudent risk monitoring remains crucial.
Financial Health: Quality of Operations
Both Johnson Controls and Carrier share identical Piotroski F-Scores of 6, reflecting average financial health:
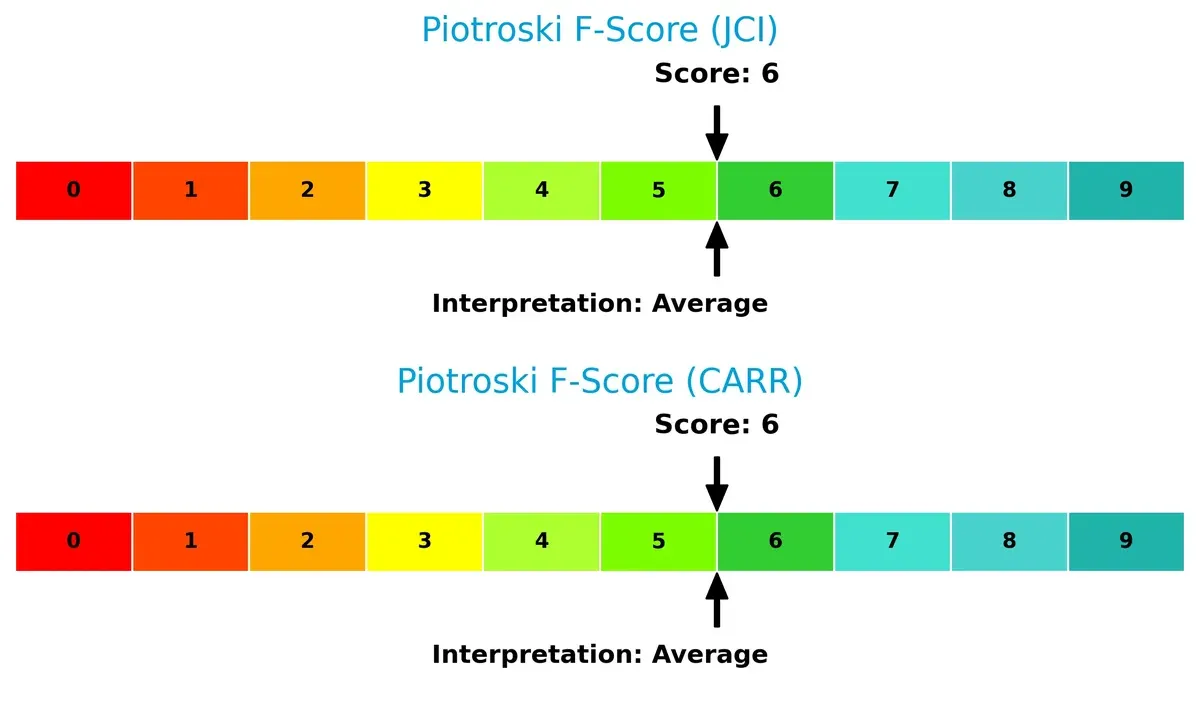
This score signals stable operations without red flags but also indicates room for improvement in profitability and efficiency metrics. Investors should watch for operational enhancements to elevate these scores.
How are the two companies positioned?
This section dissects the operational DNA of JCI and CARR by comparing their revenue distribution and internal dynamics. The goal is to confront their economic moats and identify which model offers the most resilient, sustainable competitive edge today.
Revenue Segmentation: The Strategic Mix
This visual comparison dissects how Johnson Controls International and Carrier Global diversify their income streams and where their primary sector bets lie:
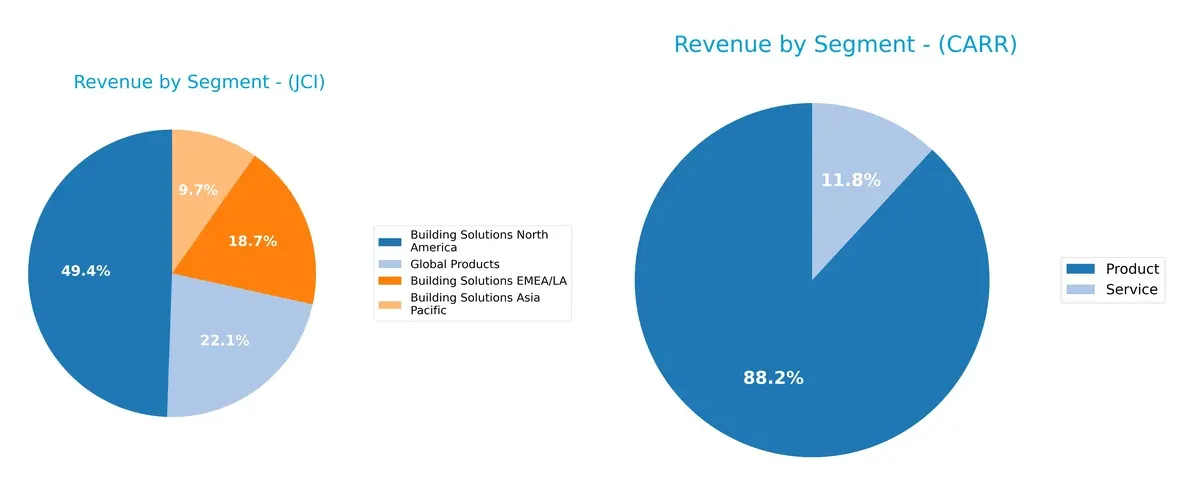
Johnson Controls International anchors its revenue in Building Solutions North America at $11.3B, with balanced contributions from EMEA/LA ($4.3B), Asia Pacific ($2.2B), and Global Products ($5.1B). Carrier Global, by contrast, pivots heavily on Products, generating $19.9B versus $2.5B in Services. Johnson Controls shows a more diversified mix across regions and segments, reducing concentration risk. Carrier’s dominance in Products highlights infrastructure scale but raises dependency concerns amid market shifts.
Strengths and Weaknesses Comparison
This table compares the strengths and weaknesses of Johnson Controls International plc (JCI) and Carrier Global Corporation (CARR):
JCI Strengths
- Higher net margin at 13.95% indicating stronger profitability
- ROE at 25.46% shows efficient equity use
- Favorable interest coverage at 14.57 supports debt service
- Diverse global presence with significant revenues in Asia Pacific, EMEA, and North America
- Strong fixed asset turnover at 10.76 suggests efficient asset use
CARR Strengths
- Stable interest coverage at 5.33 ensures manageable debt expenses
- Balanced current ratio at 1.2 indicates adequate short-term liquidity
- Global footprint with notable revenues in US, Europe, and Asia Pacific
- Favorable fixed asset turnover at 5.86 reflects asset utilization
- Consistent dividend yield at 1.74% appeals to income investors
JCI Weaknesses
- Current and quick ratios below 1, signaling liquidity concerns
- Price-to-book at 5.54 indicates possible overvaluation risk
- ROIC at 8.68% slightly below WACC at 9.72%, questioning capital efficiency
- Asset turnover moderate at 0.62, limiting revenue generation from assets
CARR Weaknesses
- Lower net margin at 6.87% reduces profitability buffer
- ROE at 10.82% is modest for industry standards
- High P/E ratio at 29.7 may reflect overvaluation
- Debt to assets at 34.07% higher, increasing financial risk
Both companies operate globally with solid market shares but differ in profitability and liquidity profiles. JCI’s strong profitability contrasts with liquidity weaknesses, while CARR maintains balanced liquidity but faces pressure on margins and valuation. These factors shape their strategic priorities in capital allocation and operational efficiency.
The Moat Duel: Analyzing Competitive Defensibility
A structural moat is the only reliable shield protecting long-term profits from relentless competitive erosion. Let’s dissect the moats of two industry leaders:
Johnson Controls International plc (JCI): Integrated Building Solutions Moat
JCI leverages intangible assets and integrated smart building solutions to maintain steady margins and rising profitability. Despite shedding value versus WACC, its 55% ROIC growth signals improving capital efficiency. New energy management technologies could deepen this moat in 2026.
Carrier Global Corporation (CARR): HVAC and Refrigeration Scale Moat
CARR’s moat hinges on cost advantages and scale in HVAC and refrigeration markets. Unlike JCI, it shows declining ROIC and shrinking margins, reflecting value destruction. Expansion into digital monitoring offers upside, but recent financials warn of competitive pressure.
Verdict: Integration Depth vs. Scale Efficiency
JCI’s improving profitability and innovation-driven moat appear wider and more sustainable than CARR’s shrinking cost advantage. I see JCI better positioned to defend and grow its market share through technology and service integration.
Which stock offers better returns?
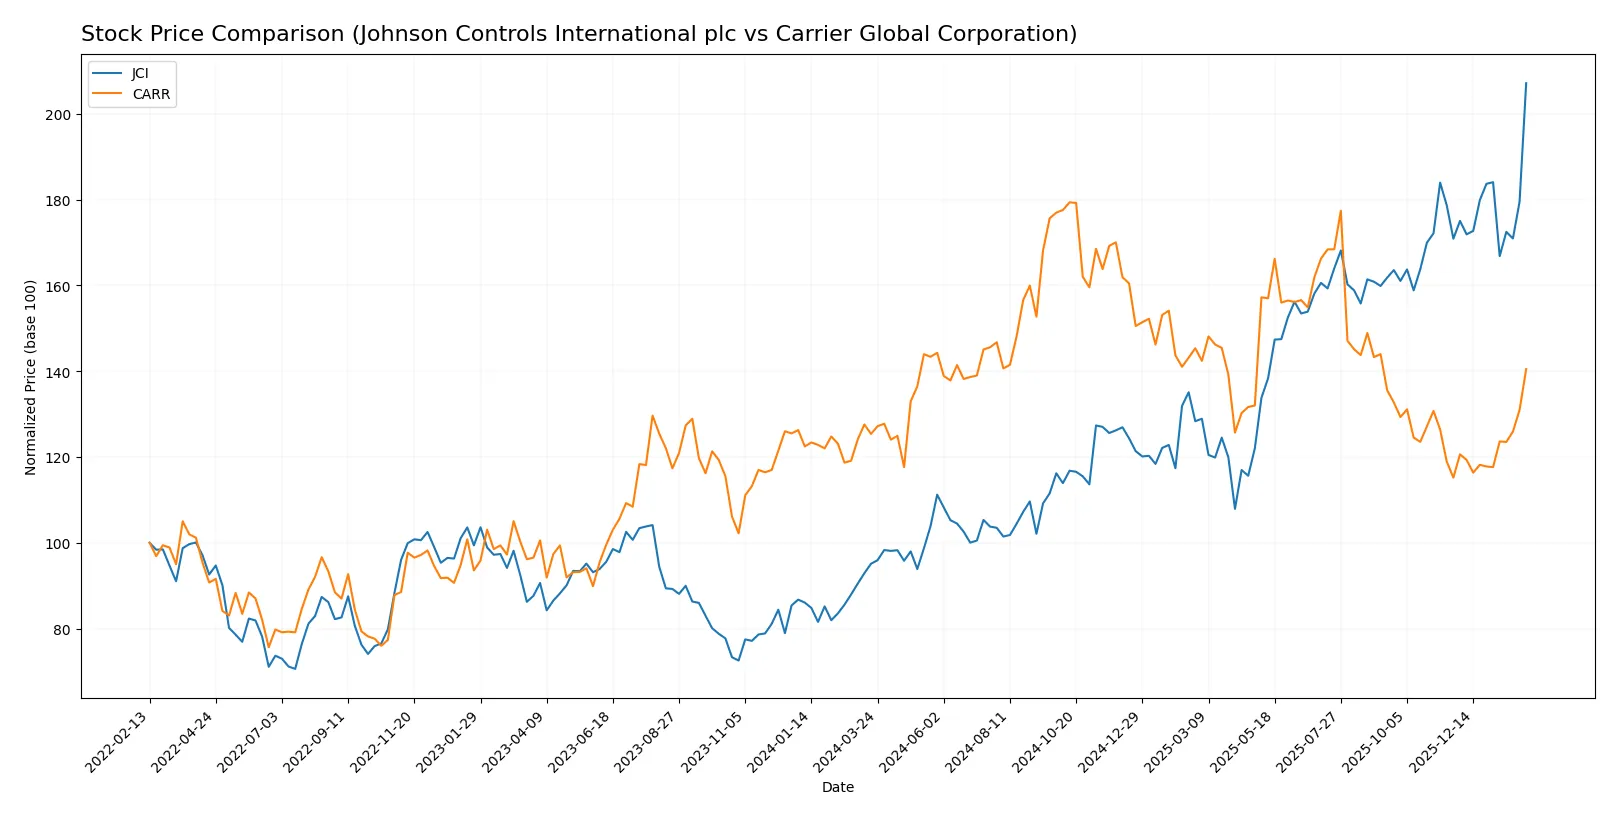
The past year shows Johnson Controls International and Carrier Global both gaining ground, with Johnson Controls exhibiting a stronger price surge and notable acceleration in momentum.
Trend Comparison
Johnson Controls International’s stock rose 117.84% over the past 12 months, reflecting a bullish trend with accelerating momentum and a high volatility level of 18.89%. It reached a peak price of 137.65.
Carrier Global’s stock gained 12.04% over the same period, also bullish with acceleration but lower volatility at 7.59%. Its highest price was 81.61, indicating steadier growth.
Johnson Controls outperformed Carrier Global by a wide margin, delivering the highest market return with more pronounced price gains and stronger acceleration.
Target Prices
Analysts present a moderate upside for Johnson Controls International plc and Carrier Global Corporation, reflecting steady confidence in their industrial sector positioning.
| Company | Target Low | Target High | Consensus |
|---|---|---|---|
| Johnson Controls International plc | 124 | 154 | 136.75 |
| Carrier Global Corporation | 55 | 74 | 67.88 |
The consensus target for Johnson Controls sits slightly below its current price of $137.65, suggesting limited near-term upside. Carrier’s target consensus at $67.88 implies modest appreciation from its $63.92 market price, indicating cautious optimism.

Don’t Let Luck Decide Your Entry Point
Optimize your entry points with our advanced ProRealTime indicators. You’ll get efficient buy signals with precise price targets for maximum performance. Start outperforming now!
How do institutions grade them?
Johnson Controls International plc Grades
Below is a summary of recent institutional grades for Johnson Controls International plc:
| Grading Company | Action | New Grade | Date |
|---|---|---|---|
| JP Morgan | maintain | Overweight | 2026-02-06 |
| RBC Capital | maintain | Sector Perform | 2026-02-05 |
| Mizuho | maintain | Neutral | 2026-02-05 |
| Wells Fargo | maintain | Overweight | 2026-02-05 |
| Citigroup | maintain | Neutral | 2026-02-05 |
| Barclays | maintain | Equal Weight | 2026-02-05 |
| Morgan Stanley | maintain | Overweight | 2026-01-13 |
| Barclays | maintain | Equal Weight | 2026-01-07 |
| Goldman Sachs | maintain | Buy | 2025-11-07 |
| Argus Research | maintain | Buy | 2025-11-07 |
Carrier Global Corporation Grades
Below is a summary of recent institutional grades for Carrier Global Corporation:
| Grading Company | Action | New Grade | Date |
|---|---|---|---|
| RBC Capital | maintain | Outperform | 2026-02-06 |
| Wells Fargo | maintain | Equal Weight | 2026-02-06 |
| Citigroup | maintain | Buy | 2026-02-06 |
| JP Morgan | maintain | Neutral | 2026-01-16 |
| Citigroup | maintain | Buy | 2026-01-12 |
| Mizuho | maintain | Outperform | 2026-01-05 |
| UBS | maintain | Buy | 2026-01-05 |
| Barclays | maintain | Overweight | 2025-12-10 |
| RBC Capital | maintain | Outperform | 2025-12-05 |
| Wells Fargo | maintain | Equal Weight | 2025-12-04 |
Which company has the best grades?
Carrier Global Corporation generally receives stronger grades, including multiple “Outperform” and “Buy” ratings. Johnson Controls shows a wider range, mostly “Overweight” and “Buy.” Carrier’s higher grades may signal greater institutional confidence, potentially affecting investor sentiment and valuation.
Risks specific to each company
The following categories identify the critical pressure points and systemic threats facing Johnson Controls International plc and Carrier Global Corporation in the 2026 market environment:
1. Market & Competition
Johnson Controls International plc
- Faces intense competition in HVAC and building solutions with a broad product portfolio across regions.
Carrier Global Corporation
- Competes globally in HVAC and refrigeration but with narrower segment focus and newer market presence.
2. Capital Structure & Debt
Johnson Controls International plc
- Moderate leverage with a debt-to-assets ratio of 29.5%, favorable interest coverage at 14.6x.
Carrier Global Corporation
- Slightly higher leverage, debt-to-assets at 34.1%, but lower interest coverage of 5.3x signals tighter debt servicing capacity.
3. Stock Volatility
Johnson Controls International plc
- Higher beta of 1.43 indicates greater sensitivity to market swings.
Carrier Global Corporation
- Beta of 1.34 shows moderate volatility, slightly less reactive to market changes.
4. Regulatory & Legal
Johnson Controls International plc
- Operates internationally, exposed to diverse regulatory regimes in building and environmental standards.
Carrier Global Corporation
- US-based with global operations, faces complex compliance in HVAC, fire safety, and refrigeration regulations.
5. Supply Chain & Operations
Johnson Controls International plc
- Large global footprint may face supply chain disruptions but benefits from scale and diversified suppliers.
Carrier Global Corporation
- More concentrated operations increase supply chain risk but enable focused management and agility.
6. ESG & Climate Transition
Johnson Controls International plc
- Energy efficiency solutions position it well for climate transition but must meet rising ESG standards globally.
Carrier Global Corporation
- Active in refrigeration and HVAC sectors with carbon footprint challenges but invests in sustainable technologies.
7. Geopolitical Exposure
Johnson Controls International plc
- Headquarters in Ireland with significant international exposure increases geopolitical risk, including trade tensions.
Carrier Global Corporation
- US-based with global markets, exposed to geopolitical risks but benefits from US regulatory and economic stability.
Which company shows a better risk-adjusted profile?
Johnson Controls faces its biggest risk in liquidity, reflected by unfavorable current and quick ratios, risking operational flexibility. Carrier’s critical vulnerability lies in higher leverage and weaker debt coverage, threatening financial stability amid rising interest rates. Despite higher market volatility, Johnson Controls’ stronger interest coverage and diverse market presence grant it a marginally better risk-adjusted profile. The recent improvement in Johnson Controls’ interest coverage ratio to 14.6x highlights resilience, whereas Carrier’s lower coverage of 5.3x raises caution on debt servicing capacity.
Final Verdict: Which stock to choose?
Johnson Controls International (JCI) excels as a cash-generating powerhouse with improving profitability that signals growing operational strength. Its point of vigilance lies in liquidity constraints, as the current ratio remains below 1, exposing short-term risk. JCI fits well within an Aggressive Growth portfolio seeking expanding margins amid financial tightening.
Carrier Global Corporation (CARR) offers a strategic moat through its solid recurring revenue base and operational efficiency in climate control solutions. Compared to JCI, it presents a more stable liquidity profile and a less volatile operational footprint. CARR suits investors targeting GARP—Growth at a Reasonable Price—with a preference for steadier cash flow and moderate growth.
If you prioritize accelerating profitability and are comfortable navigating tighter liquidity, JCI outshines with its robust margin expansion and cash flow growth. However, if you seek better stability and a defensible market niche with less financial strain, CARR offers a superior risk profile despite its more muted earnings trend. Both scenarios require careful monitoring of capital efficiency and leverage.
Disclaimer: Investment carries a risk of loss of initial capital. The past performance is not a reliable indicator of future results. Be sure to understand risks before making an investment decision.
Go Further
I encourage you to read the complete analyses of Johnson Controls International plc and Carrier Global Corporation to enhance your investment decisions: