Home > Comparison > Consumer Cyclical > CCL vs HAS
The strategic rivalry between Carnival Corporation & plc and Hasbro, Inc. shapes the competitive landscape of the consumer cyclical sector. Carnival, a capital-intensive leisure travel operator, contrasts sharply with Hasbro, a diversified play and entertainment company focused on branded consumer products and digital gaming. This analysis pits asset-heavy scale against intellectual property strength to identify which model offers superior risk-adjusted returns for diversified portfolios navigating evolving consumer trends.
Table of contents
Companies Overview
Carnival Corporation & plc and Hasbro, Inc. both hold pivotal roles in the leisure sector, shaping diverse consumer experiences.
Carnival Corporation & plc: Global Cruise Leisure Leader
Carnival Corporation dominates the leisure travel industry with its extensive fleet of 87 ships across multiple brands. Its core revenue stems from cruise ticket sales and onboard services. In 2026, the company focuses strategically on expanding port destinations and enhancing consumer travel experiences worldwide, leveraging its broad geographic reach.
Hasbro, Inc.: Integrated Play and Entertainment Powerhouse
Hasbro commands the play and entertainment market through toy and game sales plus brand licensing. Its revenue engine combines physical products with digital gaming and entertainment content. The firm’s strategic emphasis in 2026 lies in strengthening brand integration across digital platforms and expanding entertainment content to deepen consumer engagement.
Strategic Collision: Similarities & Divergences
Both companies thrive on consumer leisure demand but differ sharply in business models: Carnival offers physical travel experiences while Hasbro blends physical and digital entertainment IP. Their primary battleground is consumer discretionary spending within leisure, yet Carnival’s asset-heavy approach contrasts with Hasbro’s brand-driven, intellectual property focus. Investors face distinct profiles—high operational leverage for Carnival versus diversified, content-driven growth for Hasbro.
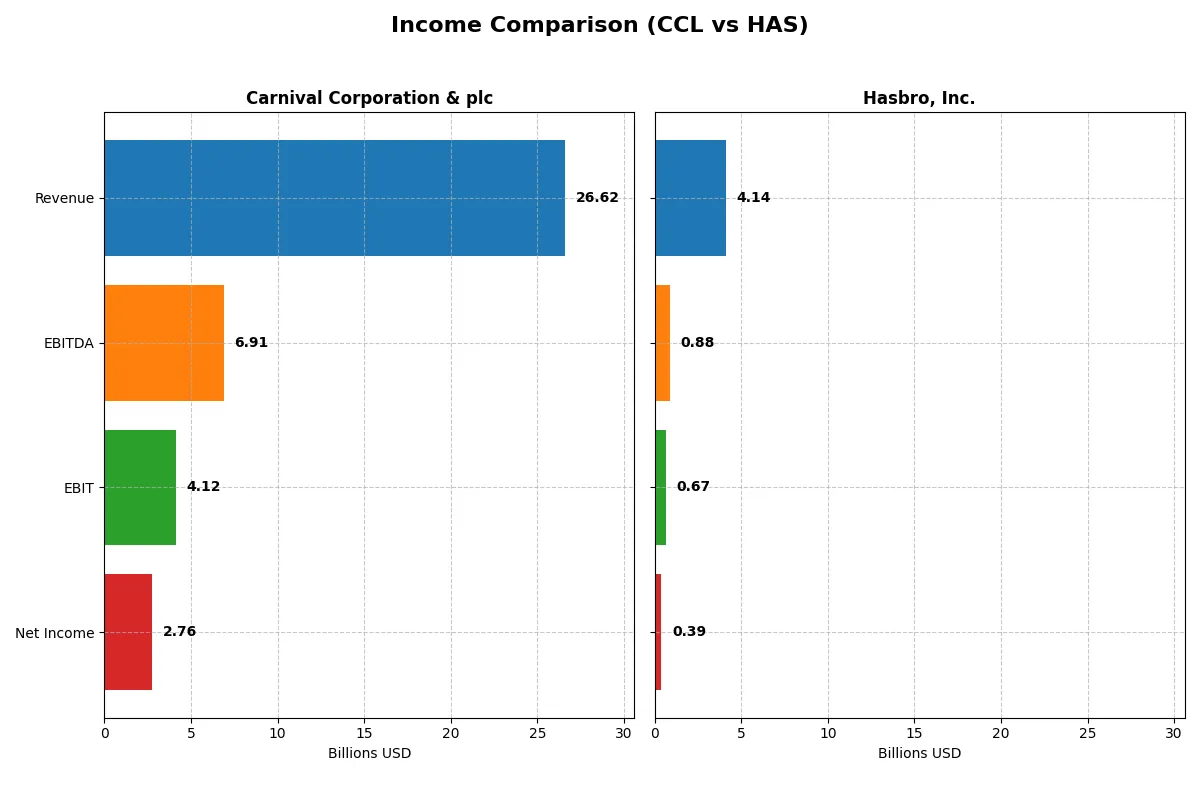
Income Statement Comparison
The following data dissects the core profitability and scalability of both corporate engines to reveal who dominates the bottom line:
| Metric | Carnival Corporation & plc (CCL) | Hasbro, Inc. (HAS) |
|---|---|---|
| Revenue | 26.6B | 4.1B |
| Cost of Revenue | 18.7B | 1.5B |
| Operating Expenses | 3.4B | 2.0B |
| Gross Profit | 7.9B | 2.7B |
| EBITDA | 6.9B | 880M |
| EBIT | 4.1B | 668M |
| Interest Expense | 1.3B | 171M |
| Net Income | 2.8B | 386M |
| EPS | 2.1 | 2.77 |
| Fiscal Year | 2025 | 2024 |
Income Statement Analysis: The Bottom-Line Duel
This income statement comparison reveals which company runs a more efficient and profitable corporate engine through recent fiscal performance.
Carnival Corporation & plc Analysis
Carnival’s revenue surged from 19B in 2021 to 26.6B in 2025, showing strong recovery and growth. Net income improved dramatically from a -9.5B loss in 2021 to a 2.76B profit in 2025. The gross margin remains healthy at 29.6%, while net margin expanded to 10.4%, signaling enhanced cost control and operational efficiency in 2025.
Hasbro, Inc. Analysis
Hasbro’s revenue declined from 6.4B in 2021 to 4.1B in 2024, reflecting contraction in sales. Despite this, the company maintained robust gross margin near 64.6% and improved net margin to 9.3% in 2024. Net income swung from a 1.49B loss in 2023 to a 386M profit in 2024, driven by margin expansion and positive earnings momentum.
Margin Resilience vs. Revenue Recovery
Carnival leads with superior top-line growth and a stronger rebound in profitability, reflecting operational leverage and margin recovery after pandemic lows. Hasbro excels in margin resilience despite shrinking revenues, highlighting disciplined cost management. For investors, Carnival’s profile suits those targeting growth and recovery, while Hasbro appeals to value seekers focused on margin strength amid sales pressure.
Financial Ratios Comparison
These vital ratios act as a diagnostic tool to expose the underlying fiscal health, valuation premiums, and capital efficiency of the companies compared below:
| Ratios | Carnival Corporation & plc (CCL) | Hasbro, Inc. (HAS) |
|---|---|---|
| ROE | 22.47% | 33.31% |
| ROIC | 10.79% | 11.02% |
| P/E | 12.33 | 20.14 |
| P/B | 2.77 | 6.71 |
| Current Ratio | 0.32 | 1.60 |
| Quick Ratio | 0.28 | 1.40 |
| D/E | 2.28 | 2.95 |
| Debt-to-Assets | 54.16% | 53.79% |
| Interest Coverage | 3.32 | 4.03 |
| Asset Turnover | 0.52 | 0.65 |
| Fixed Asset Turnover | 0.59 | 13.67 |
| Payout ratio | 0% | 101.12% |
| Dividend yield | 0% | 5.02% |
| Fiscal Year | 2025 | 2024 |
Efficiency & Valuation Duel: The Vital Signs
Ratios act as a company’s DNA, revealing hidden risks and operational excellence essential for investment decisions.
Carnival Corporation & plc
Carnival shows strong profitability with a 22.47% ROE and a solid 10.37% net margin. Its P/E of 12.33 suggests a favorable valuation, but a low current ratio of 0.32 flags liquidity risks. Carnival pays no dividends, reinvesting in operations despite an unfavorable ROIC versus WACC, which may pressure future returns.
Hasbro, Inc.
Hasbro delivers an impressive 33.31% ROE and a 9.32% net margin, reflecting solid profitability. The stock trades at a neutral P/E of 20.14 but carries a high P/B of 6.71, indicating possible overvaluation. Hasbro supports shareholders with a 5.02% dividend yield, balancing growth investment and income distribution effectively.
Valuation Discipline vs. Robust Profitability
Carnival offers a cheaper valuation but faces liquidity and capital efficiency concerns. Hasbro shows superior profitability and dividend support but at a stretched valuation. Investors seeking stability and income may prefer Hasbro, while value-focused investors might weigh Carnival’s risks for potential upside.
Which one offers the Superior Shareholder Reward?
I observe that Hasbro delivers superior shareholder rewards compared to Carnival Corporation. Hasbro pays a robust dividend yield of 5.0%, backed by a payout ratio near 100% but supported by strong free cash flow (5.45/share) and modest capex (0.63/share). Carnival pays no dividend but retains cash for recovery and growth, with free cash flow at 1.99/share and heavy debt (D/E 2.28). Hasbro also executes meaningful buybacks, enhancing total return. Carnival’s zero payout and stretched liquidity (current ratio 0.32) raise sustainability concerns. For 2026, Hasbro’s balanced dividends, sustainable buybacks, and healthier margins offer a more attractive total return profile.
Comparative Score Analysis: The Strategic Profile
The radar chart reveals the fundamental DNA and trade-offs of Carnival Corporation & plc and Hasbro, Inc., highlighting their core financial strengths and weaknesses:
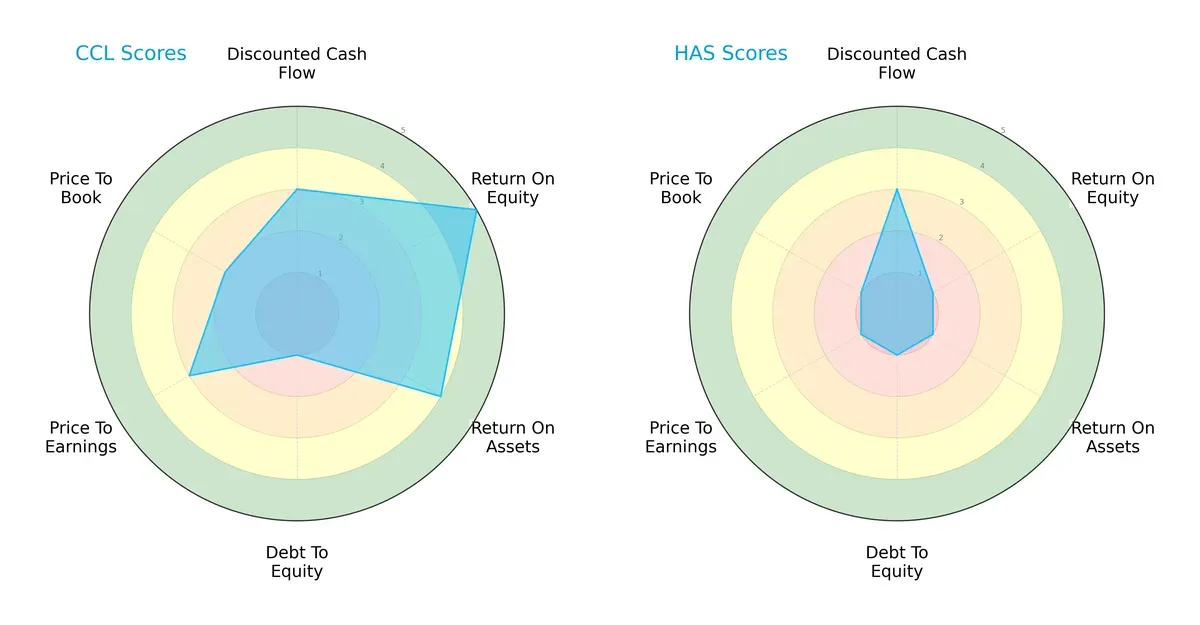
Carnival shows a balanced profile with strong ROE (5) and ROA (4), signaling efficient asset use and profitability. However, its weak debt-to-equity score (1) flags high leverage risk. Hasbro lags across most metrics, relying mainly on a moderate DCF score (3) but suffering very low scores in profitability and valuation, indicating vulnerability and lack of competitive edge.
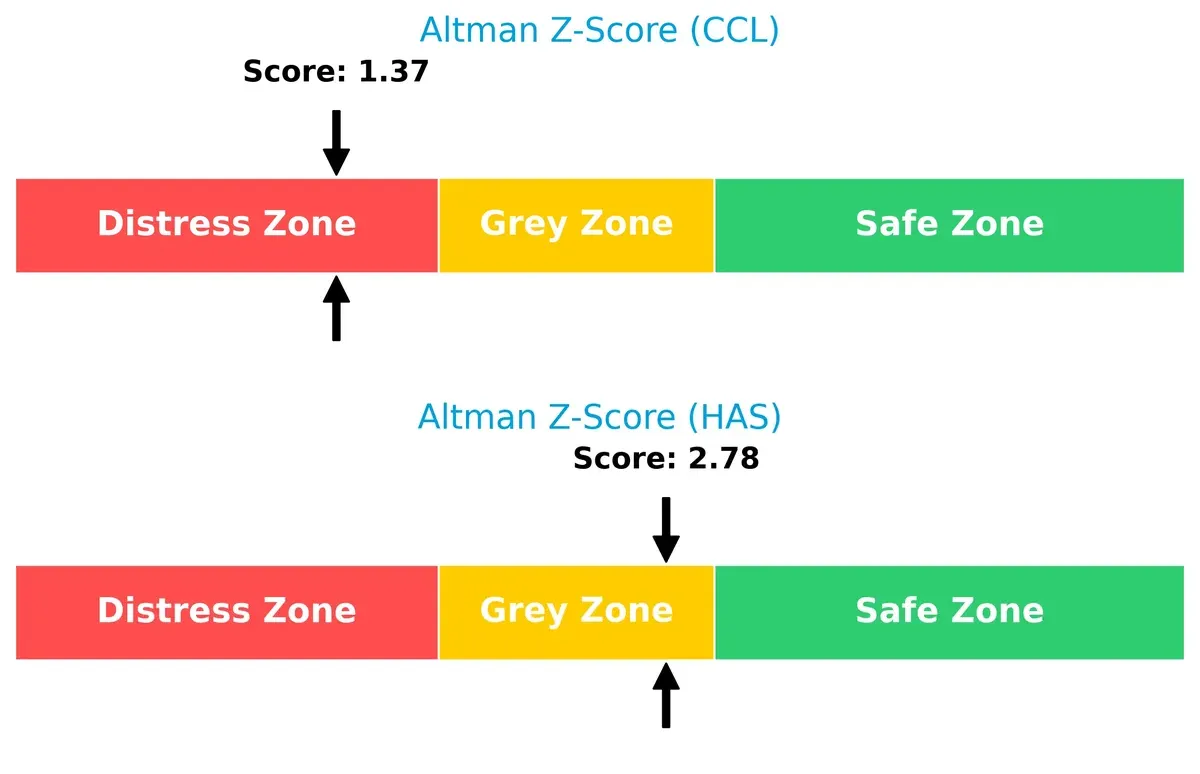
Bankruptcy Risk: Solvency Showdown
Carnival’s Altman Z-Score of 1.37 places it deep in the distress zone, signaling high bankruptcy risk in this cycle. Hasbro’s 2.78 sits in the grey zone, indicating moderate solvency concerns but relatively better survival odds:
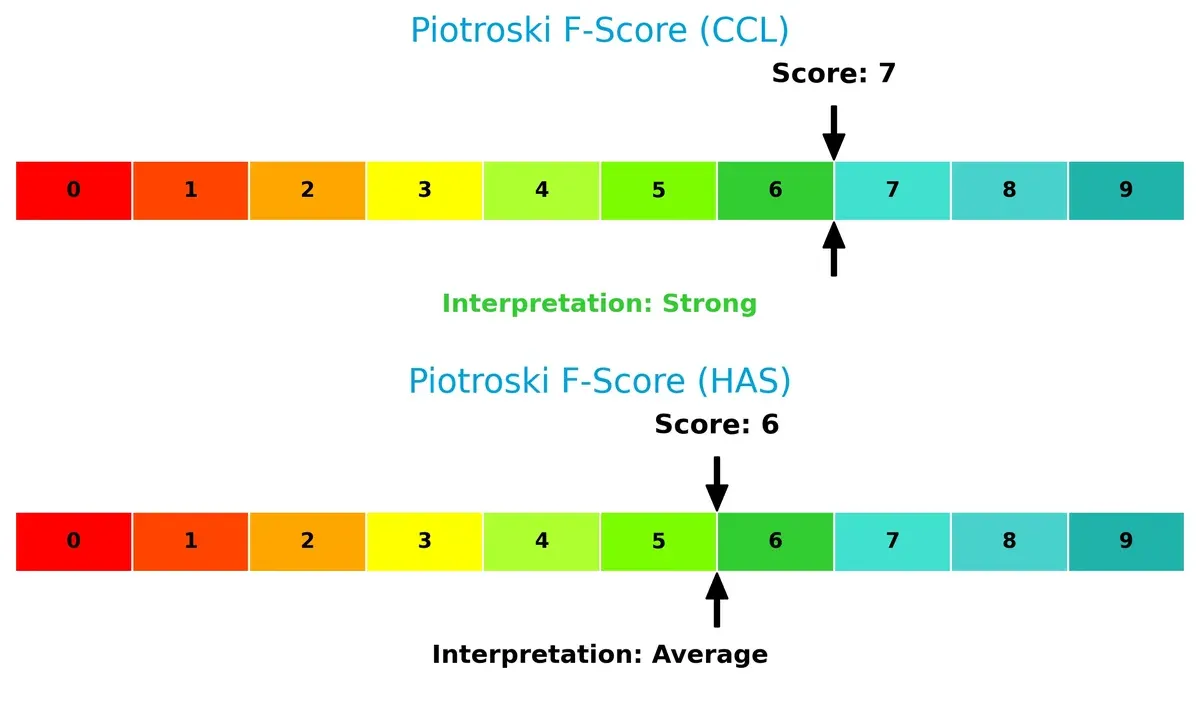
Financial Health: Quality of Operations
Carnival’s Piotroski F-Score of 7 suggests strong financial health and operational quality. Hasbro scores 6, reflecting average health with potential internal red flags relative to Carnival’s superior metrics:
How are the two companies positioned?
This section dissects the operational DNA of CCL and HAS by comparing their revenue distribution and internal dynamics. The goal is to confront their economic moats and identify which model holds the most resilient, sustainable advantage today.
Revenue Segmentation: The Strategic Mix
This visual comparison dissects how Carnival Corporation & plc and Hasbro, Inc. diversify their income streams and where their primary sector bets lie:
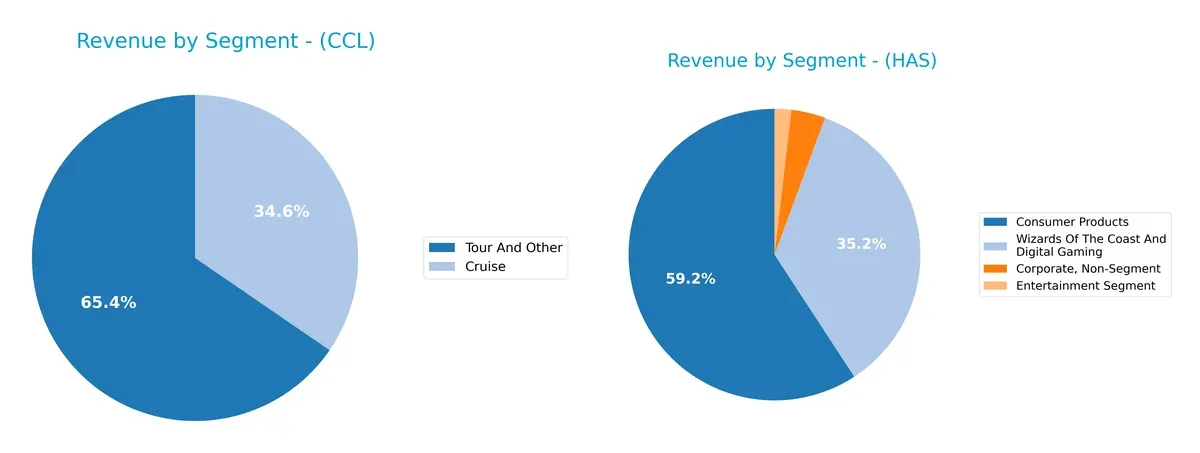
Carnival anchors its revenue in two main segments: Tour And Other at $17.4B and Cruise at $9.2B in 2025, showing moderate diversification within travel experiences. Hasbro pivots on Consumer Products with $2.54B, but also leverages Wizards of the Coast & Digital Gaming at $1.51B, plus smaller Entertainment revenue. Carnival’s reliance on travel-related offerings risks exposure to sector downturns, while Hasbro’s mix indicates broader ecosystem lock-in across physical and digital entertainment.
Strengths and Weaknesses Comparison
This table compares the Strengths and Weaknesses of Carnival Corporation & plc and Hasbro, Inc.:
CCL Strengths
- Large revenue from Cruise and Tour segments
- Strong net margin and ROE
- Global presence in Europe, Australia, Asia, and North America
HAS Strengths
- Diversified revenue across Consumer Products and Digital Gaming
- Favorable ROE and ROIC with WACC below ROIC
- Healthy current and quick ratios indicating good liquidity
CCL Weaknesses
- Unfavorable ROIC vs WACC
- Low liquidity ratios (current 0.32, quick 0.28)
- High leverage with D/E 2.28 and debt-to-assets 54.16%
- No dividend yield
- Moderate asset turnover
HAS Weaknesses
- High price-to-book ratio (6.71) indicating possible overvaluation
- Elevated debt-to-equity (2.95) and debt-to-assets (53.79%)
- Neutral interest coverage and asset turnover
- Some segments showing negative corporate non-segment results
Carnival shows strong profitability but faces liquidity and leverage challenges, limiting capital flexibility. Hasbro exhibits better liquidity and capital efficiency but carries valuation and debt risks. Each company’s financial profile reflects different operational and strategic pressures.
The Moat Duel: Analyzing Competitive Defensibility
A structural moat is the only true shield protecting long-term profits from relentless competition erosion. Let’s dissect the moats of Carnival Corporation & plc and Hasbro, Inc.:
Carnival Corporation & plc: Scale and Brand Reach Moat
Carnival’s moat stems from its vast fleet and global brand presence, creating high entry barriers through scale. Despite a slightly unfavorable ROIC vs. WACC, rising profitability signals improving operational leverage in 2026.
Hasbro, Inc.: Intangible Assets and Brand Loyalty Moat
Hasbro’s moat is built on strong intangible assets and brand loyalty, unlike Carnival’s physical scale. It commands a very favorable ROIC surplus over WACC, with expanding margins and robust growth potential in digital gaming.
Verdict: Scale Dominance vs. Intangible Asset Strength
Hasbro holds a deeper, more sustainable moat, evidenced by its strong ROIC premium and brand-driven pricing power. Carnival’s scale is formidable but currently less value-creative, leaving Hasbro better positioned to defend market share long term.
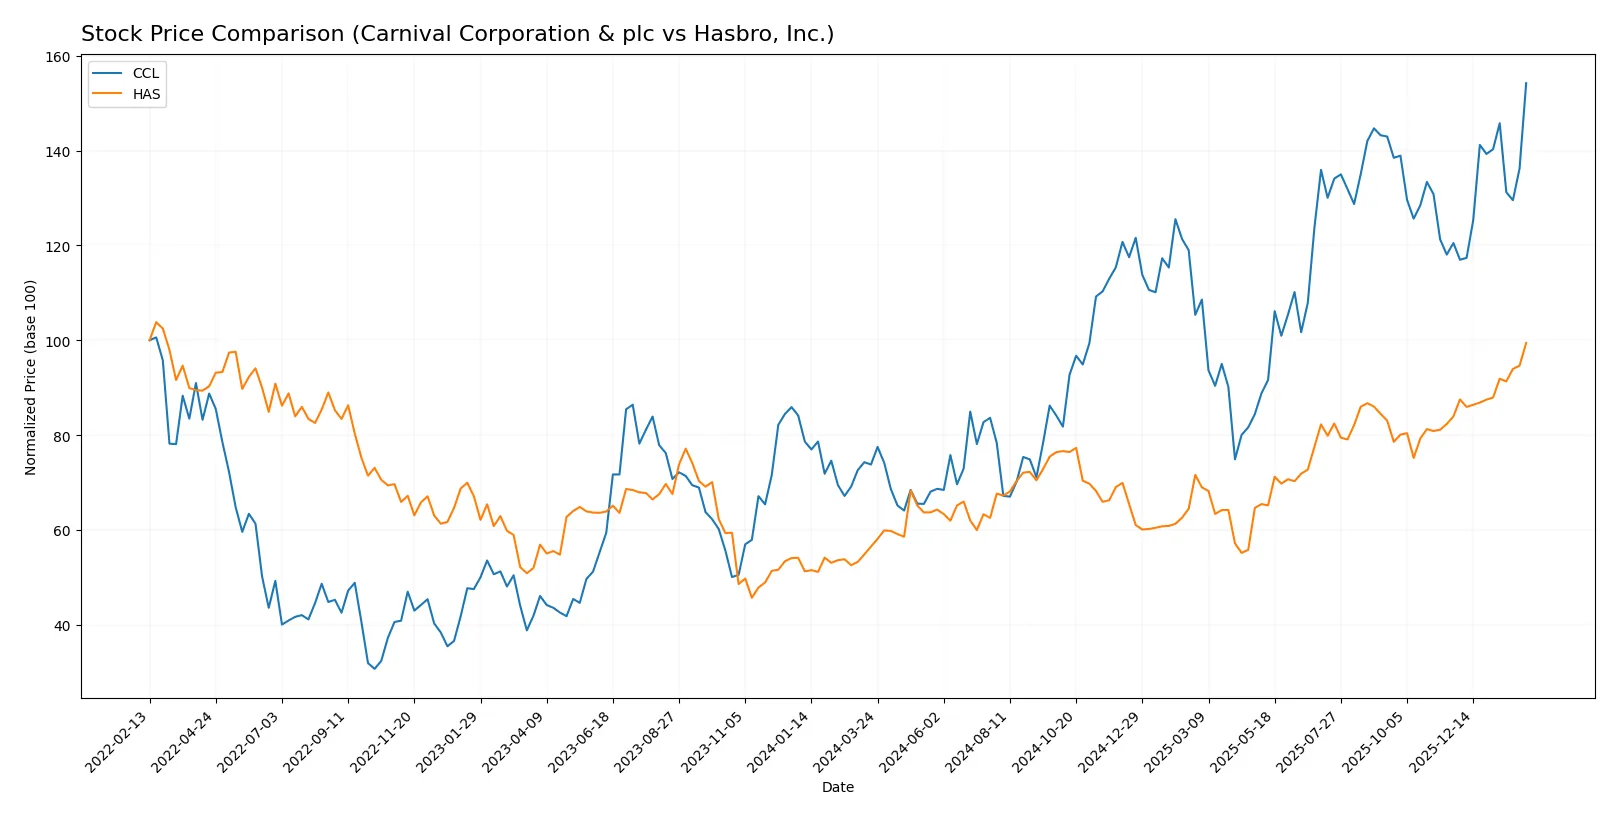
Which stock offers better returns?
The past year shows strong upward momentum for both stocks, with Carnival Corporation accelerating sharply and Hasbro maintaining steady gains amid differing volume trends.
Trend Comparison
Carnival Corporation’s stock rose 109.04% over 12 months, indicating a bullish trend with accelerating gains and moderate volatility (std dev 5.64). It reached a high of 33.99 and a low of 14.12.
Hasbro’s stock increased 76.03% in the same period, also bullish with accelerating momentum but higher volatility (std dev 9.68). Its high was 93.84 and low 52.04, reflecting wider price swings.
Carnival demonstrated stronger market performance with a 109% gain versus Hasbro’s 76%. Both trends accelerate, but Carnival leads in total price appreciation.
Target Prices
Analysts present a moderate upside for both Carnival Corporation & plc and Hasbro, Inc., reflecting cautious optimism.
| Company | Target Low | Target High | Consensus |
|---|---|---|---|
| Carnival Corporation & plc | 33 | 40 | 36.54 |
| Hasbro, Inc. | 99 | 105 | 102.33 |
Carnival’s consensus target at 36.54 suggests a slight 7.5% upside from the current 33.99 price. Hasbro’s 102.33 target implies nearly a 9% gain from 93.84. Both stocks show room for appreciation amid sector volatility.

Don’t Let Luck Decide Your Entry Point
Optimize your entry points with our advanced ProRealTime indicators. You’ll get efficient buy signals with precise price targets for maximum performance. Start outperforming now!
How do institutions grade them?
The following tables summarize the latest institutional grade updates for Carnival Corporation & plc and Hasbro, Inc.:
Carnival Corporation & plc Grades
This table lists recent grade actions by major financial institutions for Carnival Corporation & plc.
| Grading Company | Action | New Grade | Date |
|---|---|---|---|
| Truist Securities | maintain | Hold | 2026-01-22 |
| TD Cowen | maintain | Buy | 2026-01-13 |
| B of A Securities | maintain | Buy | 2026-01-12 |
| UBS | maintain | Buy | 2026-01-12 |
| Bernstein | maintain | Market Perform | 2026-01-06 |
| Argus Research | maintain | Buy | 2025-12-22 |
| Wells Fargo | maintain | Overweight | 2025-12-22 |
| Mizuho | maintain | Outperform | 2025-12-22 |
| Stifel | maintain | Buy | 2025-12-22 |
| Deutsche Bank | maintain | Hold | 2025-12-22 |
Hasbro, Inc. Grades
This table shows recent grade actions by recognized analysts for Hasbro, Inc.
| Grading Company | Action | New Grade | Date |
|---|---|---|---|
| Roth Capital | maintain | Buy | 2026-02-04 |
| Morgan Stanley | maintain | Overweight | 2026-02-02 |
| UBS | maintain | Buy | 2026-01-07 |
| UBS | maintain | Buy | 2025-11-14 |
| Citigroup | maintain | Buy | 2025-10-24 |
| B of A Securities | maintain | Buy | 2025-09-29 |
| UBS | maintain | Buy | 2025-08-13 |
| DA Davidson | maintain | Neutral | 2025-07-24 |
| Citigroup | maintain | Buy | 2025-07-24 |
| Roth Capital | maintain | Buy | 2025-07-24 |
Which company has the best grades?
Hasbro, Inc. consistently earns “Buy” and “Overweight” grades, reflecting strong institutional confidence. Carnival Corporation shows mixed ratings, ranging from “Buy” to “Hold” and “Market Perform,” indicating more cautious sentiment. Investors may view Hasbro’s grade profile as signaling steadier analyst support.
Risks specific to each company
The following categories identify the critical pressure points and systemic threats facing both firms in the 2026 market environment:
1. Market & Competition
Carnival Corporation & plc
- Faces intense competition in leisure travel with 87 ships and global scale. Market sensitive to economic cycles and consumer discretionary spending.
Hasbro, Inc.
- Operates in the toy and entertainment sector, competing with digital gaming and entertainment firms. Brand strength is key but challenged by changing consumer preferences.
2. Capital Structure & Debt
Carnival Corporation & plc
- High leverage with debt-to-equity of 2.28 and debt-to-assets at 54.16%. Interest coverage is moderate at 3.05, indicating risk in rising rate environment.
Hasbro, Inc.
- Also highly leveraged with debt-to-equity of 2.95 and debt-to-assets at 53.79%. Slightly better interest coverage at 3.9 but still a concern for financial flexibility.
3. Stock Volatility
Carnival Corporation & plc
- Beta at 2.442 signals high stock price volatility, common in cyclical leisure sector. Market swings can be sharp and sudden.
Hasbro, Inc.
- Beta at 0.549 indicates low volatility, reflecting defensive nature of consumer staples and stable earnings streams.
4. Regulatory & Legal
Carnival Corporation & plc
- Subject to maritime safety, environmental, and international travel regulations. Compliance costs can rise unexpectedly.
Hasbro, Inc.
- Faces regulations on product safety, intellectual property, and digital content. Legal risks from licensing and entertainment contracts.
5. Supply Chain & Operations
Carnival Corporation & plc
- Complex global logistics for cruise operations and port services. Vulnerable to disruptions from pandemics, natural disasters, or geopolitical tensions.
Hasbro, Inc.
- Relies on global manufacturing and distribution of toys and games. Potential risks from raw material costs and shipping delays remain.
6. ESG & Climate Transition
Carnival Corporation & plc
- Faces high ESG scrutiny due to emissions and environmental impact of cruise ships. Transition risks are material and costly.
Hasbro, Inc.
- Increasing pressure on sustainable materials and ethical sourcing. Climate initiatives affect packaging and production processes.
7. Geopolitical Exposure
Carnival Corporation & plc
- Global operations exposed to geopolitical instability affecting travel routes and port access. Currency fluctuations also a risk.
Hasbro, Inc.
- International sales subject to trade policies and tariffs. Political tensions could disrupt supply chains or market access.
Which company shows a better risk-adjusted profile?
Hasbro’s most impactful risk is its high debt load limiting financial flexibility despite strong operational metrics. Carnival’s biggest risk is market cyclicality amplified by high leverage and weak liquidity ratios. Overall, Hasbro shows a better risk-adjusted profile, supported by a more favorable Altman Z-score in the grey zone versus Carnival’s distress zone. Hasbro’s stronger liquidity ratios (current ratio 1.6 vs. 0.32) justify my greater confidence amid market uncertainties.
Final Verdict: Which stock to choose?
Carnival Corporation & plc’s superpower lies in its robust income statement growth and improving profitability metrics. Despite a challenging balance sheet and liquidity concerns, its accelerating earnings and operational momentum make it a potential fit for aggressive growth portfolios willing to tolerate leverage risks.
Hasbro, Inc. benefits from a durable strategic moat, demonstrated by a strong ROIC comfortably above its cost of capital. Its healthier liquidity and superior capital efficiency offer a safer profile than Carnival, aligning well with GARP investors who prioritize steady returns with moderate risk.
If you prioritize high-growth potential and can accept financial leverage, Carnival outshines with its operational rebound and earnings acceleration. However, if you seek better stability and a proven economic moat, Hasbro offers superior capital discipline and lower risk, despite commanding a premium valuation. Each stock appeals to distinct investor profiles shaped by risk tolerance and growth expectations.
Disclaimer: Investment carries a risk of loss of initial capital. The past performance is not a reliable indicator of future results. Be sure to understand risks before making an investment decision.
Go Further
I encourage you to read the complete analyses of Carnival Corporation & plc and Hasbro, Inc. to enhance your investment decisions: