In the competitive healthcare distribution sector, McKesson Corporation (MCK) and Cardinal Health, Inc. (CAH) stand out as industry leaders with significant market overlap. Both companies innovate by integrating pharmaceutical and medical product distribution with advanced technology solutions, aiming to streamline healthcare delivery. This article will carefully analyze their strategies and performance to help you determine which company offers the most compelling investment opportunity in 2026.

Table of contents
Companies Overview
I will begin the comparison between McKesson Corporation and Cardinal Health, Inc. by providing an overview of these two companies and their main differences.
McKesson Overview
McKesson Corporation operates in the healthcare sector, providing services primarily in pharmaceutical distribution, medical-surgical solutions, and prescription technology. It serves markets in the US and internationally, including Europe and Canada. With a broad range of offerings spanning branded and generic drugs, clinical support, and technology solutions, McKesson supports healthcare providers and biopharma companies. The company is headquartered in Irving, Texas, and employs approximately 44,000 people.
Cardinal Health Overview
Cardinal Health, Inc. is an integrated healthcare services and products company active in the US, Canada, Europe, and Asia. It operates through two main segments: Pharmaceutical distribution and Medical products manufacturing and sourcing. Cardinal Health supplies hospitals, pharmacies, and healthcare providers with pharmaceutical products and branded medical and surgical items, while also offering supply chain and pharmacy management services. The company is based in Dublin, Ohio, with around 48,000 employees.
Key similarities and differences
Both McKesson and Cardinal Health operate in the healthcare distribution industry, offering pharmaceutical and medical supply products and services. Each company serves a broad geographic footprint spanning North America and international markets. However, McKesson has a dedicated prescription technology segment focused on biopharma and patient solutions, whereas Cardinal Health emphasizes medical product manufacturing and supply chain services. Their business models overlap in distribution but differ in specialized service and product offerings.
Income Statement Comparison
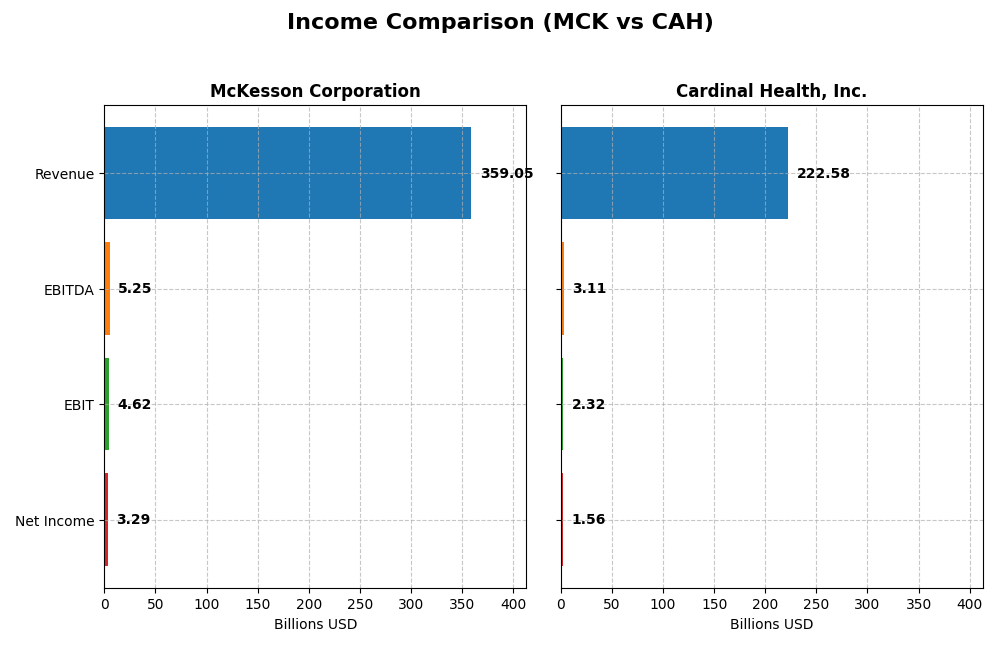
The table below compares key income statement metrics for McKesson Corporation and Cardinal Health, Inc. for the fiscal year 2025, highlighting their financial performance in USD.
| Metric | McKesson Corporation | Cardinal Health, Inc. |
|---|---|---|
| Market Cap | 102B | 48B |
| Revenue | 359B | 223B |
| EBITDA | 5.25B | 3.11B |
| EBIT | 4.62B | 2.32B |
| Net Income | 3.30B | 1.56B |
| EPS | 25.86 | 6.48 |
| Fiscal Year | 2025 | 2025 |
Income Statement Interpretations
McKesson Corporation
McKesson’s revenue shows strong growth over 2021-2025, rising 50.7%, with net income up 172.6%, reflecting solid expansion. Margins remain mostly stable, with a gross margin around 3.5% and a net margin near 0.9%. The 2025 fiscal year saw revenue growth of 16.2% and EBIT growth of 14.5%, although net margin slightly declined by 5.6%, indicating some pressure on profitability.
Cardinal Health, Inc.
Cardinal Health experienced a 37% revenue increase from 2021 to 2025, with net income growing 155.5%. Margins held steady, with a gross margin near 3.7% and a net margin around 0.7%. In 2025, revenue dipped 1.9% but gross profit improved 10.2%, while EBIT and net margin surged by about 85%, showing improved operational efficiency despite top-line softness.
Which one has the stronger fundamentals?
Both companies demonstrate favorable income statement trends, with McKesson showing higher absolute growth in revenue and net income, plus stable margins. Cardinal Health displays stronger margin improvement and operational gains in the latest year despite revenue decline. McKesson’s broader margin stability contrasts with Cardinal’s recent efficiency gains, making fundamentals robust but nuanced between the two.
Financial Ratios Comparison
The following table presents a snapshot of key financial ratios for McKesson Corporation (MCK) and Cardinal Health, Inc. (CAH) for their most recent fiscal years, offering insight into profitability, liquidity, leverage, and operational efficiency.
| Ratios | McKesson Corporation (2025) | Cardinal Health, Inc. (2025) |
|---|---|---|
| ROE | -1.59% | -0.56% |
| ROIC | 23.30% | 11.37% |
| P/E | 26.0 | 25.9 |
| P/B | -41.3 | -14.6 |
| Current Ratio | 0.90 | 0.94 |
| Quick Ratio | 0.53 | 0.50 |
| D/E (Debt-to-Equity) | -3.56 | -3.36 |
| Debt-to-Assets | 9.8% | 17.6% |
| Interest Coverage | 17.1 | 10.6 |
| Asset Turnover | 4.78 | 4.19 |
| Fixed Asset Turnover | 83.8 | 77.9 |
| Payout Ratio | 10.5% | 31.6% |
| Dividend Yield | 0.40% | 1.22% |
Interpretation of the Ratios
McKesson Corporation
McKesson shows a mixed ratio profile with 57.14% favorable and 42.86% unfavorable metrics. Strengths include a strong return on invested capital (23.3%), low debt to assets (9.83%), and high asset turnover (4.78). However, concerns arise from its negative return on equity (-158.87%) and weak current and quick ratios below 1. The company pays dividends with a modest yield of 0.4%, but the payout’s sustainability may be challenged by the low net margin (0.92%) and relatively high price-to-earnings ratio (26.02).
Cardinal Health, Inc.
Cardinal Health also presents 57.14% favorable ratios, with a lower share of unfavorable metrics (35.71%) than McKesson. Key positives include an 11.37% return on invested capital, manageable debt levels, and solid asset turnover (4.19). The firm’s current and quick ratios are slightly below 1, indicating liquidity caution. It offers a higher dividend yield of 1.22%, considered neutral, suggesting moderate shareholder returns balanced by stable coverage and manageable payout risks.
Which one has the best ratios?
Both companies show a favorable overall ratio assessment, each with 57.14% favorable metrics. McKesson’s higher return on invested capital and asset turnover contrast with more significant concerns over its negative return on equity and liquidity ratios. Cardinal Health’s ratios are generally stronger in terms of equity returns and dividend yield stability, with fewer unfavorable indicators. The evaluation suggests comparable strength with different risk profiles.
Strategic Positioning
This section compares the strategic positioning of McKesson Corporation and Cardinal Health, Inc. in terms of market position, key segments, and exposure to technological disruption:
McKesson Corporation
- Leading healthcare distributor with larger market cap and lower beta, facing moderate competitive pressure.
- Operates four segments: U.S. Pharmaceutical, International, Medical-Surgical Solutions, and Prescription Technology Solutions.
- Invests in prescription technology solutions connecting pharmacies, providers, payers, and biopharma to enhance medication management.
Cardinal Health, Inc.
- Integrated healthcare services company with smaller market cap and higher beta, competing in diverse markets.
- Operates two segments: Pharmaceutical and Medical, offering customized solutions across healthcare providers.
- Focuses on manufacturing and distributing medical devices and nuclear pharmacy services, with supply chain solutions.
McKesson Corporation vs Cardinal Health, Inc. Positioning
McKesson shows a more diversified segment structure including international operations and technology solutions, while Cardinal Health concentrates on pharmaceutical and medical segments. McKesson’s broader scope may offer varied revenue streams, whereas Cardinal Health emphasizes integrated healthcare services and manufacturing.
Which has the best competitive advantage?
Both companies demonstrate a very favorable economic moat with growing ROIC above WACC, indicating durable competitive advantages and efficient capital use. McKesson’s higher absolute ROIC advantage suggests a stronger value creation edge over Cardinal Health.
Stock Comparison
The stock prices of McKesson Corporation and Cardinal Health, Inc. have shown significant upward movements over the past year, with distinct trading dynamics highlighting varying momentum and volume trends.

Trend Analysis
McKesson Corporation’s stock exhibited a bullish trend with a 59.68% price increase over the past 12 months, although the trend shows deceleration despite high volatility and a peak price of 881.12.
Cardinal Health, Inc. posted a stronger bullish trend with a 92.54% gain over the same period, displaying acceleration and lower volatility, reaching a high of 212.26.
Comparing both, Cardinal Health delivered the highest market performance with a more pronounced upward trend and accelerating price momentum over the past year.
Target Prices
The current analyst consensus indicates positive upside potential for both McKesson Corporation and Cardinal Health, Inc.
| Company | Target High | Target Low | Consensus |
|---|---|---|---|
| McKesson Corporation | 1000 | 772 | 910.4 |
| Cardinal Health, Inc. | 243 | 186 | 215 |
Analysts expect McKesson’s stock to rise above its current price of $816.06, targeting around $910, while Cardinal Health’s target consensus of $215 also suggests moderate upside from the current $201.11 share price.
Analyst Opinions Comparison
This section compares analysts’ ratings and grades for McKesson Corporation and Cardinal Health, Inc.:
Rating Comparison
McKesson Corporation Rating
- Rating: C+ with a very favorable status reflecting moderate overall appeal.
- Discounted Cash Flow Score: 5, rated very favorable, indicating strong cash flow projections.
- ROE Score: 1, very unfavorable, showing weak efficiency in generating profit from equity.
- ROA Score: 3, moderate, reflecting average asset utilization effectiveness.
- Debt To Equity Score: 1, very unfavorable, suggesting high financial risk.
- Overall Score: 2, moderate, summarizing the company’s financial standing.
Cardinal Health, Inc. Rating
- Rating: C+ with a very favorable status reflecting moderate overall appeal.
- Discounted Cash Flow Score: 5, rated very favorable, indicating strong cash flow projections.
- ROE Score: 1, very unfavorable, showing weak efficiency in generating profit from equity.
- ROA Score: 3, moderate, reflecting average asset utilization effectiveness.
- Debt To Equity Score: 1, very unfavorable, suggesting high financial risk.
- Overall Score: 2, moderate, summarizing the company’s financial standing.
Which one is the best rated?
Both McKesson Corporation and Cardinal Health share identical ratings and scores across all key metrics, resulting in equal analyst evaluations with no clear advantage between them based solely on the provided data.
Scores Comparison
Here is a comparison of McKesson Corporation and Cardinal Health, Inc. scores:
MCK Scores
- Altman Z-Score: 5.82, indicating a safe zone status.
- Piotroski Score: 6, representing an average financial strength.
CAH Scores
- Altman Z-Score: 4.89, also in the safe zone.
- Piotroski Score: 6, equally showing average financial strength.
Which company has the best scores?
Both McKesson and Cardinal Health have Altman Z-Scores in the safe zone, with McKesson slightly higher. Their Piotroski Scores are identical at 6, indicating average financial strength for both companies based on the available data.
Grades Comparison
Here is a detailed comparison of recent grades assigned to McKesson Corporation and Cardinal Health, Inc.:
McKesson Corporation Grades
The following table summarizes grades from reputable financial institutions for McKesson Corporation:
| Grading Company | Action | New Grade | Date |
|---|---|---|---|
| Wells Fargo | Maintain | Equal Weight | 2025-11-10 |
| Baird | Maintain | Outperform | 2025-11-06 |
| Morgan Stanley | Maintain | Overweight | 2025-11-06 |
| UBS | Maintain | Buy | 2025-11-06 |
| UBS | Maintain | Buy | 2025-10-27 |
| Jefferies | Maintain | Buy | 2025-10-14 |
| JP Morgan | Maintain | Overweight | 2025-09-26 |
| Morgan Stanley | Maintain | Overweight | 2025-09-24 |
| Evercore ISI Group | Maintain | Outperform | 2025-09-24 |
| TD Cowen | Maintain | Buy | 2025-09-24 |
Overall, McKesson’s grades show a strong buy and outperform consensus from several major institutions, with no downgrades reported recently.
Cardinal Health, Inc. Grades
The following table lists recent grades from established grading firms for Cardinal Health, Inc.:
| Grading Company | Action | New Grade | Date |
|---|---|---|---|
| Citigroup | Upgrade | Buy | 2026-01-09 |
| Wells Fargo | Maintain | Overweight | 2025-11-05 |
| Mizuho | Maintain | Outperform | 2025-11-04 |
| TD Cowen | Maintain | Buy | 2025-11-03 |
| Evercore ISI Group | Maintain | Outperform | 2025-10-31 |
| Citigroup | Maintain | Neutral | 2025-10-31 |
| UBS | Maintain | Buy | 2025-10-31 |
| Wells Fargo | Maintain | Overweight | 2025-08-13 |
| Baird | Maintain | Outperform | 2025-08-13 |
| Evercore ISI Group | Maintain | Outperform | 2025-08-13 |
Cardinal Health’s ratings largely reflect a buy or outperform stance, with a recent upgrade by Citigroup and no sell ratings present.
Which company has the best grades?
Both McKesson Corporation and Cardinal Health, Inc. have received predominantly positive grades, with McKesson showing a slightly stronger consensus toward buy and outperform ratings. This may signal a higher analyst confidence in McKesson’s future prospects, potentially influencing investor sentiment and portfolio positioning.
Strengths and Weaknesses
Below is a comparison table highlighting key strengths and weaknesses of McKesson Corporation (MCK) and Cardinal Health, Inc. (CAH) based on the most recent data from 2025.
| Criterion | McKesson Corporation (MCK) | Cardinal Health, Inc. (CAH) |
|---|---|---|
| Diversification | Highly diversified across U.S. Pharmaceutical (327.7B), International (14.7B), Medical-Surgical (11.4B), and Prescription Technology (5.2B) segments | Diversified with strong Pharmaceutical Member (204.6B), GMPD (12.6B), and Other Operating segments (5.4B) |
| Profitability | Favorable ROIC (23.3%) with growing trend; however, low net margin (0.92%) and negative ROE (-158.87%) indicate operational challenges | Favorable ROIC (11.37%) with strong growth; low net margin (0.7%) and negative ROE (-56.13%) suggest profitability pressure |
| Innovation | Strong Prescription Technology Solutions segment supporting innovation | Smaller technology focus, less emphasis on innovation segments |
| Global presence | Significant International revenue (14.7B) supporting global footprint | Primarily U.S.-focused with limited international exposure |
| Market Share | Leading U.S. Pharmaceutical segment with 327.7B revenue indicating dominant market position | Large Pharmaceutical Member segment at 204.6B but smaller than McKesson |
Key takeaways: McKesson demonstrates a broader diversification and stronger global presence, supported by a very favorable economic moat and robust ROIC. Cardinal Health shows solid value creation with growing ROIC but operates with narrower diversification and lower profitability metrics. Both companies face margin pressures, requiring cautious risk management.
Risk Analysis
Below is a comparative risk table for McKesson Corporation (MCK) and Cardinal Health, Inc. (CAH) based on the most recent 2025 financial data and market conditions.
| Metric | McKesson Corporation (MCK) | Cardinal Health, Inc. (CAH) |
|---|---|---|
| Market Risk | Low beta (0.41) indicates lower volatility vs market | Moderate beta (0.65) suggests moderate market sensitivity |
| Debt level | Low debt-to-assets (9.83%), favorable debt/equity ratios | Higher debt-to-assets (17.59%) but still favorable debt metrics |
| Regulatory Risk | Moderate, healthcare distribution is heavily regulated | Moderate, operates in multiple regulated healthcare markets |
| Operational Risk | Strong asset turnover (4.78) and interest coverage (18.03) | Good asset turnover (4.19), lower interest coverage (10.77) |
| Environmental Risk | Limited direct exposure, but sustainability pressure growing | Similar limited direct exposure, increasing focus on sustainability |
| Geopolitical Risk | International segment in 13 European countries and Canada, moderate exposure | Global operations including Europe and Asia, slightly higher exposure |
In synthesis, both companies maintain favorable financial stability with manageable debt and operational efficiency. McKesson’s lower beta and stronger interest coverage reduce market and financial risk, while Cardinal Health’s broader geographic exposure introduces slightly higher geopolitical risk. Regulatory and environmental risks remain important considerations given the evolving healthcare landscape. Investors should monitor McKesson’s unfavorable profitability ratios and Cardinal’s higher leverage for potential vulnerabilities.
Which Stock to Choose?
McKesson Corporation (MCK) shows strong income growth with a 50.72% revenue increase over five years and favorable profitability metrics like 23.3% ROIC exceeding its 5.49% WACC. Despite some unfavorable ratios such as negative ROE and low liquidity, the company maintains a very favorable moat and solid debt management, earning a C+ rating.
Cardinal Health, Inc. (CAH) experiences more modest revenue growth of 37% over the same period but reports favorable income statement improvements, including an 86.71% net margin growth. Its financial ratios are generally favorable with a strong ROIC above WACC, indicating value creation, though it carries higher net debt ratios and an equally strong moat, with a similar C+ rating.
Investors focused on durable competitive advantages and efficient capital use might view both companies favorably, though those prioritizing stronger income growth and value creation could lean toward McKesson, while investors appreciating steady margin improvements and accelerating price trends might find Cardinal Health appealing.
Disclaimer: Investment carries a risk of loss of initial capital. The past performance is not a reliable indicator of future results. Be sure to understand risks before making an investment decision.
Go Further
I encourage you to read the complete analyses of McKesson Corporation and Cardinal Health, Inc. to enhance your investment decisions: