Home > Comparison > Financial Services > V vs COF
The strategic rivalry between Visa Inc. and Capital One Financial defines the competitive landscape of financial credit services. Visa operates as a global payments technology leader, focusing on digital transaction processing. In contrast, Capital One combines credit card issuance with diversified consumer and commercial banking. This analysis hinges on their differing growth drivers and capital structures, aiming to reveal which business model delivers superior risk-adjusted returns for a balanced portfolio.

Table of contents
Companies Overview
Visa and Capital One shape critical segments of the financial services landscape with distinct roles and scale.
Visa Inc.: Global Payments Powerhouse
Visa dominates as a payments technology company, earning primarily through its VisaNet transaction processing network. It facilitates digital payments worldwide among consumers, businesses, and financial institutions. In 2026, Visa focuses on expanding its digital payment platforms and enhancing partnerships, such as its strategic agreement with Ooredoo, to deliver seamless transaction experiences globally.
Capital One Financial Corporation: Diversified Banking Leader
Capital One operates as a financial services holding company, generating revenue from credit cards, consumer banking, and commercial banking segments. It targets consumers and businesses across the US, Canada, and UK. In 2026, its strategic emphasis lies on integrating digital banking services with physical channels like branches and cafés, blending innovation with traditional banking to capture diverse client needs.
Strategic Collision: Similarities & Divergences
Visa and Capital One compete on financial services innovation but diverge in scope and delivery. Visa’s model centers on an open, global payment network, while Capital One blends open digital banking with localized branch networks. Their primary battleground is consumer payment solutions and credit card offerings. Visa’s profile reflects a network-driven scale advantage; Capital One’s is built on diversified, multi-channel customer engagement.
Income Statement Comparison
The following data dissects the core profitability and scalability of both corporate engines to reveal who dominates the bottom line:
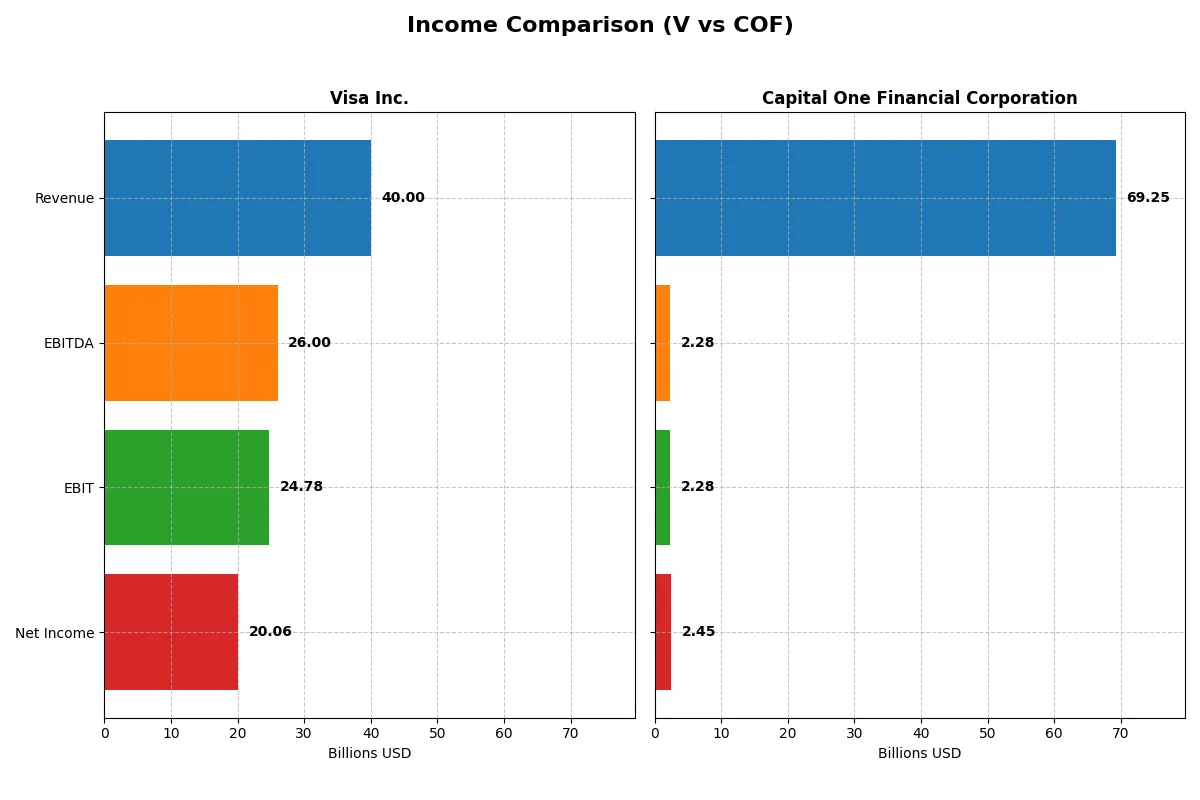
| Metric | Visa Inc. (V) | Capital One Financial Corporation (COF) |
|---|---|---|
| Revenue | 40B | 69.3B |
| Cost of Revenue | 7.86B | 36.47B |
| Operating Expenses | 8.15B | 30.5B |
| Gross Profit | 32.15B | 32.78B |
| EBITDA | 26B | 2.28B |
| EBIT | 24.78B | 2.28B |
| Interest Expense | 589M | 30.5B |
| Net Income | 20.06B | 2.45B |
| EPS | 10.22 | 4.03 |
| Fiscal Year | 2025 | 2025 |
Income Statement Analysis: The Bottom-Line Duel
This income statement comparison reveals which company runs a more efficient and profitable business engine in the current market environment.
Visa Inc. Analysis
Visa’s revenue climbed steadily from 24B in 2021 to 40B in 2025, with net income rising from 12.3B to 20.1B. Its gross margin remains robust at over 80%, while net margin stays strong around 50%. In 2025, Visa maintained momentum with 11% revenue growth, modest EBIT expansion, and a slight net margin dip, highlighting operational efficiency and solid profitability.
Capital One Financial Corporation Analysis
Capital One grew revenue sharply from 32B in 2021 to nearly 69B in 2025, but net income declined from 12B to 2.5B. Its gross margin is moderate at 47%, and net margin weak at 3.5%. The latest year shows a sharp drop in EBIT and net income margins despite revenue gains, signaling rising costs and deteriorating profitability that undermine operational efficiency.
Margin Strength vs. Revenue Scale
Visa clearly leads on profitability with high gross and net margins, reflecting superior cost control and business model strength. Capital One boasts impressive revenue growth but suffers significant net income and margin erosion. For investors prioritizing earnings quality and sustainable profits, Visa’s profile offers a more attractive risk-return balance.
Financial Ratios Comparison
These vital ratios act as a diagnostic tool to expose the underlying fiscal health, valuation premiums, and capital efficiency of the companies compared below:
| Ratios | Visa Inc. (V) | Capital One Financial Corporation (COF) |
|---|---|---|
| ROE | 52.91% | 0% |
| ROIC | 28.36% | 0% |
| P/E | 33.05 | 53.42 |
| P/B | 17.49 | 0 |
| Current Ratio | 1.08 | 0 |
| Quick Ratio | 1.08 | 0 |
| D/E | 0.66 | 0 |
| Debt-to-Assets | 25.27% | 0% |
| Interest Coverage | 40.74 | 0.07 |
| Asset Turnover | 0.40 | 0 |
| Fixed Asset Turnover | 9.44 | 0 |
| Payout Ratio | 23.10% | 57.31% |
| Dividend Yield | 0.70% | 1.07% |
| Fiscal Year | 2025 | 2025 |
Efficiency & Valuation Duel: The Vital Signs
Ratios act as a company’s financial DNA, revealing hidden risks and operational excellence often missed by headline figures alone.
Visa Inc.
Visa demonstrates outstanding profitability with a 52.9% ROE and a strong 50.1% net margin, signaling operational excellence. However, its valuation appears stretched, with a P/E of 33.05 and a P/B of 17.49. Visa returns value through modest dividends (0.7% yield) while maintaining favorable capital efficiency and strong interest coverage.
Capital One Financial Corporation
Capital One struggles with profitability, showing a low 3.5% net margin and zero ROE, highlighting operational challenges. Its P/E ratio is elevated at 53.42, indicating an expensive valuation despite a neutral dividend yield of 1.07%. The bank faces unfavorable liquidity and coverage ratios, reflecting heightened financial risk.
Premium Valuation vs. Operational Safety
Visa balances high profitability and operational safety against a premium valuation, while Capital One exhibits weak profitability and elevated risk. Investors seeking stability and efficiency will find Visa’s profile more appealing; those willing to tolerate risk for potential turnaround may consider Capital One.
Which one offers the Superior Shareholder Reward?
I find Visa’s distribution model more balanced, combining a modest 0.7% dividend yield with a sustainable 23% payout ratio and robust free cash flow coverage near 94%. Visa’s steady buybacks enhance shareholder value without risking growth. Capital One yields a higher 1.07%, but its payout ratio at 57% strains free cash flow, and its elevated leverage raises risk. Capital One’s buybacks are less consistent. For 2026, Visa offers a superior total return profile through disciplined capital allocation and sustainable shareholder rewards.
Comparative Score Analysis: The Strategic Profile
The radar chart reveals the fundamental DNA and trade-offs of Visa Inc. and Capital One Financial Corporation:
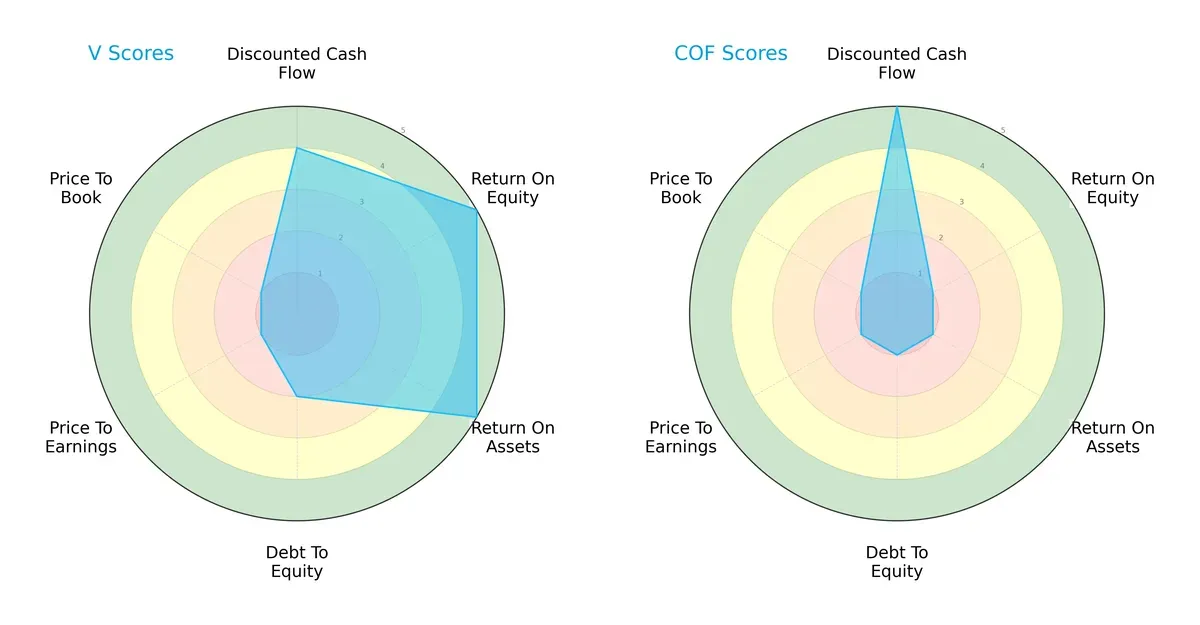
Visa shows strength in return on equity (ROE) and return on assets (ROA), scoring a top 5 in both, indicating superior operational efficiency. Capital One leads slightly in discounted cash flow (DCF) with a 5 versus Visa’s 4, reflecting better cash flow projections. However, Visa’s debt-to-equity score of 2 beats Capital One’s weak 1, signaling lower financial risk. Both firms suffer from very unfavorable price-to-earnings (PE) and price-to-book (PB) scores at 1, suggesting valuation concerns. Visa maintains a more balanced profile, while Capital One relies heavily on cash flow strength but struggles with profitability and leverage metrics.
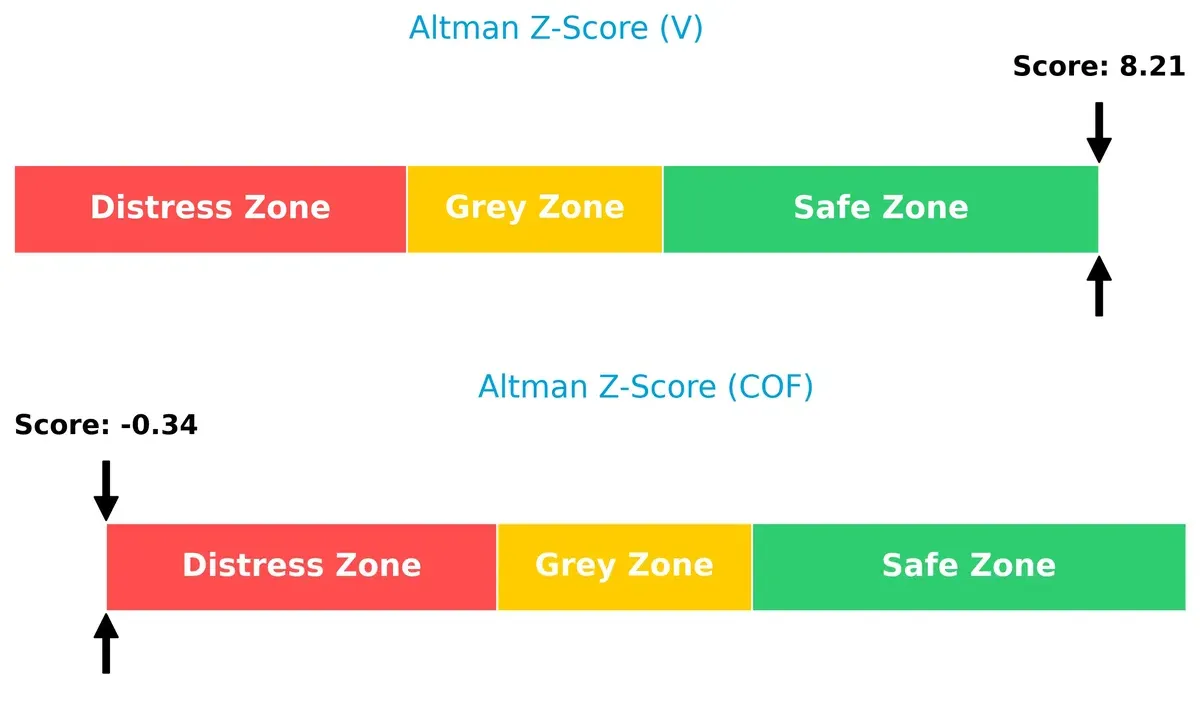
Bankruptcy Risk: Solvency Showdown
Visa’s Altman Z-Score of 8.21 places it comfortably in the safe zone, while Capital One’s -0.34 score lands in the distress zone. This stark contrast implies Visa’s strong financial stability and low bankruptcy risk in this market cycle, whereas Capital One faces significant solvency challenges:
Financial Health: Quality of Operations
Visa’s Piotroski F-Score of 7 denotes strong financial health, reflecting solid profitability, liquidity, and efficiency. Capital One’s score of 5 is average and flags some internal weaknesses:
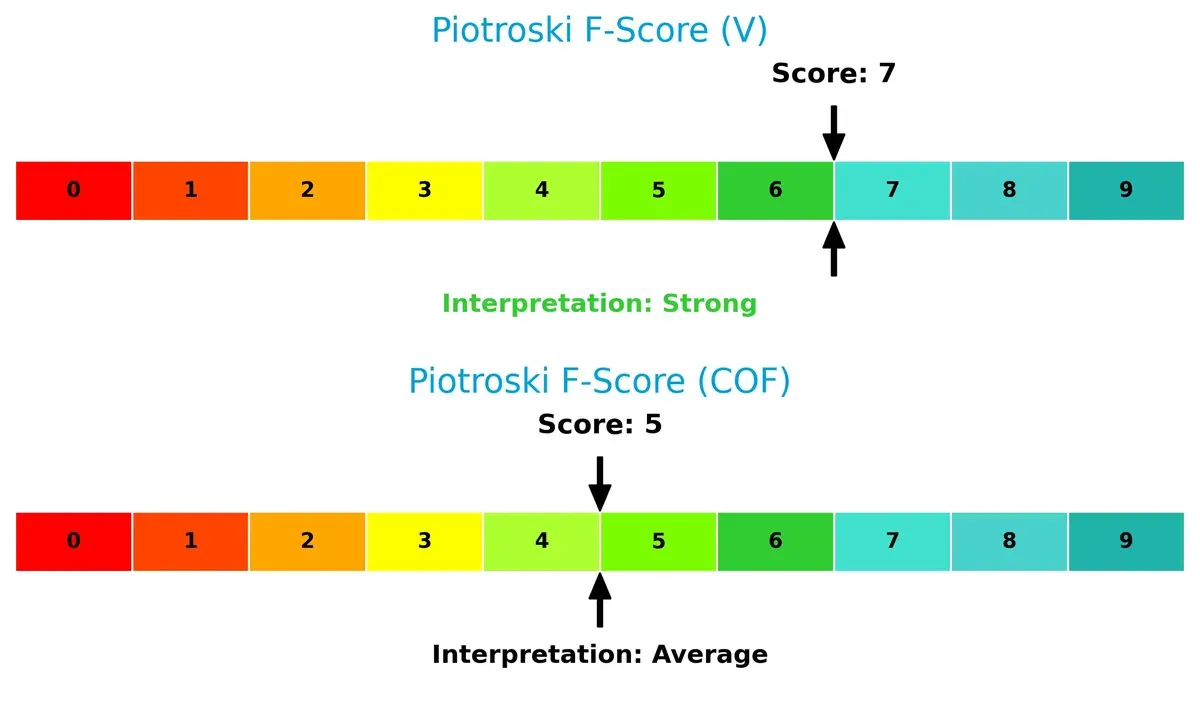
Visa clearly outperforms Capital One in operational quality and financial resilience. Investors should weigh these risks carefully when allocating capital between these two firms.
How are the two companies positioned?
This section dissects Visa and Capital One’s operational DNA by comparing revenue distribution and internal strengths and weaknesses. The goal is to confront their economic moats and identify which model offers the most resilient competitive advantage today.
Revenue Segmentation: The Strategic Mix
This visual comparison dissects how Visa Inc. and Capital One Financial Corporation diversify their income streams and where their primary sector bets lie:
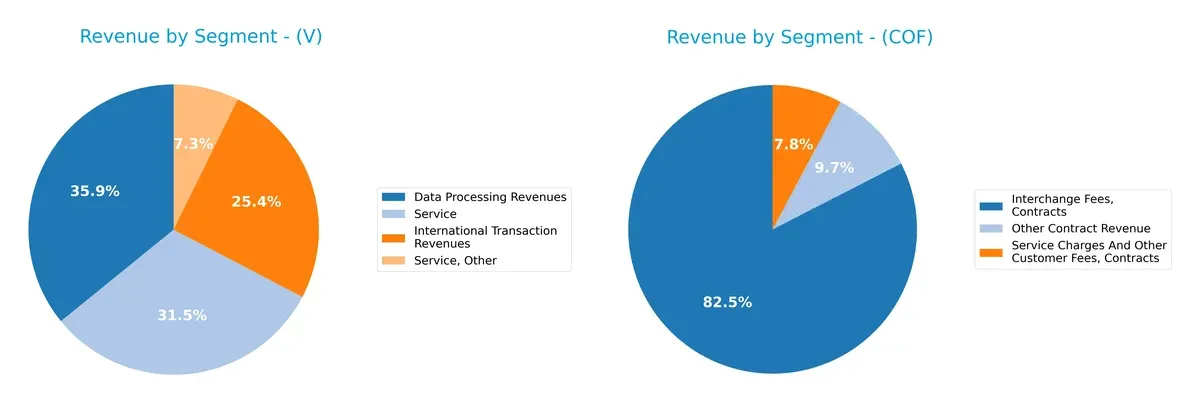
Visa anchors revenue in Data Processing ($20B) and International Transactions ($14B), showing strength in global payments infrastructure. Capital One pivots around Credit Card revenue ($26B), with notable Consumer Banking ($9.3B) and Commercial Banking ($3.5B) segments. Visa’s diversified payment services reduce concentration risk, while Capital One’s heavy reliance on credit cards exposes it to credit cycle volatility but leverages deep customer lending relationships.
Strengths and Weaknesses Comparison
This table compares the strengths and weaknesses of Visa Inc. and Capital One Financial Corporation:
Visa Inc. Strengths
- High profitability with 50.14% net margin and 52.91% ROE
- Strong ROIC at 28.36% exceeding WACC of 7.48%
- Favorable debt management with 25.27% debt-to-assets and 42.08 interest coverage
- Diverse revenue streams including data processing and international transactions
- Significant global presence generating $24.37B non-US revenue in 2025
Capital One Financial Corporation Strengths
- Favorable price-to-book ratio indicating undervaluation
- Debt-to-equity and debt-to-assets ratios favorable suggesting conservative leverage
- Large US market presence with $35.4B revenue concentration in 2023
- Diverse product revenue including credit card and consumer banking segments
Visa Inc. Weaknesses
- Elevated valuation multiples with PE of 33.05 and PB of 17.49
- Relatively low asset turnover at 0.4 indicating less efficient asset use
- Modest dividend yield of 0.7% may limit income appeal
- Moderate current ratio at 1.08 signals limited short-term liquidity buffer
Capital One Financial Corporation Weaknesses
- Unfavorable profitability metrics with 3.54% net margin and zero ROE/ROIC
- Poor liquidity ratios at zero current and quick ratio
- Very low interest coverage at 0.07 risking debt servicing ability
- Unfavorable asset turnover and fixed asset turnover at zero
- Limited international revenue of $1.39B compared to US focus
Visa’s strengths lie in superior profitability, efficient capital allocation, and global diversification. Capital One shows leverage discipline but suffers from weak profitability and liquidity. The contrast highlights differing strategic focuses and financial health profiles.
The Moat Duel: Analyzing Competitive Defensibility
A structural moat is the only reliable shield protecting long-term profits from relentless competition erosion. Let’s dissect how these firms defend their turf:
Visa Inc.: Network Effects Powerhouse
Visa’s dominant network effects create massive switching costs for merchants and consumers. Its 61.96% EBIT margin and 50% net margin confirm a robust, scalable model. Expansion into new payment platforms in 2026 should deepen this moat further.
Capital One Financial Corporation: Diversified Financial Services Moat
Capital One relies on diversified banking services and credit risk management as its moat. Unlike Visa, it shows weaker margin stability with just 3.29% EBIT margin and rising interest costs. Growth opportunities exist but are tempered by operational inefficiencies and margin pressure.
Network Effects vs. Diversified Banking: Who Commands the Moat?
Visa’s widening ROIC advantage and sustained margin dominance prove a far deeper moat than Capital One’s eroding profitability. Visa stands better equipped to defend market share and capitalize on future growth in 2026 and beyond.
Which stock offers better returns?
The past year shows Visa Inc. gaining 14.92%, though with decelerating momentum, while Capital One Financial surges 59.54%, accelerating and outperforming peers.
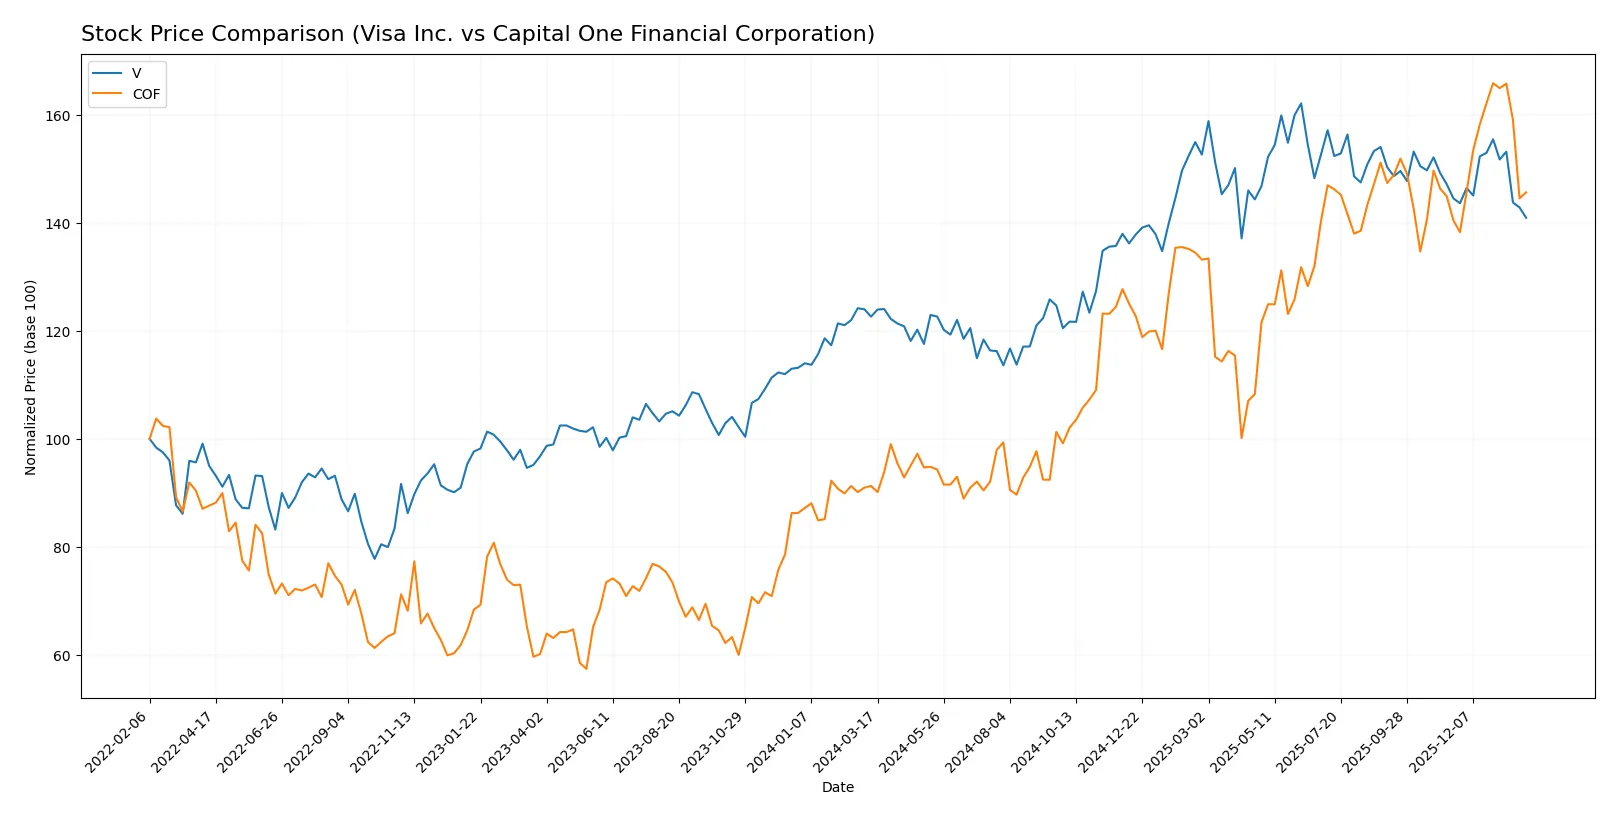
Trend Comparison
Visa Inc. exhibits a 14.92% bullish trend over 12 months with decelerating gains and a high price range between 259.46 and 370.22. Recent months show slight bearishness at -2.48%.
Capital One Financial displays a strong 59.54% bullish trend with accelerating momentum and volatility similar to Visa. Its recent trend remains positive, up 3.68%, indicating renewed strength.
Capital One’s stock outperforms Visa significantly, delivering the highest market returns over the past year with sustained acceleration and robust volume trends.
Target Prices
Analysts present a bullish consensus for Visa Inc. and Capital One Financial Corporation, reflecting optimism in financial credit services.
| Company | Target Low | Target High | Consensus |
|---|---|---|---|
| Visa Inc. | 160 | 425 | 378.73 |
| Capital One Financial Corporation | 218 | 300 | 273.62 |
Visa’s target consensus at 379 exceeds its current 322 price, signaling upside potential. Capital One’s consensus near 274 also suggests room to appreciate from its 219 price.

Don’t Let Luck Decide Your Entry Point
Optimize your entry points with our advanced ProRealTime indicators. You’ll get efficient buy signals with precise price targets for maximum performance. Start outperforming now!
How do institutions grade them?
Visa Inc. Grades
Here are recent institutional grades and rating actions for Visa Inc.:
| Grading Company | Action | New Grade | Date |
|---|---|---|---|
| RBC Capital | maintain | Outperform | 2026-01-30 |
| Macquarie | maintain | Outperform | 2026-01-30 |
| Morgan Stanley | maintain | Overweight | 2026-01-30 |
| Cantor Fitzgerald | maintain | Overweight | 2026-01-30 |
| B of A Securities | upgrade | Buy | 2025-12-11 |
| HSBC | upgrade | Buy | 2025-12-08 |
| Raymond James | maintain | Outperform | 2025-10-29 |
| UBS | maintain | Buy | 2025-10-29 |
| Macquarie | maintain | Outperform | 2025-10-29 |
| Baird | maintain | Outperform | 2025-10-06 |
Capital One Financial Corporation Grades
Here are recent institutional grades and rating actions for Capital One Financial Corporation:
| Grading Company | Action | New Grade | Date |
|---|---|---|---|
| Truist Securities | maintain | Buy | 2026-01-27 |
| Barclays | maintain | Overweight | 2026-01-26 |
| BTIG | maintain | Buy | 2026-01-23 |
| Morgan Stanley | maintain | Overweight | 2026-01-20 |
| JP Morgan | maintain | Neutral | 2026-01-12 |
| TD Cowen | maintain | Buy | 2026-01-08 |
| Barclays | maintain | Overweight | 2026-01-06 |
| Wells Fargo | maintain | Overweight | 2026-01-05 |
| Keefe, Bruyette & Woods | maintain | Outperform | 2026-01-02 |
| Citigroup | maintain | Buy | 2025-12-31 |
Which company has the best grades?
Visa Inc. generally holds stronger grades, with multiple “Outperform” and “Buy” ratings, including recent upgrades. Capital One Financial Corporation shows solid “Buy” and “Overweight” ratings but fewer upgrades. This may indicate greater analyst confidence in Visa’s near-term prospects.
Risks specific to each company
The following categories identify the critical pressure points and systemic threats facing both Visa Inc. and Capital One Financial Corporation in the 2026 market environment:
1. Market & Competition
Visa Inc.
- Dominates digital payments with a vast global network and strong brand moats. Faces intense fintech disruption risk.
Capital One Financial Corporation
- Operates in competitive credit and banking segments with exposure to margin pressure and fintech challengers.
2. Capital Structure & Debt
Visa Inc.
- Maintains moderate leverage (D/E 0.66) and strong interest coverage (42x), signaling financial stability.
Capital One Financial Corporation
- Exhibits weak financial structure; interest coverage near zero, with incomplete debt data indicating risk.
3. Stock Volatility
Visa Inc.
- Beta of 0.815 indicates lower volatility than market average, favoring risk-averse investors.
Capital One Financial Corporation
- Beta of 1.131 suggests higher volatility, exposing investors to greater market swings.
4. Regulatory & Legal
Visa Inc.
- Faces ongoing scrutiny over data privacy and antitrust concerns in multiple jurisdictions.
Capital One Financial Corporation
- Subject to banking regulations and compliance risks, especially post-2020 credit market reforms.
5. Supply Chain & Operations
Visa Inc.
- Relies on robust technology infrastructure with diversification mitigating operational disruptions.
Capital One Financial Corporation
- Operational risks linked to loan portfolios and branch network efficiency amid evolving consumer behavior.
6. ESG & Climate Transition
Visa Inc.
- Committed to sustainability with initiatives to reduce carbon footprint in data centers and offices.
Capital One Financial Corporation
- Increasing pressure to improve ESG disclosures and manage credit risks from climate change exposure.
7. Geopolitical Exposure
Visa Inc.
- Global footprint exposes it to geopolitical tensions and currency risks, but diversified revenue buffers impact.
Capital One Financial Corporation
- Primarily US-focused, limiting geopolitical risks but increasing sensitivity to domestic policy changes.
Which company shows a better risk-adjusted profile?
Visa Inc. faces its largest risk in regulatory scrutiny, yet its strong capital structure and operational resilience deliver a favorable risk-adjusted profile. Capital One’s critical risk lies in its fragile capital and earnings base combined with high operational leverage. Recent financial distress signals, such as a negative Altman Z-score and near-zero interest coverage, reinforce my caution. Visa’s lower volatility and superior financial health make it the safer choice in a turbulent 2026 financial landscape.
Final Verdict: Which stock to choose?
Visa Inc. wields unmatched efficiency as its superpower, delivering high returns on invested capital and consistent value creation. Its premium valuation and moderate liquidity metrics are points of vigilance. Visa suits aggressive growth portfolios comfortable with paying up for durable competitive advantages.
Capital One Financial Corporation holds a strategic moat in its consumer credit franchise and growth momentum. It offers higher recent price acceleration but exhibits weak profitability and financial stability compared to Visa. Capital One fits growth-at-a-reasonable-price (GARP) investors who tolerate operational volatility for upside potential.
If you prioritize durable competitive advantage and capital efficiency, Visa is the compelling choice due to its strong moat and consistent profitability. However, if you seek higher short-term momentum and are willing to accept financial risk, Capital One offers superior recent price acceleration. Each presents a distinct investment profile requiring prudent risk management.
Disclaimer: Investment carries a risk of loss of initial capital. The past performance is not a reliable indicator of future results. Be sure to understand risks before making an investment decision.
Go Further
I encourage you to read the complete analyses of Visa Inc. and Capital One Financial Corporation to enhance your investment decisions: