Home > Comparison > Financial Services > COF vs SYF
The strategic rivalry between Capital One Financial Corporation and Synchrony Financial shapes the competitive landscape of financial credit services. Capital One operates as a diversified banking powerhouse with credit, consumer, and commercial lending. Synchrony focuses on specialized consumer financing through retail partnerships and installment loans. This analysis weighs their divergent models to identify which offers superior risk-adjusted returns for a diversified portfolio in the evolving financial services sector.

Table of contents
Companies Overview
Capital One Financial Corporation and Synchrony Financial hold pivotal roles in the U.S. credit services industry, shaping consumer finance trends.
Capital One Financial Corporation: Diversified Financial Powerhouse
Capital One Financial Corporation stands as a leading financial services holding company in the U.S., Canada, and UK. It generates revenue primarily through its Credit Card, Consumer Banking, and Commercial Banking segments. In 2026, Capital One sharpened its digital channels and branch network, focusing on expanding consumer and commercial loans while enhancing treasury management services.
Synchrony Financial: Specialized Consumer Credit Leader
Synchrony Financial operates as a consumer financial services specialist in the United States, with a core business in credit products like private label, co-brand, and general-purpose credit cards. Its strategic emphasis in 2026 remains on growing point-of-sale financing and healthcare-related credit solutions, leveraging partnerships with retailers and service providers to deepen market penetration.
Strategic Collision: Similarities & Divergences
Both companies excel in credit services, but Capital One pursues a broad, multi-segment approach, while Synchrony focuses on specialized consumer credit through retail partnerships. They compete intensely in consumer lending, with Capital One’s broad banking footprint contrasting Synchrony’s niche product innovation. Their divergent models offer distinct investment profiles: Capital One’s scale and diversification versus Synchrony’s targeted credit specialization.
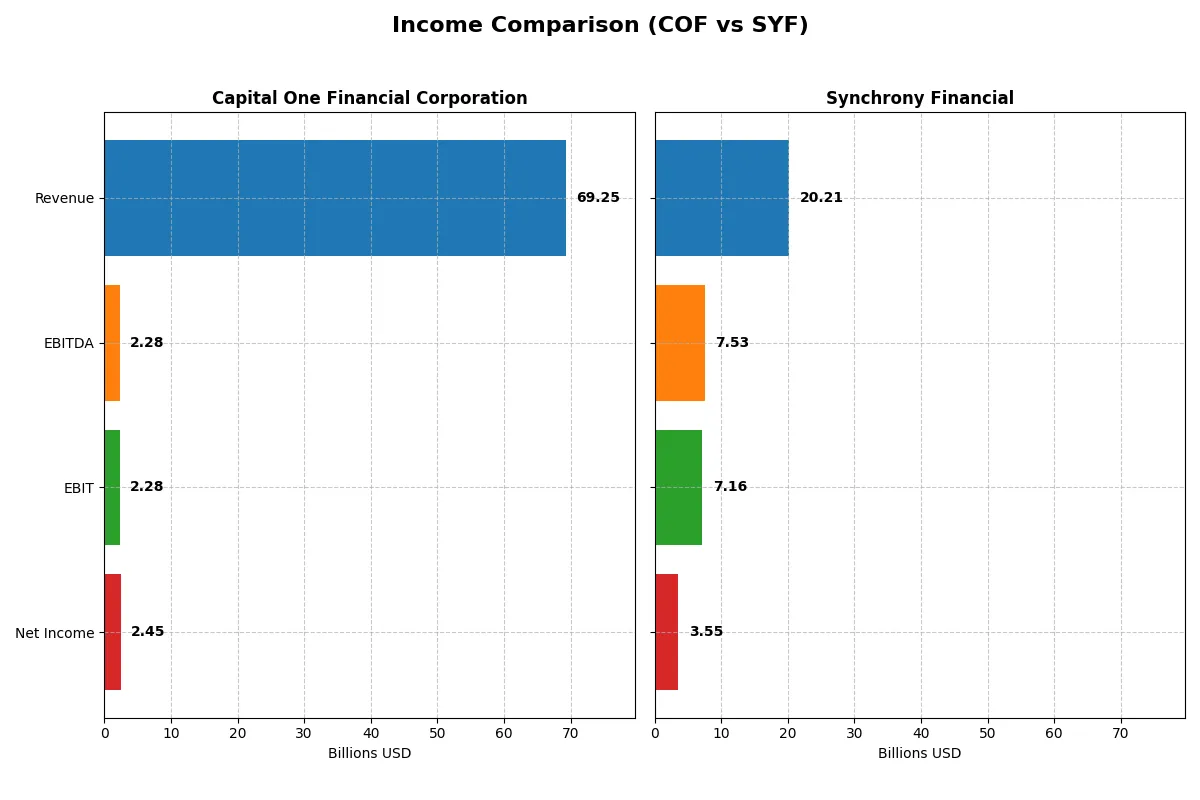
Income Statement Comparison
This data dissects the core profitability and scalability of both corporate engines to reveal who dominates the bottom line:
| Metric | Capital One Financial Corporation (COF) | Synchrony Financial (SYF) |
|---|---|---|
| Revenue | 69.3B | 20.2B |
| Cost of Revenue | 36.5B | 7.9B |
| Operating Expenses | 30.5B | 5.1B |
| Gross Profit | 32.8B | 12.3B |
| EBITDA | 2.3B | 7.5B |
| EBIT | 2.3B | 7.2B |
| Interest Expense | 30.5B | 4.1B |
| Net Income | 2.5B | 3.6B |
| EPS | 4.03 | 9.35 |
| Fiscal Year | 2025 | 2025 |
Income Statement Analysis: The Bottom-Line Duel
This income statement comparison reveals which company runs a more efficient and profitable corporate engine through recent performance and margin trends.
Capital One Financial Corporation Analysis
Capital One’s revenue surged 28% in 2025, reaching $69B, yet net income plunged 49% to $2.45B, signaling margin pressure. Gross margin remains solid at 47%, but net margin contracts to just 3.5%, reflecting escalating costs and a high interest expense ratio of 44%. The sharp EBIT decline indicates weakening operational efficiency.
Synchrony Financial Analysis
Synchrony’s revenue slipped 3% to $20.2B in 2025, but net income edged up 2% to $3.55B, boosting net margin to a healthy 17.6%. Its gross margin stands impressively high at 61%, with EBIT margin at 35%, demonstrating strong cost control and operational leverage. Despite slight revenue dip, Synchrony gains momentum through expanding profitability.
Margin Power vs. Revenue Scale
Synchrony delivers superior margin efficiency and operational profitability, while Capital One boasts far greater revenue but struggles with shrinking net income and margins. Synchrony’s robust margins and steady net income growth make it the clearer fundamental winner. Investors seeking quality earnings should favor Synchrony’s disciplined profit profile over Capital One’s scale-driven volatility.
Financial Ratios Comparison
These vital ratios act as a diagnostic tool to expose the underlying fiscal health, valuation premiums, and capital efficiency of the companies compared below:
| Ratios | Capital One Financial Corporation (COF) | Synchrony Financial (SYF) |
|---|---|---|
| ROE | 7.81% (2024) | 21.19% (2024) |
| ROIC | 3.74% (2024) | 9.36% (2024) |
| P/E | 14.37 (2024) | 7.37 (2024) |
| P/B | 1.12 (2024) | 1.55 (2024) |
| Current Ratio | 0.14 (2024) | 0.22 (2024) |
| Quick Ratio | 0.14 (2024) | 0.22 (2024) |
| D/E | 0.75 (2024) | 0.93 (2024) |
| Debt-to-Assets | 9.29% (2024) | 12.94% (2024) |
| Interest Coverage | 0.40 (2024) | 0.98 (2024) |
| Asset Turnover | 0.11 (2024) | 0.17 (2024) |
| Fixed Asset Turnover | 11.96 (2024) | N/A |
| Payout ratio | 24.42% (2024) | 13.43% (2024) |
| Dividend yield | 1.70% (2024) | 1.82% (2024) |
| Fiscal Year | 2024 | 2024 |
Efficiency & Valuation Duel: The Vital Signs
Financial ratios act as a company’s DNA, uncovering hidden risks and operational strengths that drive long-term value creation.
Capital One Financial Corporation
Capital One shows weak profitability with a 0% ROE and a low 3.54% net margin, signaling operational challenges. Its P/E ratio of 53.42 marks the stock as expensive relative to earnings. Dividend yield sits modestly at 1.07%, reflecting a cautious shareholder return approach amid unfavorable financial ratios.
Synchrony Financial
Synchrony delivers solid profitability with a 21.19% ROE and a strong 17.58% net margin, demonstrating operational efficiency. Its P/E of 8.41 suggests the stock trades at a reasonable valuation. A 1.38% dividend yield complements steady returns, supported by a balanced ratio profile mixing favorable and neutral signals.
Premium Valuation vs. Operational Safety
Capital One’s stretched valuation contrasts sharply with Synchrony’s efficient profitability and reasonable pricing. Synchrony offers a better balance of risk and reward through stronger earnings and valuation metrics. Investors seeking operational stability may find Synchrony’s profile more suitable.
Which one offers the Superior Shareholder Reward?
I compare Capital One Financial Corporation (COF) and Synchrony Financial (SYF) on dividends, payout ratios, and buybacks. COF yields 1.07% with a payout ratio of 57%, reflecting a moderate dividend policy but heavy payout strain. SYF yields 1.38% with a conservative 12% payout, preserving cash for growth. COF’s free cash flow coverage is opaque, raising sustainability concerns, while SYF maintains strong FCF coverage and a steady dividend increase. Both execute buybacks, but SYF’s lower leverage (debt-to-equity ~0.9 vs. COF’s 0.75-0.85) supports more sustainable capital returns. I see SYF’s balanced dividend and buyback model as more durable. For 2026 total return, SYF offers a superior, risk-adjusted shareholder reward.
Comparative Score Analysis: The Strategic Profile
The radar chart reveals the fundamental DNA and trade-offs of Capital One Financial Corporation and Synchrony Financial:
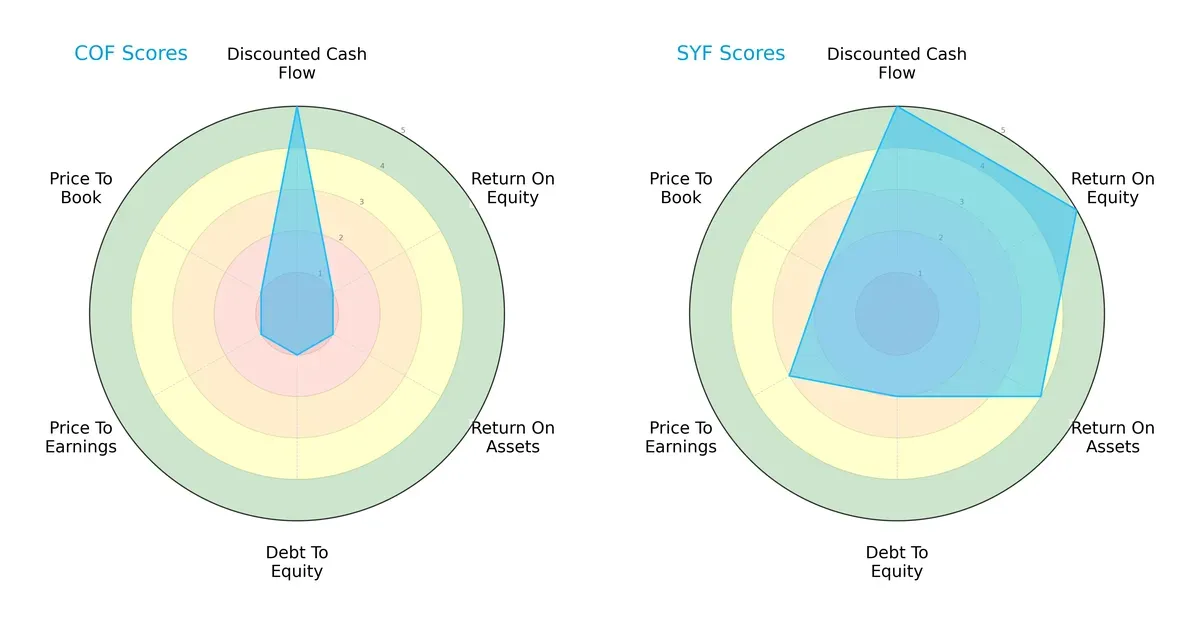
Synchrony Financial shows a balanced strength across ROE (5), ROA (4), and moderate debt-to-equity (2), indicating efficient profitability and manageable leverage. Capital One Financial relies heavily on its discounted cash flow score (5) but suffers from very weak profitability (ROE and ROA at 1) and poor valuation metrics (PE/PB at 1). Synchrony’s profile is more robust and diversified, while Capital One exhibits a narrow advantage focused on cash flow projections.
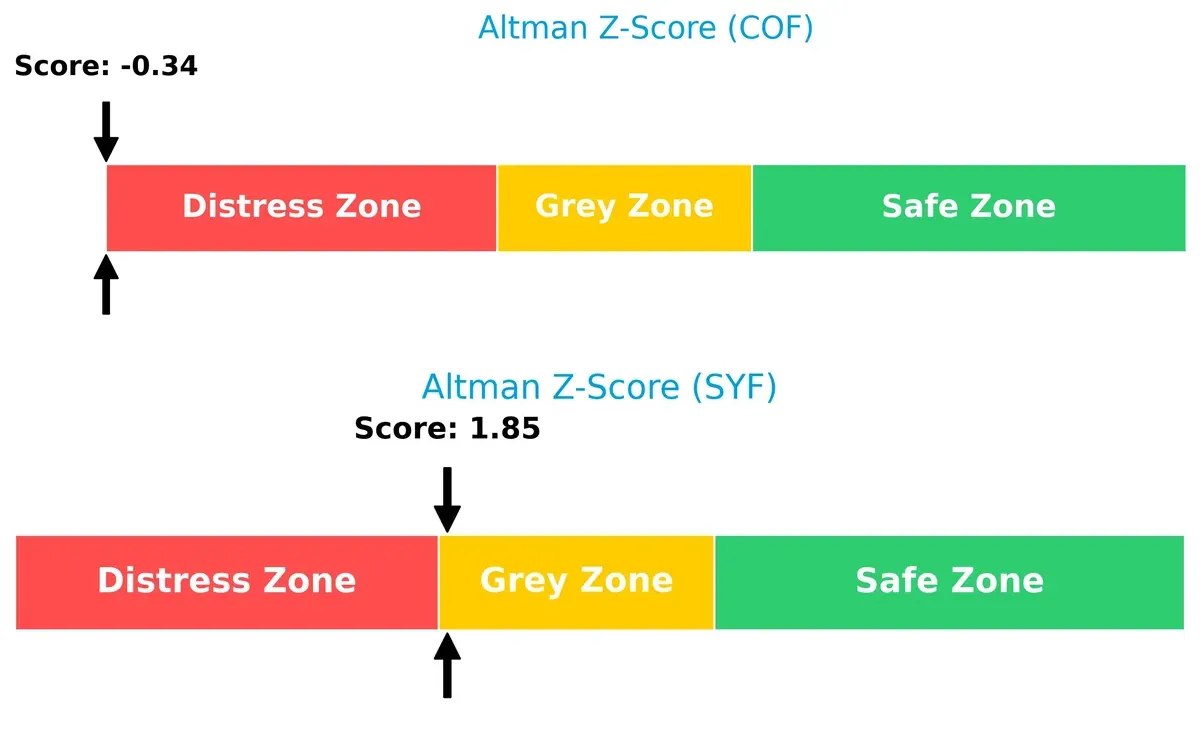
Bankruptcy Risk: Solvency Showdown
Synchrony Financial’s Altman Z-Score of 1.85 places it in the grey zone, suggesting moderate bankruptcy risk. Capital One’s score of -0.34 signals distress, indicating a high risk of financial distress and potential default:
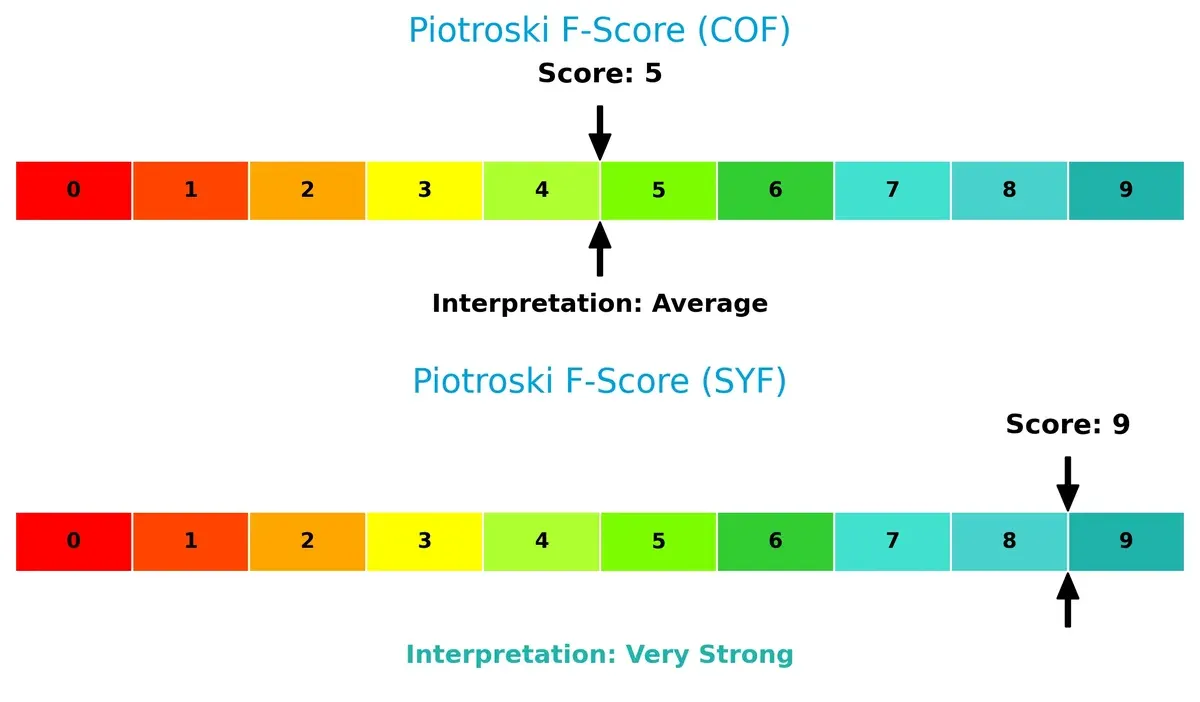
Financial Health: Quality of Operations
Synchrony Financial’s Piotroski F-Score at 9 signals very strong financial health and operational quality. Capital One’s score of 5 is average, raising red flags about its internal financial strength relative to Synchrony:
How are the two companies positioned?
This section dissects Capital One and Synchrony’s operational DNA by comparing their revenue distribution and internal dynamics. The goal: confront their economic moats to reveal which model offers the most resilient, sustainable competitive edge today.
Revenue Segmentation: The Strategic Mix
The following visual comparison dissects how Capital One Financial Corporation and Synchrony Financial diversify their income streams and where their primary sector bets lie:
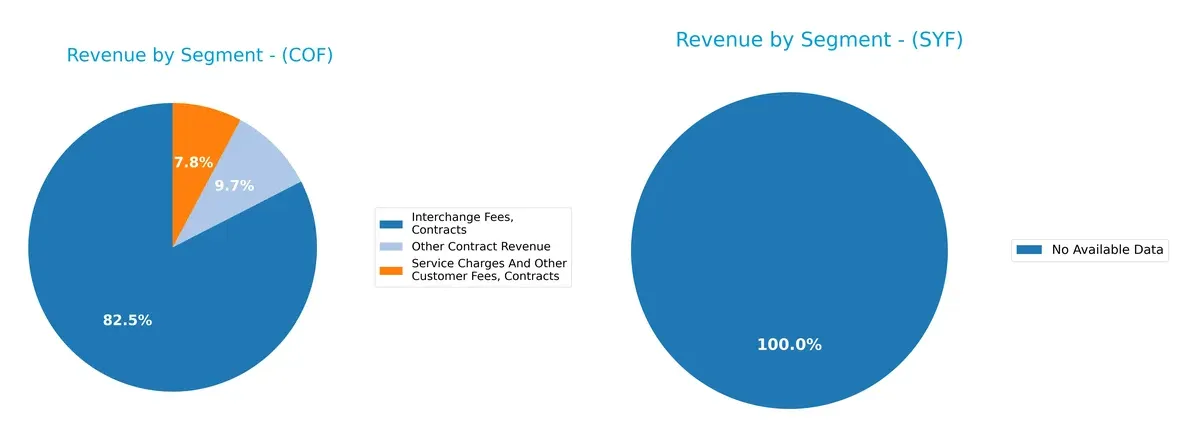
Capital One Financial anchors its revenue in Credit Card, generating $25.7B in 2023, dwarfing Consumer Banking at $9.3B and Commercial Banking at $3.5B. Synchrony Financial lacks available segmentation data. Capital One’s heavy credit card focus signals strong ecosystem lock-in but heightens concentration risk compared to a more balanced financial services portfolio. This mix demands vigilance as market cycles shift credit risk and regulatory landscapes.
Strengths and Weaknesses Comparison
This table compares the Strengths and Weaknesses of Capital One Financial Corporation (COF) and Synchrony Financial (SYF):
COF Strengths
- Diversified revenue streams from credit card, consumer, and commercial banking
- Strong U.S. market presence with $35.4B revenue
- Favorable debt to equity and debt to assets ratios
SYF Strengths
- High profitability with 17.58% net margin and 21.19% ROE
- Favorable P/E ratio at 8.41
- Strong quick ratio and favorable debt to assets ratio
COF Weaknesses
- Unfavorable profitability metrics including 0% ROE and ROIC
- High P/E at 53.42 indicates overvaluation risk
- Weak liquidity ratios with zero current and quick ratios
SYF Weaknesses
- Moderate profitability with neutral ROIC at 5.24%
- High current ratio of 18.05 flagged unfavorable for efficiency
- Interest coverage ratio low at 1.73, suggesting vulnerability
Both companies show distinct profiles: COF emphasizes diversified revenue and conservative leverage but struggles with profitability and liquidity. SYF demonstrates stronger profitability but faces efficiency and coverage challenges. These differences shape their strategic positioning in the financial sector.
The Moat Duel: Analyzing Competitive Defensibility
A structural moat is the only reliable shield protecting long-term profits from relentless competitive pressure. Here’s how Capital One and Synchrony stack up:
Capital One Financial Corporation: Broad Consumer Banking Moat
Capital One’s moat stems from diversified consumer and commercial banking services, leveraging scale and brand recognition. Despite revenue growth, profitability metrics signal margin pressure in 2026, challenging moat durability.
Synchrony Financial: Specialized Retail Credit Moat
Synchrony’s moat relies on strong partnerships with retailers and niche credit products. Its higher gross and EBIT margins reflect efficient capital use, but declining ROIC warns of eroding value amid rising competition.
Verdict: Scale and Diversification vs. Retail Focus
Capital One’s broader business mix offers a potentially wider moat, but profitability erosion weakens its defense. Synchrony’s deeper margin advantage is undermined by value destruction. Neither firm currently sustains a durable moat to fully fend off competition.
Which stock offers better returns?
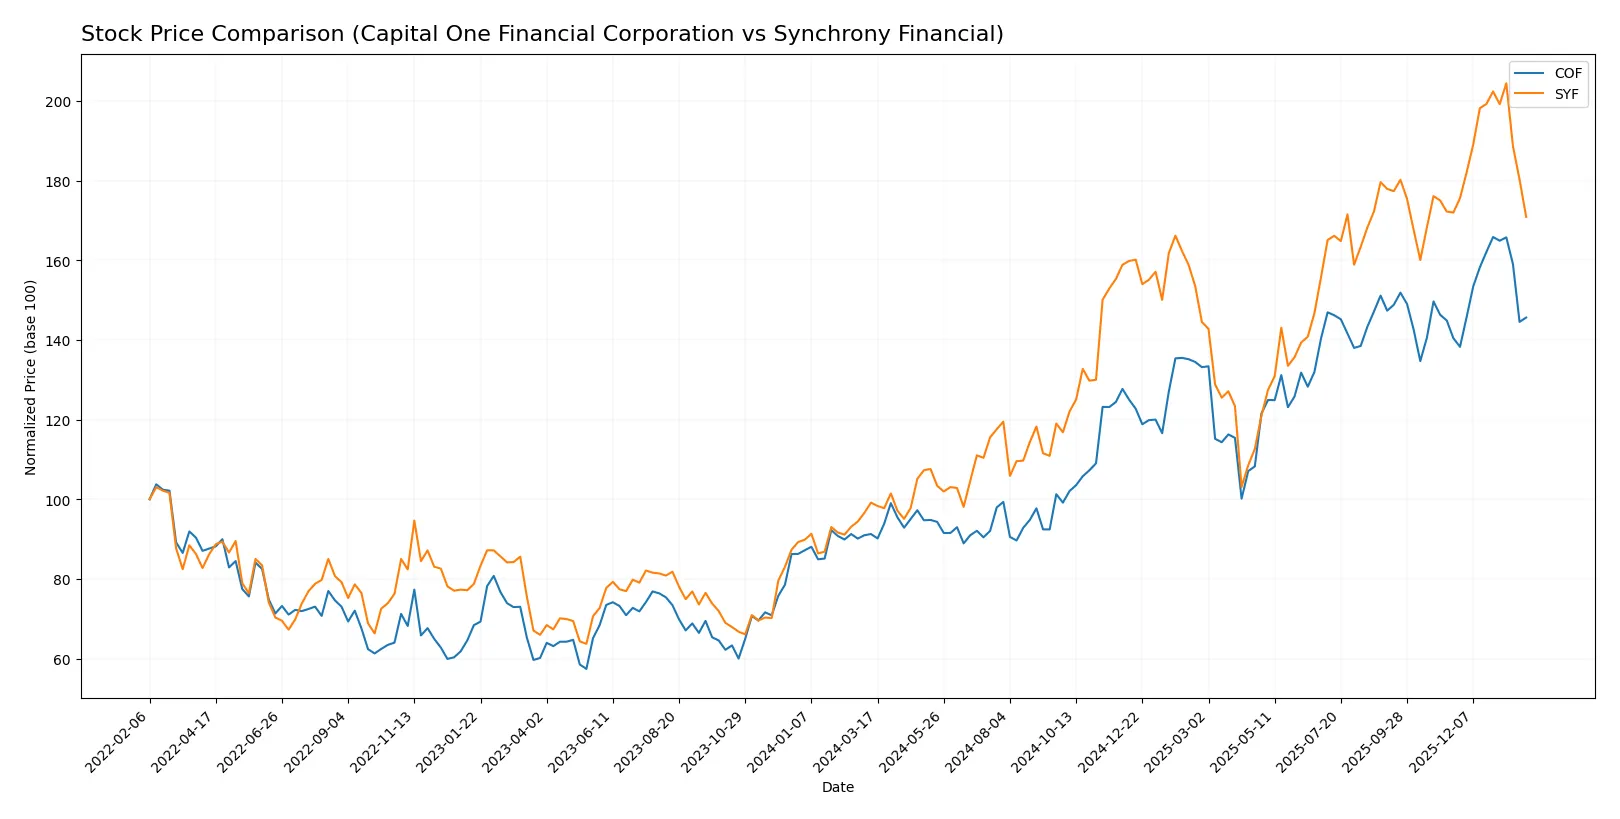
Over the past 12 months, Capital One Financial Corporation and Synchrony Financial showed strong upward price moves, with notable volatility and contrasting recent momentum patterns.
Trend Comparison
Capital One Financial Corporation’s stock surged 59.54% over the last year with accelerating gains and high volatility, hitting a peak of 249.32 and a low of 133.7. Recent months reveal a bullish 3.68% rise with moderate volatility.
Synchrony Financial’s shares rose 72.35% over the same period but with decelerating momentum and lower volatility, reaching a high of 86.89 and a low of 40.41. The recent trend slightly dipped by 0.63%, signaling neutral short-term movement.
Synchrony Financial outperformed Capital One over the year, despite a mild recent pullback, delivering the highest overall market performance among the two.
Target Prices
Analysts present a bullish consensus for Capital One Financial Corporation and Synchrony Financial.
| Company | Target Low | Target High | Consensus |
|---|---|---|---|
| Capital One Financial Corporation | 218 | 300 | 273.62 |
| Synchrony Financial | 81 | 100 | 90.33 |
The target consensus for Capital One at 273.62 implies a 25% upside from its current 218.93 price. Synchrony’s consensus of 90.33 suggests a strong rebound from 72.63, signaling robust analyst confidence.

Don’t Let Luck Decide Your Entry Point
Optimize your entry points with our advanced ProRealTime indicators. You’ll get efficient buy signals with precise price targets for maximum performance. Start outperforming now!
How do institutions grade them?
The following tables summarize recent institutional grades for Capital One Financial Corporation and Synchrony Financial:
Capital One Financial Corporation Grades
This table lists the latest grades issued by major financial institutions for Capital One Financial Corporation.
| Grading Company | Action | New Grade | Date |
|---|---|---|---|
| Truist Securities | Maintain | Buy | 2026-01-27 |
| Barclays | Maintain | Overweight | 2026-01-26 |
| BTIG | Maintain | Buy | 2026-01-23 |
| Morgan Stanley | Maintain | Overweight | 2026-01-20 |
| JP Morgan | Maintain | Neutral | 2026-01-12 |
| TD Cowen | Maintain | Buy | 2026-01-08 |
| Barclays | Maintain | Overweight | 2026-01-06 |
| Wells Fargo | Maintain | Overweight | 2026-01-05 |
| Keefe, Bruyette & Woods | Maintain | Outperform | 2026-01-02 |
| Citigroup | Maintain | Buy | 2025-12-31 |
Synchrony Financial Grades
This table lists the latest grades issued by major financial institutions for Synchrony Financial.
| Grading Company | Action | New Grade | Date |
|---|---|---|---|
| Truist Securities | Maintain | Hold | 2026-01-29 |
| BTIG | Maintain | Buy | 2026-01-28 |
| RBC Capital | Maintain | Sector Perform | 2026-01-28 |
| Barclays | Maintain | Overweight | 2026-01-28 |
| JP Morgan | Maintain | Neutral | 2026-01-28 |
| JP Morgan | Maintain | Neutral | 2026-01-12 |
| TD Cowen | Maintain | Buy | 2026-01-08 |
| Barclays | Maintain | Overweight | 2026-01-06 |
| Wells Fargo | Maintain | Overweight | 2026-01-05 |
| Keefe, Bruyette & Woods | Maintain | Outperform | 2026-01-02 |
Which company has the best grades?
Capital One Financial Corporation has consistently received stronger grades, including multiple Buy and Overweight ratings. Synchrony Financial’s grades are mixed, with more Hold and Neutral ratings. This difference may influence investor confidence and portfolio positioning.
Risks specific to each company
The following tables identify the critical pressure points and systemic threats facing both firms in the 2026 market environment:
1. Market & Competition
Capital One Financial Corporation
- Faces intense competition in credit services with pressure on net margins and ROE.
Synchrony Financial
- Holds strong market niche in consumer financing, benefiting from favorable profitability metrics.
2. Capital Structure & Debt
Capital One Financial Corporation
- Exhibits concerning debt metrics with very low interest coverage and weak debt-to-equity scores.
Synchrony Financial
- Maintains moderate debt levels but interest coverage remains marginally weak, requiring cautious monitoring.
3. Stock Volatility
Capital One Financial Corporation
- Beta at 1.13 signals moderate market sensitivity and volatility.
Synchrony Financial
- Higher beta of 1.43 indicates elevated stock price volatility relative to the market.
4. Regulatory & Legal
Capital One Financial Corporation
- Operates across US, Canada, UK with exposure to diverse regulatory regimes that can increase compliance costs.
Synchrony Financial
- Concentrated US operations reduce international regulatory risk but increase domestic policy exposure.
5. Supply Chain & Operations
Capital One Financial Corporation
- Large employee base and branch network add complexity and operational risks.
Synchrony Financial
- More streamlined operations with fewer employees but reliant on partnerships with retailers and service providers.
6. ESG & Climate Transition
Capital One Financial Corporation
- Increasing pressure to meet ESG standards could raise costs given size and geographic spread.
Synchrony Financial
- Smaller scale may ease ESG compliance but exposure to retail sectors sensitive to climate policies.
7. Geopolitical Exposure
Capital One Financial Corporation
- International presence exposes it to geopolitical risks, including currency fluctuations and trade tensions.
Synchrony Financial
- Primarily US-focused, limiting geopolitical risk but susceptible to domestic political shifts.
Which company shows a better risk-adjusted profile?
Synchrony Financial faces its largest risk in stock volatility and capital structure, yet delivers stronger profitability and financial health metrics. Capital One’s most impactful risk lies in its weak capital structure and poor financial ratios, signaling distress risk. Synchrony’s Altman Z-Score in the grey zone contrasts sharply with Capital One’s distress zone rating, underscoring a safer, more balanced risk profile for Synchrony in 2026.
Final Verdict: Which stock to choose?
Capital One Financial Corporation’s superpower lies in its ability to generate significant free cash flow, acting as a resilient cash machine. However, its declining profitability and stretched balance sheet warrant caution. It fits portfolios aiming for aggressive growth with a tolerance for volatility and risk.
Synchrony Financial’s strategic moat is its strong profitability and efficient capital use, delivering consistent returns supported by a solid recurring revenue base. It offers better financial stability than Capital One, suiting investors seeking growth at a reasonable price with a preference for steadier fundamentals.
If you prioritize high cash generation and are comfortable with elevated risk, Capital One could be the compelling choice due to its cash flow prowess. However, if you seek stronger profitability and relative safety, Synchrony Financial offers better stability and a more favorable risk-return profile. Both present analytical scenarios worth considering within distinct investor strategies.
Disclaimer: Investment carries a risk of loss of initial capital. The past performance is not a reliable indicator of future results. Be sure to understand risks before making an investment decision.
Go Further
I encourage you to read the complete analyses of Capital One Financial Corporation and Synchrony Financial to enhance your investment decisions: