Home > Comparison > Financial Services > MA vs COF
The strategic rivalry between Mastercard Incorporated and Capital One Financial Corporation shapes the evolution of the financial services sector. Mastercard excels as a technology-driven payment processor with global reach, while Capital One operates as a diversified financial services holding company with a strong consumer banking presence. This head-to-head juxtaposes a high-margin tech innovator against a capital-intensive lender. This analysis aims to identify which corporate model delivers superior risk-adjusted returns for a diversified portfolio.

Table of contents
Companies Overview
Mastercard and Capital One dominate key segments of the financial services industry with distinct operational models and market strategies.
Mastercard Incorporated: A Global Payment Technology Leader
Mastercard operates as a technology-driven payment processor, generating revenue by facilitating transaction authorization, clearing, and settlement worldwide. Its core strength lies in delivering integrated payment products and value-added services, including cyber intelligence and digital identity platforms. In 2026, Mastercard emphasizes expanding open banking capabilities and enhancing e-commerce payment solutions to sustain its competitive edge.
Capital One Financial Corporation: Diversified Financial Services Provider
Capital One focuses on consumer and commercial banking, with revenue driven by credit cards, loans, and deposit products across the US, Canada, and the UK. It serves diverse client segments through digital channels and physical branches, blending traditional banking with innovative online services. The 2026 strategy prioritizes digital expansion and customer experience improvements in core markets to strengthen its multi-segment portfolio.
Strategic Collision: Similarities & Divergences
Mastercard champions an open, technology-first payment ecosystem, while Capital One blends banking with credit services under a more traditional yet digitally evolving model. Their primary battleground is the consumer payments space, where Mastercard’s network effect meets Capital One’s customer lending relationships. These differences create distinct investment profiles: Mastercard as a pure-play tech enabler and Capital One as a diversified banking franchise with credit risk exposure.
Income Statement Comparison
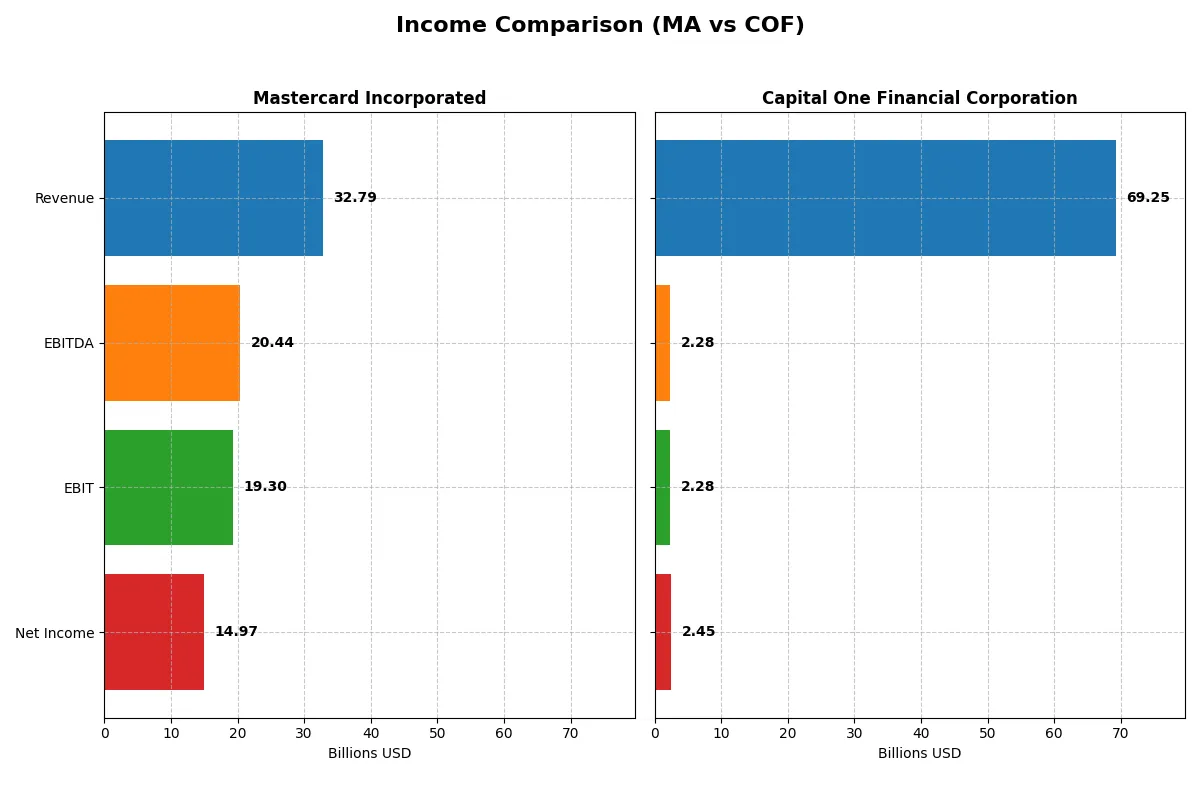
This data dissects the core profitability and scalability of both corporate engines to reveal who dominates the bottom line:
| Metric | Mastercard (MA) | Capital One (COF) |
|---|---|---|
| Revenue | 32.8B | 69.3B |
| Cost of Revenue | 0 | 36.5B |
| Operating Expenses | 13.9B | 30.5B |
| Gross Profit | 0 | 32.8B |
| EBITDA | 20.4B | 2.3B |
| EBIT | 19.3B | 2.3B |
| Interest Expense | 722M | 30.5B |
| Net Income | 14.97B | 2.45B |
| EPS | 16.54 | 4.03 |
| Fiscal Year | 2025 | 2025 |
Income Statement Analysis: The Bottom-Line Duel
This income statement comparison reveals which company operates its business with greater efficiency and profit conversion.
Mastercard Incorporated Analysis
Mastercard shows strong revenue growth from $18.9B in 2021 to $32.8B in 2025, with net income rising from $8.7B to $14.97B. Its net margin remains robust at 45.65% in 2025, highlighting excellent profitability. Despite a zero gross profit reported in 2025 (an anomaly), Mastercard’s EBIT margin of 58.86% signals exceptional operational efficiency and momentum.
Capital One Financial Corporation Analysis
Capital One’s revenue surged from $32B in 2021 to $69.3B in 2025, but net income fell sharply from $12B to $2.45B. The net margin slipped to a thin 3.54%, reflecting weaker profitability. Although gross margin held firm at 47.33%, EBIT margin dropped to 3.29%, signaling deteriorating operating efficiency and pressure on earnings despite top-line expansion.
Efficiency and Profitability: Mastercard’s Margin Mastery vs. Capital One’s Revenue Growth
Mastercard outpaces Capital One clearly on profitability and operational efficiency, sustaining high margins and steady net income growth. Capital One’s revenue scale impresses but fails to translate into profit, raising concerns about cost control and interest expenses. For investors, Mastercard’s consistent margin power offers a more attractive profile amid current market conditions.
Financial Ratios Comparison
These vital ratios act as a diagnostic tool to expose the underlying fiscal health, valuation premiums, and capital efficiency of the companies compared below:
| Ratios | Mastercard (MA) | Capital One (COF) |
|---|---|---|
| ROE | 193.5% | 0% |
| ROIC | 48.6% | 0% |
| P/E | 34.5 | 53.4 |
| P/B | 66.8 | 0 |
| Current Ratio | 1.03 | 0 |
| Quick Ratio | 1.03 | 0 |
| D/E | 2.46 | 0 |
| Debt-to-Assets | 35.1% | 0 |
| Interest Coverage | 26.9 | 0.07 |
| Asset Turnover | 0.61 | 0 |
| Fixed Asset Turnover | 14.2 | 0 |
| Payout Ratio | 18.4% | 57.3% |
| Dividend Yield | 0.53% | 1.07% |
| Fiscal Year | 2025 | 2025 |
Efficiency & Valuation Duel: The Vital Signs
Financial ratios serve as a company’s DNA, unveiling hidden risks and operational excellence beyond headline figures.
Mastercard Incorporated
Mastercard demonstrates outstanding profitability with a 193% ROE and a robust 45.65% net margin, signaling operational efficiency. Its valuation appears stretched, with a P/E of 34.5 and a high price-to-book of 66.8. Shareholders receive modest dividends (0.53% yield), reflecting a focus on reinvesting cash flow into growth rather than payout.
Capital One Financial Corporation
Capital One shows weak profitability, with a near-zero ROE and a thin 3.54% net margin, indicating operational challenges. The stock is expensive at a P/E of 53.4 despite limited earnings power. Dividend yield is moderate at 1.07%, but other ratios reveal significant financial weaknesses, including poor liquidity and interest coverage.
Premium Valuation vs. Operational Safety
Mastercard offers a clear edge with strong returns and operational strength despite a premium valuation. Capital One’s ratios highlight riskier fundamentals and stretched profitability. Investors prioritizing growth and financial stability may lean toward Mastercard, while those tolerant of risk face a more speculative Capital One profile.
Which one offers the Superior Shareholder Reward?
I compare Mastercard (MA) and Capital One (COF) on dividends, payout ratios, and buybacks. Mastercard yields 0.53% with a 18.4% payout, sustaining dividends well above free cash flow. Capital One offers a higher 1.07% yield with a 57.3% payout, signaling less cushion. Mastercard’s aggressive buybacks and lower payout ratio suggest a more sustainable model. Capital One’s higher yield seems riskier amid volatile margins and leverage. I conclude Mastercard delivers a superior total shareholder return profile in 2026 due to balanced distributions and robust capital allocation.
Comparative Score Analysis: The Strategic Profile
The radar chart reveals the fundamental DNA and trade-offs of Mastercard and Capital One, highlighting their core financial strengths and vulnerabilities:
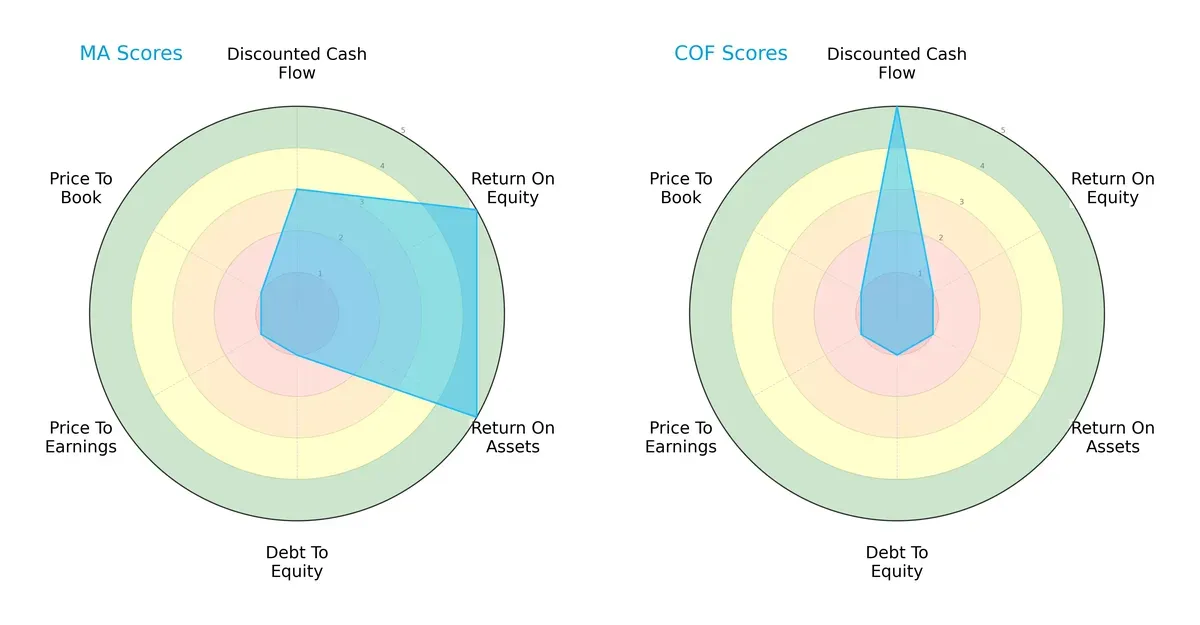
Mastercard demonstrates superior operational efficiency with top ROE and ROA scores (5 each) versus Capital One’s weak 1s. However, Mastercard’s balance sheet is riskier with a very unfavorable debt-to-equity score of 1, matching Capital One’s. Capital One excels in discounted cash flow (DCF) valuation with a score of 5, indicating better future cash flow prospects. Mastercard’s valuation metrics (P/E and P/B) are very unfavorable at 1, similar to Capital One, suggesting both trade at premium or stretched multiples. Overall, Mastercard presents a more balanced and profitable profile, while Capital One relies heavily on its DCF strength amid operational weaknesses.
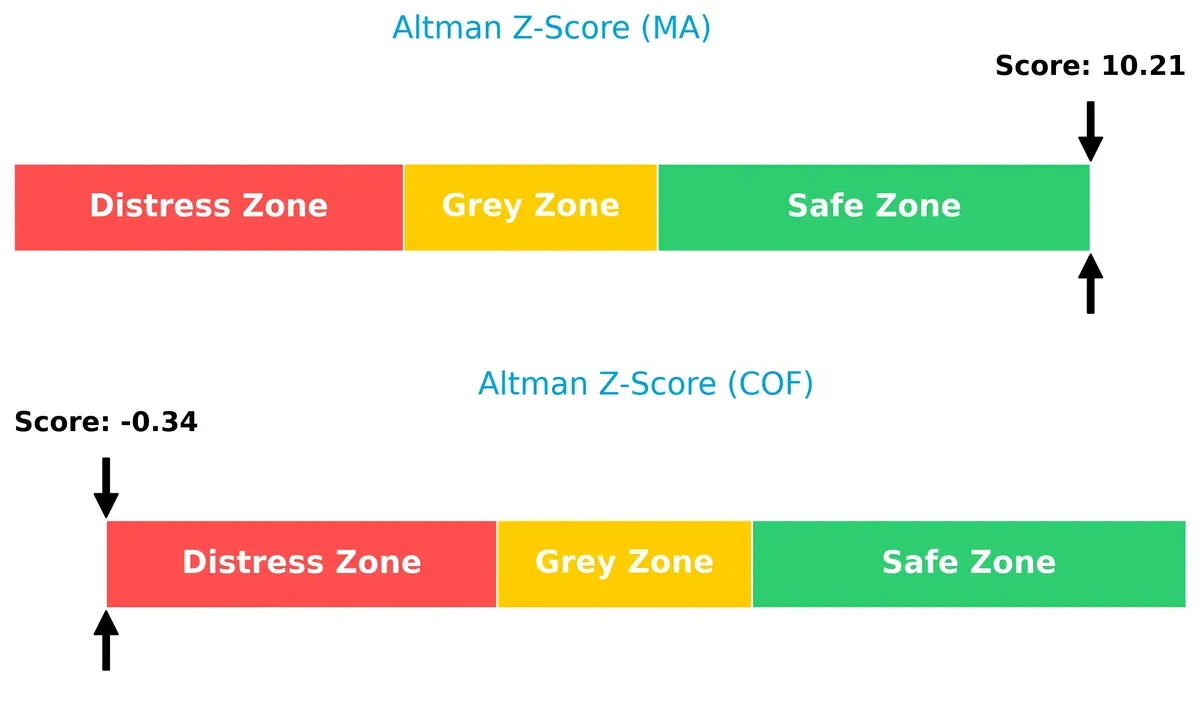
Bankruptcy Risk: Solvency Showdown
Mastercard’s Altman Z-Score of 10.2 signals a robust solvency position, far above Capital One’s distress zone score of -0.34, implying significantly higher bankruptcy risk for Capital One:
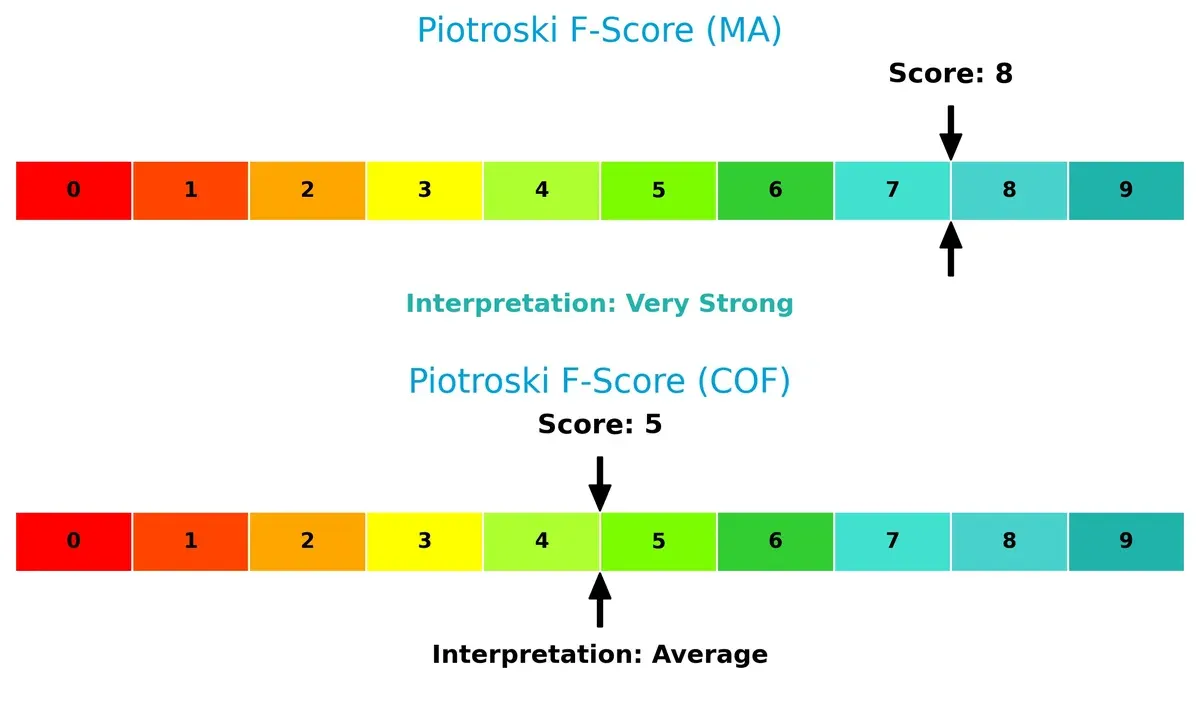
Financial Health: Quality of Operations
Mastercard’s Piotroski F-Score of 8 marks it as very strong financially, contrasting with Capital One’s average score of 5, which raises red flags about operational consistency and internal financial health:
How are the two companies positioned?
This section dissects the operational DNA of Mastercard and Capital One by comparing their revenue distribution and internal dynamics. The goal is to confront their economic moats to reveal which model delivers the most resilient competitive advantage today.
Revenue Segmentation: The Strategic Mix
The following visual comparison dissects how Mastercard Incorporated and Capital One Financial Corporation diversify their income streams and where their primary sector bets lie:
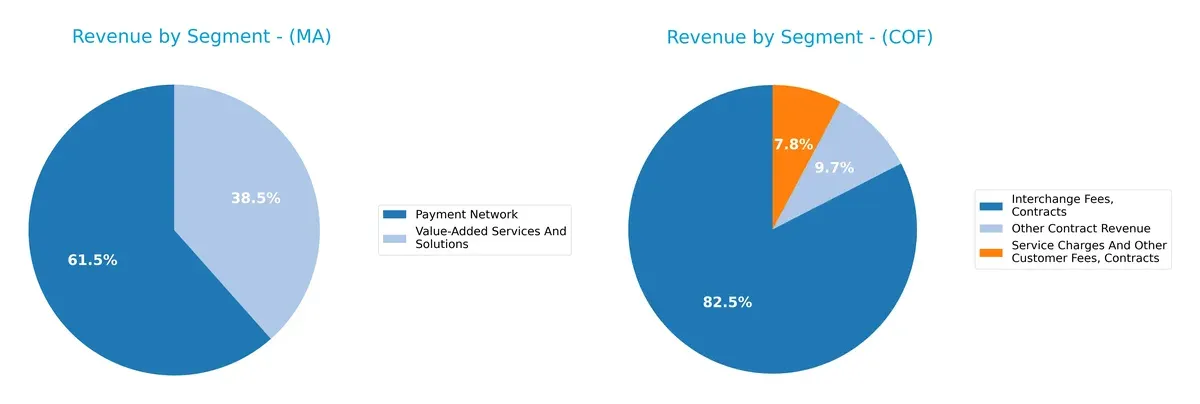
Mastercard pivots on two key segments, with Payment Network at $17.3B and Value-Added Services at $10.8B, showing a focused yet dual revenue base. Capital One leans heavily on Credit Card revenue, $25.7B in 2024, dwarfing its Consumer Banking ($9.3B) and Commercial Banking ($3.5B) segments. Mastercard’s mix implies strong ecosystem lock-in, while Capital One’s concentration on credit cards heightens exposure to credit cycle risks.
Strengths and Weaknesses Comparison
This table compares the strengths and weaknesses of Mastercard and Capital One based on diversification, profitability, financials, innovation, global presence, and market share:
Mastercard Strengths
- Strong profitability with 46% net margin and 193% ROE
- Favorable ROIC vs. WACC at 48.6%
- Balanced revenue from payment networks and value-added services
- Significant international revenue of $15.8B in 2024
- High interest coverage ratio at 26.7
- Consistent asset turnover and fixed asset efficiency
Capital One Strengths
- Favorable debt metrics with zero debt-to-equity and debt-to-assets
- Positive PB ratio indicating undervaluation potential
- Large U.S. consumer banking and credit card revenue streams ($35.4B combined in 2023)
- Neutral dividend yield at 1.07%
- Presence in commercial banking alongside credit card services
Mastercard Weaknesses
- Unfavorable valuation multiples with PE at 34.5 and PB at 66.8
- Elevated debt-to-equity ratio of 2.46
- Narrow current ratio at 1.03 suggests limited liquidity buffer
- Low dividend yield of 0.53% may deter income-focused investors
- Moderate concentration in international markets vs. North America
Capital One Weaknesses
- Weak profitability with 3.54% net margin and zero ROE/ROIC
- Poor liquidity ratios with current and quick ratios at zero
- Very low interest coverage at 0.07 indicates risk in servicing debt
- Unfavorable asset turnover and fixed asset turnover at zero
- Heavy reliance on U.S. market with limited international revenue ($1.4B in 2023)
Mastercard displays robust profitability and global diversification but faces valuation and leverage concerns. Capital One struggles with profitability and liquidity, despite strong debt management and U.S. market dominance. These contrasts highlight differing strategic and financial profiles.
The Moat Duel: Analyzing Competitive Defensibility
A durable structural moat protects long-term profits from competitive erosion. Without it, gains quickly vanish under market pressure:
Mastercard Incorporated: Network Effects Powerhouse
Mastercard’s dominant network effect fuels consistent high ROIC near 41%, driving margin stability and value creation. Its expanding digital payment platforms in 2026 deepen this moat amid fintech disruption.
Capital One Financial Corporation: Customer Data Intangible Assets
Capital One relies on customer data and brand trust, but declining ROIC and margin pressure reveal a weakening moat. Opportunities in digital banking exist, yet competition and rising costs threaten its edge.
Network Effects vs. Intangible Assets: Who Defends Better?
Mastercard’s network effect creates a wider, more durable moat than Capital One’s data-driven advantage. Mastercard is clearly better positioned to defend and grow market share through scalable, high-return assets.
Which stock offers better returns?
The past year saw Mastercard’s shares rise steadily before recent slight weakening, while Capital One’s stock surged with accelerating momentum, reflecting distinct trading dynamics in the 12-month span.
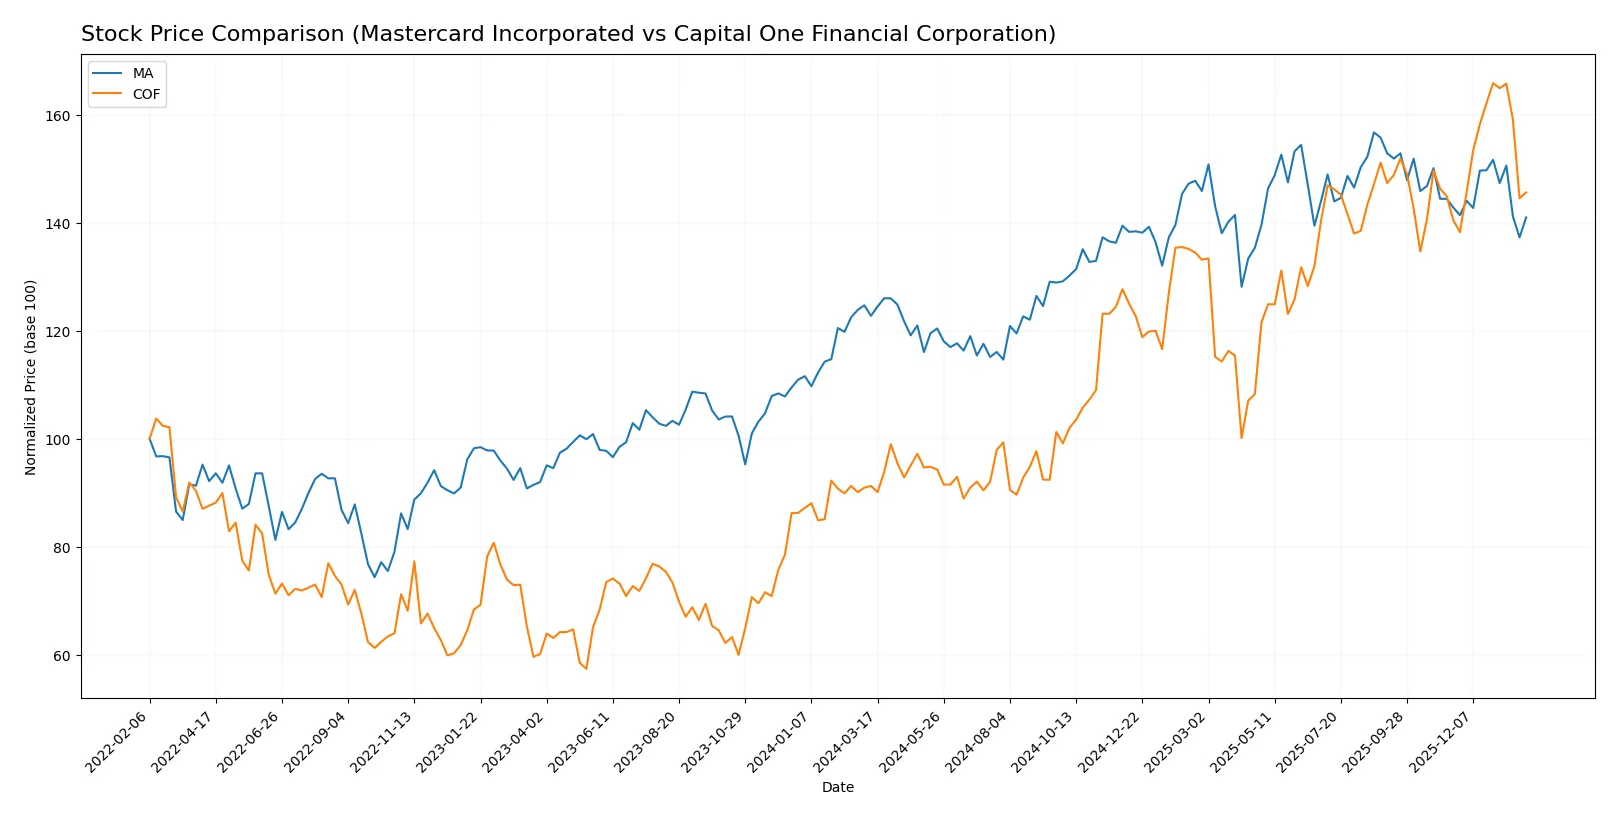
Trend Comparison
Mastercard’s stock gained 14.82% over the past year, indicating a bullish trend with decelerating momentum. Its price ranged from 438.18 to 598.96, showing moderate volatility (std dev 46.0).
Capital One’s stock rose 59.54% in the same period, a strongly bullish trend with accelerating gains. Its price moved between 133.7 and 249.32, with lower volatility (std dev 34.2).
Capital One outperformed Mastercard, delivering the highest market performance with a notably stronger price appreciation and accelerating upward trend.
Target Prices
Analysts maintain a constructive outlook for Mastercard Incorporated and Capital One Financial Corporation.
| Company | Target Low | Target High | Consensus |
|---|---|---|---|
| Mastercard Incorporated | 609 | 739 | 670.93 |
| Capital One Financial Corporation | 218 | 300 | 273.62 |
Mastercard’s target consensus at 671 implies a 25% upside versus the current 539 price. Capital One’s 274 consensus suggests a 25% potential gain from the 219 level.

Don’t Let Luck Decide Your Entry Point
Optimize your entry points with our advanced ProRealTime indicators. You’ll get efficient buy signals with precise price targets for maximum performance. Start outperforming now!
How do institutions grade them?
The following grades from respected financial institutions summarize the current analyst sentiment for both companies:
Mastercard Incorporated Grades
These grades reflect recent analyst recommendations for Mastercard Incorporated:
| Grading Company | Action | New Grade | Date |
|---|---|---|---|
| Wells Fargo | Maintain | Overweight | 2026-01-30 |
| Macquarie | Maintain | Outperform | 2026-01-30 |
| JP Morgan | Maintain | Overweight | 2026-01-30 |
| TD Cowen | Maintain | Buy | 2026-01-30 |
| Raymond James | Maintain | Outperform | 2026-01-30 |
| RBC Capital | Maintain | Outperform | 2026-01-30 |
| Morgan Stanley | Maintain | Overweight | 2026-01-30 |
| Compass Point | Upgrade | Buy | 2026-01-13 |
| HSBC | Upgrade | Buy | 2025-12-08 |
| Tigress Financial | Maintain | Strong Buy | 2025-11-06 |
Capital One Financial Corporation Grades
These grades summarize the latest analyst ratings for Capital One Financial Corporation:
| Grading Company | Action | New Grade | Date |
|---|---|---|---|
| Truist Securities | Maintain | Buy | 2026-01-27 |
| Barclays | Maintain | Overweight | 2026-01-26 |
| BTIG | Maintain | Buy | 2026-01-23 |
| Morgan Stanley | Maintain | Overweight | 2026-01-20 |
| JP Morgan | Maintain | Neutral | 2026-01-12 |
| TD Cowen | Maintain | Buy | 2026-01-08 |
| Barclays | Maintain | Overweight | 2026-01-06 |
| Wells Fargo | Maintain | Overweight | 2026-01-05 |
| Keefe, Bruyette & Woods | Maintain | Outperform | 2026-01-02 |
| Citigroup | Maintain | Buy | 2025-12-31 |
Which company has the best grades?
Mastercard holds consistently stronger grades, including multiple “Outperform” and a “Strong Buy” rating, compared to Capital One’s mostly “Buy” and “Overweight” grades. This suggests Mastercard currently enjoys higher analyst confidence, potentially attracting more investor interest.
Risks specific to each company
The following categories identify the critical pressure points and systemic threats facing both Mastercard Incorporated and Capital One Financial Corporation in the 2026 market environment:
1. Market & Competition
Mastercard Incorporated
- Dominates global payment processing with strong tech innovation and brand moat. Faces intense competition from fintech disruptors.
Capital One Financial Corporation
- Competes in consumer and commercial banking with diverse loan products but struggles to differentiate in saturated markets.
2. Capital Structure & Debt
Mastercard Incorporated
- High debt-to-equity ratio of 2.46 signals leverage risk despite strong interest coverage (26.73x).
Capital One Financial Corporation
- Debt metrics unavailable or zero, but interest coverage very low (0.07x), indicating potential solvency concerns.
3. Stock Volatility
Mastercard Incorporated
- Beta at 0.857 shows lower sensitivity to market swings, reflecting relative stability.
Capital One Financial Corporation
- Higher beta at 1.131 implies greater volatility and risk exposure to market fluctuations.
4. Regulatory & Legal
Mastercard Incorporated
- Faces evolving data privacy and payment regulations globally, requiring ongoing compliance investment.
Capital One Financial Corporation
- Subject to stringent banking regulations across US, Canada, UK; legal risks from credit and lending practices.
5. Supply Chain & Operations
Mastercard Incorporated
- Relies on robust digital infrastructure and partnerships; cyber risks remain a key operational threat.
Capital One Financial Corporation
- Operational risks linked to loan portfolio quality and branch network efficiency amid digital shift.
6. ESG & Climate Transition
Mastercard Incorporated
- Commits to sustainable payment solutions and carbon neutrality; ESG initiatives enhance brand and compliance.
Capital One Financial Corporation
- Faces pressure to reduce carbon footprint and align lending to green finance standards; transition risks rising.
7. Geopolitical Exposure
Mastercard Incorporated
- Global footprint exposes it to geopolitical risks, currency fluctuations, and cross-border regulations.
Capital One Financial Corporation
- Primarily US-focused but with some exposure in Canada and UK, mitigating but not eliminating geopolitical risks.
Which company shows a better risk-adjusted profile?
Mastercard’s strongest risk is its high leverage despite solid cash flow, which could amplify shocks in a tightening credit environment. Capital One’s principal risk lies in its distressed financial health, evidenced by its Altman Z-Score in the distress zone and poor interest coverage. Mastercard shows a better risk-adjusted profile, supported by a very strong Piotroski score and stable market position. The recent decline in Capital One’s financial ratios and bankruptcy risk is a red flag, highlighting its vulnerability amid economic stress.
Final Verdict: Which stock to choose?
Mastercard Incorporated shines with its superpower of durable value creation, demonstrated by a very favorable moat and consistently high ROIC well above WACC. Its strong profitability and robust cash flow generation are impressive. A point of vigilance remains its relatively high valuation multiples and debt-to-equity ratio. Mastercard suits aggressive growth portfolios seeking long-term dominance in payment networks.
Capital One Financial Corporation’s strategic moat lies in its potential for significant free cash flow yield and recent bullish price acceleration. However, its financial stability appears challenged, with weaker profitability and distress signals in liquidity ratios. Relative to Mastercard, it offers higher volatility and risk but might appeal to value-oriented investors seeking turnaround opportunities or GARP strategies.
If you prioritize durable competitive advantage and stable profitability, Mastercard is the compelling choice due to its proven capital efficiency and economic moat. However, if you seek higher risk-reward with a focus on free cash flow potential and growth acceleration, Capital One could offer superior upside, albeit with a greater risk profile. Each scenario demands careful alignment with your risk tolerance and investment horizon.
Disclaimer: Investment carries a risk of loss of initial capital. The past performance is not a reliable indicator of future results. Be sure to understand risks before making an investment decision.
Go Further
I encourage you to read the complete analyses of Mastercard Incorporated and Capital One Financial Corporation to enhance your investment decisions: