Investors seeking stable opportunities in the packaged foods sector often weigh the merits of Pilgrim’s Pride Corporation and Campbell Soup Company. Both giants operate in the consumer defensive industry, sharing market overlap yet pursuing distinct innovation strategies—Pilgrim’s Pride focuses on poultry and meat products, while Campbell Soup emphasizes diversified meals and snacks. This article will guide you through a detailed comparison to identify which company presents the most compelling investment case today.

Table of contents
Companies Overview
I will begin the comparison between Pilgrim’s Pride Corporation and Campbell Soup Company by providing an overview of these two companies and their main differences.
Pilgrim’s Pride Corporation Overview
Pilgrim’s Pride Corporation operates in the packaged foods industry, focusing on the production, processing, marketing, and distribution of fresh, frozen, and value-added chicken and pork products. Serving markets across the US, UK, Mexico, and beyond, the company sells to retailers, distributors, and foodservice operators. Founded in 1946 and headquartered in Greeley, Colorado, Pilgrim’s Pride is a subsidiary of JBS S.A. and employs over 62K people.
Campbell Soup Company Overview
Campbell Soup Company manufactures and markets a wide range of food and beverage products in the US and internationally. Its operations are divided into Meals & Beverages and Snacks segments, offering soups, sauces, snacks, and beverages under multiple well-known brands. Founded in 1869 and based in Camden, New Jersey, Campbell Soup employs about 14.4K staff and distributes through various retail channels, including e-commerce.
Key similarities and differences
Both companies operate within the consumer defensive sector and packaged foods industry, targeting retail and foodservice markets. Pilgrim’s Pride specializes in meat products, particularly chicken and pork, while Campbell Soup has a broader portfolio including soups, sauces, snacks, and beverages. Pilgrim’s Pride operates globally with a larger workforce, whereas Campbell Soup has a diversified product range and a significant presence in North America and Latin America.
Income Statement Comparison
The table below presents a side-by-side comparison of key income statement metrics for Pilgrim’s Pride Corporation and Campbell Soup Company for their most recent fiscal years.

| Metric | Pilgrim’s Pride Corporation (PPC) | Campbell Soup Company (CPB) |
|---|---|---|
| Market Cap | 9.5B | 7.9B |
| Revenue | 17.9B | 10.3B |
| EBITDA | 2.0B | 1.6B |
| EBIT | 1.6B | 1.1B |
| Net Income | 1.1B | 602M |
| EPS | 4.58 | 2.02 |
| Fiscal Year | 2024 | 2025 |
Income Statement Interpretations
Pilgrim’s Pride Corporation
Pilgrim’s Pride has exhibited strong revenue growth of 47.85% over 2020-2024, with net income soaring by 1046.55%. Margins have generally improved, with net margin rising to 6.08% in 2024 and an EBIT margin of 8.8%, both marked as neutral to favorable. Despite a slight slowdown in revenue growth to 2.97% in 2024, profitability surged, driven by a 177.26% EBIT increase and a 228.1% net margin expansion.
Campbell Soup Company
Campbell Soup’s revenue increased steadily by 20.97% from 2021 to 2025, with a 6.4% rise in the latest year. The company maintains strong margins, including a favorable gross margin of 30.42% and EBIT margin of 11.13% in 2025. However, net income declined overall by 39.92%, and net margin fell by 50.33%, with a slight negative net margin growth of -0.22% in the most recent fiscal year, signaling margin pressure despite stable top-line gains.
Which one has the stronger fundamentals?
Pilgrim’s Pride shows more robust fundamentals with significant net income and margin growth over the period, underpinned by improving profitability despite slower revenue growth recently. Campbell Soup’s strong margins are offset by declining net income and margins over the longer term, despite stable revenue. Overall, Pilgrim’s Pride presents a more favorable income statement trajectory based on the recent and cumulative performance metrics.
Financial Ratios Comparison
Below is a comparison of key financial ratios for Pilgrim’s Pride Corporation (PPC) and Campbell Soup Company (CPB) based on their most recent fiscal year data.
| Ratios | Pilgrim’s Pride Corporation (PPC) 2024 | Campbell Soup Company (CPB) 2025 |
|---|---|---|
| ROE | 25.6% | 15.4% |
| ROIC | 14.2% | 8.0% |
| P/E | 9.9 | 16.0 |
| P/B | 2.54 | 2.47 |
| Current Ratio | 2.01 | 0.77 |
| Quick Ratio | 1.31 | 0.28 |
| D/E | 0.82 | 1.85 |
| Debt-to-Assets | 32.5% | 48.4% |
| Interest Coverage | 9.34 | 3.92 |
| Asset Turnover | 1.68 | 0.69 |
| Fixed Asset Turnover | 5.27 | 3.71 |
| Payout Ratio | 0% | 76.2% |
| Dividend Yield | 0% | 4.77% |
Interpretation of the Ratios
Pilgrim’s Pride Corporation
Pilgrim’s Pride shows mostly favorable financial ratios, including a strong return on equity (25.63%) and return on invested capital (14.2%), supported by a solid current ratio of 2.01 indicating good liquidity. However, its dividend yield is zero, reflecting no dividend payments and suggesting retained earnings are likely reinvested into operations or growth. The overall ratio profile is favorable with limited concerns.
Campbell Soup Company
Campbell Soup presents a mixed ratio picture, with favorable return on equity (15.43%) and a good dividend yield of 4.77%, indicating regular shareholder returns. Yet, weak liquidity ratios, such as a current ratio of 0.77 and a quick ratio of 0.28, raise potential short-term risk concerns. Debt levels are high, as seen with a debt-to-equity ratio of 1.85. The global ratios are slightly favorable but warrant caution.
Which one has the best ratios?
Pilgrim’s Pride Corporation exhibits a stronger and more balanced ratio profile, especially in liquidity and profitability metrics, compared to Campbell Soup Company. While Campbell offers attractive dividends, its liquidity and leverage ratios are less favorable. Overall, Pilgrim’s Pride’s ratios suggest a more robust financial position in 2024–2025, although both companies have areas requiring attention.
Strategic Positioning
This section compares the strategic positioning of Pilgrim’s Pride Corporation (PPC) and Campbell Soup Company (CPB) based on Market position, Key segments, and Exposure to technological disruption:
Pilgrim’s Pride Corporation
- Large market cap of 9.5B, operating internationally with diversified competition pressures.
- Focus on fresh, frozen chicken and pork products, serving retail and foodservice globally.
- Exposure to food production innovations but no explicit technological disruption stated.
Campbell Soup Company
- Market cap of 7.9B, competes in US and Canada with established presence in retail and foodservice.
- Diverse segments: Baked Snacks (4.4B), Beverages (3.0B), Soups (2.8B), targeting retail and foodservice markets.
- No specific technological disruption mentioned, operates in traditional packaged foods and snacks sectors.
Pilgrim’s Pride Corporation vs Campbell Soup Company Positioning
PPC operates a concentrated protein product portfolio with international sales, leveraging scale and variety in meat products. CPB offers a diversified product mix across baked snacks, beverages, and soups primarily in North America. PPC’s broad geographic reach contrasts with CPB’s focused regional presence.
Which has the best competitive advantage?
PPC exhibits a very favorable moat with growing ROIC and strong value creation indicating durable competitive advantage. CPB also creates value but shows a declining ROIC trend, resulting in a slightly favorable moat status and less durable profitability.
Stock Comparison
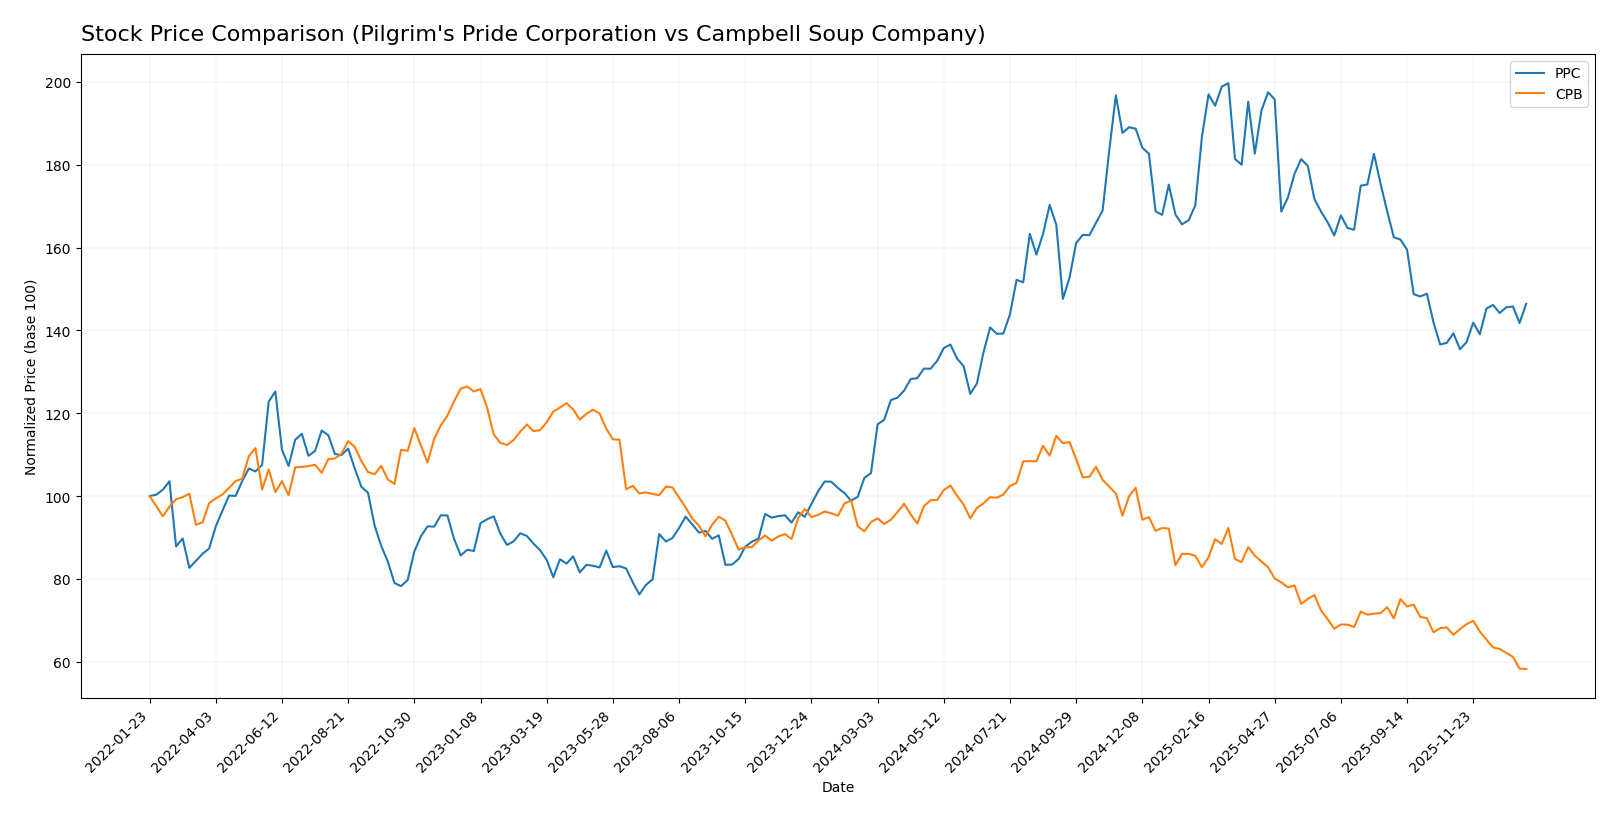
The stock prices of Pilgrim’s Pride Corporation (PPC) and Campbell Soup Company (CPB) have shown contrasting dynamics over the past 12 months, with PPC demonstrating a strong upward trajectory while CPB experienced a significant decline.
Trend Analysis
Pilgrim’s Pride Corporation (PPC) exhibited a bullish trend over the past year with a 38.73% price increase, marked by accelerating momentum and a price range from 28.87 to 54.62. Recent weeks show continued moderate gains with a 5.12% rise.
Campbell Soup Company (CPB) faced a bearish trend in the same period, with a 37.83% price decrease and decelerating decline, fluctuating between 26.39 and 51.89. Recent months reflect an intensified downtrend with a 12.41% drop.
Comparing the two, PPC delivered the highest market performance with strong gains and acceleration, whereas CPB’s stock trend remains negative and decelerating over the past 12 months.
Target Prices
Here is the target price consensus from verified analysts for selected companies:
| Company | Target High | Target Low | Consensus |
|---|---|---|---|
| Pilgrim’s Pride Corporation | 56 | 45 | 50.5 |
| Campbell Soup Company | 38 | 26 | 30.88 |
Analysts expect Pilgrim’s Pride to trade significantly above its current price of 40.05 USD, while Campbell Soup shows moderate upside potential over its 26.39 USD current price.
Analyst Opinions Comparison
This section compares analysts’ ratings and grades for Pilgrim’s Pride Corporation and Campbell Soup Company:
Rating Comparison
Pilgrim’s Pride Corporation Rating
- Rating: A+, classified as Very Favorable
- Discounted Cash Flow Score: 4, Favorable
- ROE Score: 5, Very Favorable
- ROA Score: 5, Very Favorable
- Debt To Equity Score: 4, Favorable
- Overall Score: 4, Favorable
Campbell Soup Company Rating
- Rating: B-, classified as Very Favorable
- Discounted Cash Flow Score: 5, Very Favorable
- ROE Score: 3, Moderate
- ROA Score: 2, Moderate
- Debt To Equity Score: 1, Very Unfavorable
- Overall Score: 3, Moderate
Which one is the best rated?
Pilgrim’s Pride Corporation holds a higher overall rating (A+) and better scores in ROE, ROA, debt to equity, and overall score, while Campbell Soup Company excels only in discounted cash flow. Pilgrim’s Pride is clearly better rated here.
Scores Comparison
The scores comparison between Pilgrim’s Pride Corporation (PPC) and Campbell Soup Company (CPB) is as follows:
PPC Scores
- Altman Z-Score: 3.75, safe zone indicating low bankruptcy risk
- Piotroski Score: 5, average financial strength
CPB Scores
- Altman Z-Score: 1.73, distress zone indicating high bankruptcy risk
- Piotroski Score: 5, average financial strength
Which company has the best scores?
PPC shows a significantly stronger Altman Z-Score, placing it in the safe zone, while CPB is in the distress zone. Both have the same average Piotroski Score of 5, indicating similar financial strength.
Grades Comparison
Here is a detailed overview of the latest grades assigned to Pilgrim’s Pride Corporation and Campbell Soup Company:
Pilgrim’s Pride Corporation Grades
The table below summarizes recent grades and actions from leading financial institutions for Pilgrim’s Pride Corporation:
| Grading Company | Action | New Grade | Date |
|---|---|---|---|
| Barclays | Maintain | Equal Weight | 2025-12-09 |
| Goldman Sachs | Maintain | Neutral | 2025-10-13 |
| BMO Capital | Maintain | Market Perform | 2025-03-17 |
| Barclays | Maintain | Equal Weight | 2024-11-01 |
| BMO Capital | Maintain | Market Perform | 2024-11-01 |
| Barclays | Maintain | Equal Weight | 2024-09-09 |
| Argus Research | Maintain | Buy | 2024-08-28 |
| B of A Securities | Downgrade | Neutral | 2024-08-15 |
| BMO Capital | Downgrade | Market Perform | 2024-08-12 |
| Barclays | Maintain | Equal Weight | 2024-08-02 |
Grades for Pilgrim’s Pride predominantly range between “Equal Weight” and “Market Perform,” with a few downgrades in mid-2024 and a single recent “Buy” rating, indicating a generally cautious or neutral stance.
Campbell Soup Company Grades
The table below summarizes recent grades and actions from leading financial institutions for Campbell Soup Company:
| Grading Company | Action | New Grade | Date |
|---|---|---|---|
| DA Davidson | Maintain | Neutral | 2025-12-11 |
| RBC Capital | Maintain | Sector Perform | 2025-12-10 |
| Wells Fargo | Maintain | Equal Weight | 2025-12-10 |
| Stifel | Maintain | Hold | 2025-12-10 |
| UBS | Maintain | Sell | 2025-12-10 |
| Bernstein | Maintain | Outperform | 2025-12-10 |
| Stephens & Co. | Maintain | Overweight | 2025-12-08 |
| Morgan Stanley | Maintain | Equal Weight | 2025-12-05 |
| UBS | Maintain | Sell | 2025-12-04 |
| Wells Fargo | Maintain | Equal Weight | 2025-09-25 |
Campbell Soup’s grades show a wider spread from “Sell” to “Outperform” and “Overweight,” reflecting mixed investor sentiment and a more varied rating profile.
Which company has the best grades?
Both companies have a consensus rating of “Hold,” but Pilgrim’s Pride predominantly receives stable “Equal Weight” and “Market Perform” grades, while Campbell Soup shows a broader spectrum from “Sell” to “Outperform.” This suggests Campbell Soup carries more divergent analyst opinions, which may imply varying perceptions of risk and opportunity for investors.
Strengths and Weaknesses
Below is a comparative overview of key strengths and weaknesses for Pilgrim’s Pride Corporation (PPC) and Campbell Soup Company (CPB) based on the most recent financial and strategic data.
| Criterion | Pilgrim’s Pride Corporation (PPC) | Campbell Soup Company (CPB) |
|---|---|---|
| Diversification | Focused on poultry products; less diversified | Diversified in Baked Snacks, Beverages, Soups |
| Profitability | Strong ROIC at 14.2%, ROE 25.6%; net margin neutral | Moderate ROIC 7.96%, ROE 15.4%; net margin neutral |
| Innovation | Moderate innovation implied; solid asset turnover (5.27) | Innovation in product mix with growing Baked Snacks segment |
| Global presence | Primarily North America | Broader international distribution |
| Market Share | Strong in poultry market | Leading in soups and snacks markets |
Key takeaways: PPC demonstrates a very favorable economic moat with strong profitability and efficient capital use, but limited diversification. CPB shows moderate profitability with a slightly favorable moat, diversified product portfolio, but faces declining profitability trends and weaker liquidity ratios. Investors should weigh PPC’s focused strength against CPB’s broader product mix and income stability.
Risk Analysis
Below is a comparative table outlining key risks for Pilgrim’s Pride Corporation (PPC) and Campbell Soup Company (CPB) based on the most recent financial year data:
| Metric | Pilgrim’s Pride Corporation (PPC) | Campbell Soup Company (CPB) |
|---|---|---|
| Market Risk | Low beta (0.445) indicates lower volatility and market risk | Negative beta (-0.043) suggests defensive stock but potential sensitivity to unusual market conditions |
| Debt Level | Moderate debt-to-equity (0.82) with 32.55% debt-to-assets; manageable leverage | High debt-to-equity (1.85) and 48.42% debt-to-assets; increased financial risk |
| Regulatory Risk | Moderate, given global food production and export regulations | Moderate, with diverse food and beverage products subject to U.S. and international standards |
| Operational Risk | Exposure to supply chain disruptions in poultry and pork production | Risks related to product diversification and supply chain complexity |
| Environmental Risk | Potential risks from livestock farming environmental impact | Risks from agricultural sourcing and packaging sustainability |
| Geopolitical Risk | Exposure to international markets including UK, Mexico, Middle East, Asia | Exposure to North American and Latin American markets; somewhat less global |
The most impactful risks are Campbell Soup’s high debt level, which increases financial vulnerability, and Pilgrim’s Pride’s operational exposure to supply chain disruptions in meat production. PPC’s low market beta and solid interest coverage mitigate market risk, while CPB’s distressed Altman Z-Score signals caution regarding its financial stability. Investors should closely monitor CPB’s leverage and liquidity challenges.
Which Stock to Choose?
Pilgrim’s Pride Corporation (PPC) shows a favorable income evolution with 47.85% revenue growth over five years and strong net margin improvements. Its financial ratios are mostly favorable, including a high ROE of 25.63% and a solid current ratio of 2.01. PPC maintains a moderate debt level with net debt to EBITDA at 0.71 and holds a very favorable rating of A+.
Campbell Soup Company (CPB) displays moderate income growth of 20.97% over its overall period but faces declining net income and margin trends. Its financial ratios are mixed, with a favorable ROE at 15.43% but unfavorable liquidity ratios (current ratio 0.77) and higher debt (net debt to EBITDA 4.5). CPB has a slightly favorable rating of B-.
For investors prioritizing durable competitive advantage and strong profitability, PPC’s very favorable moat and higher overall financial stability could appear more suitable. Conversely, those focusing on income stability and dividend yield might find CPB’s profile more aligned, despite its weaker recent trends and rating.
Disclaimer: Investment carries a risk of loss of initial capital. The past performance is not a reliable indicator of future results. Be sure to understand risks before making an investment decision.
Go Further
I encourage you to read the complete analyses of Pilgrim’s Pride Corporation and Campbell Soup Company to enhance your investment decisions: