Home > Comparison > Consumer Defensive > MKC vs CPB
The strategic rivalry between McCormick & Company, Incorporated and Campbell Soup Company defines the current trajectory of the packaged foods sector. McCormick operates as a global flavor solutions leader focusing on spices and seasonings, while Campbell emphasizes diversified meals and snacks with strong retail presence. This analysis pits McCormick’s innovation-driven growth against Campbell’s broad consumer staples footprint to identify which offers superior risk-adjusted returns for a diversified portfolio.
Table of contents
Companies Overview
McCormick & Company and Campbell Soup Company dominate the packaged foods industry with distinct brand power and market reach.
McCormick & Company, Incorporated: Global Flavor Leader
McCormick stands as a global leader in spices and seasonings. It generates revenue primarily through its Consumer segment, selling branded herbs, spices, and sauces worldwide. In 2026, McCormick strategically emphasized expanding its Flavor Solutions segment, supplying seasoning blends and flavors to multinational food manufacturers and foodservice clients.
Campbell Soup Company: Diverse Packaged Foods Powerhouse
Campbell Soup Company commands a broad portfolio in the meals, beverages, and snacks segments. It drives revenue from ready-to-serve soups, sauces, beverages, and snack products marketed across North America and Latin America. In 2026, Campbell focused on growing its Snacks segment while maintaining strength in retail and foodservice channels.
Strategic Collision: Similarities & Divergences
Both firms operate in packaged foods but differ in focus. McCormick pursues a specialized flavor innovation model with B2B and consumer products. Campbell adopts a broader consumer packaged goods approach, spanning soups to snacks. Their primary battleground lies in retail and foodservice distribution. Investors face distinct profiles: McCormick offers focused seasoning expertise, while Campbell provides diversified food and beverage exposure.
Income Statement Comparison
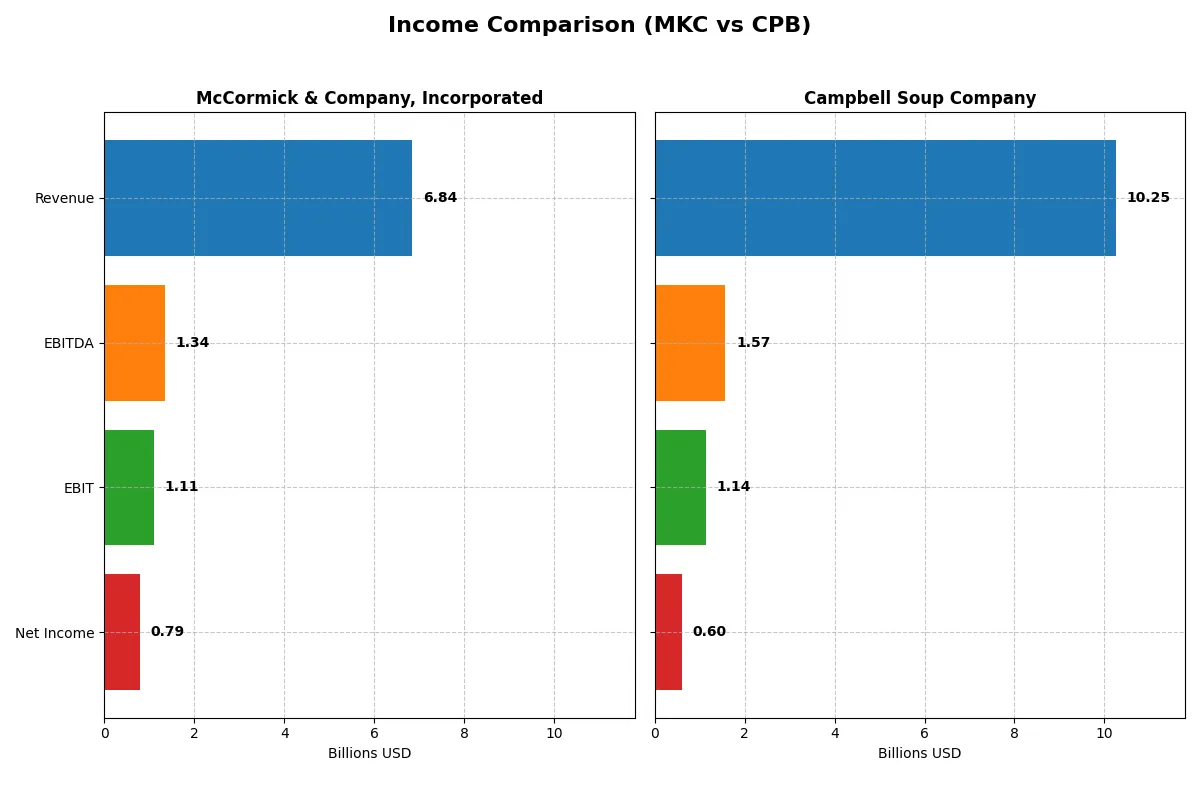
This data dissects the core profitability and scalability of both corporate engines to reveal who dominates the bottom line:
| Metric | McCormick & Company, Incorporated (MKC) | Campbell Soup Company (CPB) |
|---|---|---|
| Revenue | 6.84B | 10.25B |
| Cost of Revenue | 4.25B | 7.13B |
| Operating Expenses | 1.50B | 1.77B |
| Gross Profit | 2.59B | 3.12B |
| EBITDA | 1.34B | 1.58B |
| EBIT | 1.11B | 1.14B |
| Interest Expense | 196M | 345M |
| Net Income | 789M | 602M |
| EPS | 2.94 | 2.02 |
| Fiscal Year | 2025 | 2025 |
Income Statement Analysis: The Bottom-Line Duel
This income statement comparison reveals which company operates its business model with greater efficiency and profitability.
McCormick & Company, Incorporated Analysis
McCormick’s revenue grew modestly from 6.32B in 2021 to 6.84B in 2025, showing steady expansion. Net income fluctuated but remained resilient, ending at 789M in 2025. Gross margin stays strong around 38%, and net margin holds a healthy 11.5%, reflecting tight cost control and stable profitability. Momentum in 2025 shows slight revenue growth but a small dip in net margin.
Campbell Soup Company Analysis
Campbell Soup’s revenue rose from 8.48B in 2021 to 10.25B in 2025, indicating solid top-line growth. However, net income declined sharply from 1.00B in 2021 to 602M in 2025. Gross margin at 30.4% and net margin at 5.9% lag McCormick, highlighting margin pressure. Despite improved EBIT growth and EPS in 2025, overall net income and margin contractions signal underlying efficiency challenges.
Steady Margins vs. Top-Line Growth Struggles
McCormick outperforms Campbell Soup on margin consistency and net profitability, despite Campbell’s stronger revenue growth. McCormick’s stable gross and net margins demonstrate superior cost management. For investors, McCormick’s profile offers more reliable earnings quality, while Campbell faces risks from margin erosion despite expanding sales.
Financial Ratios Comparison
These vital ratios act as a diagnostic tool to expose the underlying fiscal health, valuation premiums, and capital efficiency of the companies compared below:
| Ratios | McCormick & Company, Incorporated (MKC) | Campbell Soup Company (CPB) |
|---|---|---|
| ROE | 13.76% | 15.43% |
| ROIC | 7.93% | 7.96% |
| P/E | 22.59 | 15.98 |
| P/B | 3.11 | 2.47 |
| Current Ratio | 0.70 | 0.77 |
| Quick Ratio | 0.28 | 0.28 |
| D/E (Debt-to-Equity) | 0.70 | 1.85 |
| Debt-to-Assets | 30.3% | 48.4% |
| Interest Coverage | 5.57 | 3.92 |
| Asset Turnover | 0.52 | 0.69 |
| Fixed Asset Turnover | 4.72 | 3.71 |
| Payout ratio | 61.2% | 76.2% |
| Dividend yield | 2.71% | 4.77% |
| Fiscal Year | 2025 | 2025 |
Efficiency & Valuation Duel: The Vital Signs
Ratios serve as a company’s DNA, exposing hidden risks and operational strengths that raw numbers alone cannot reveal.
McCormick & Company, Incorporated
McCormick posts a solid 13.8% ROE and a strong 11.5% net margin, indicating efficient profitability. Its P/E of 22.6 sits near sector averages, suggesting a fairly valued stock. The 2.7% dividend yield rewards shareholders steadily, highlighting a balanced capital allocation between returns and reinvestment.
Campbell Soup Company
Campbell delivers a higher 15.4% ROE but a modest 5.9% net margin, reflecting leaner profitability. Trading at a lower P/E of 16.0, it appears undervalued relative to peers. With a 4.8% dividend yield, Campbell returns significant cash to shareholders, signaling a yield-focused strategy amid moderate operational efficiency.
Valuation and Profitability: Balanced Returns vs. Yield Focus
McCormick offers stable profitability with a moderate valuation and consistent dividends, balancing growth and income. Campbell trades cheaper with stronger shareholder yields but lower margin efficiency. Investors seeking income may prefer Campbell, while those valuing operational consistency may lean toward McCormick.
Which one offers the Superior Shareholder Reward?
I compare McCormick & Company (MKC) and Campbell Soup Company (CPB) on shareholder returns. MKC yields 2.7% with a 61% payout ratio and a robust buyback history supporting capital return. CPB offers a higher 4.8% yield but a riskier 76% payout ratio and weaker buyback intensity. MKC’s balanced dividend and buyback strategy, with stronger free cash flow coverage, signals more sustainable shareholder rewards. CPB’s elevated leverage and payout raise long-term risk. I conclude MKC provides the superior total return profile for 2026 investors focused on stability and growth.
Comparative Score Analysis: The Strategic Profile
The radar chart reveals the fundamental DNA and trade-offs of both firms, highlighting their core financial strengths and vulnerabilities across key metrics:
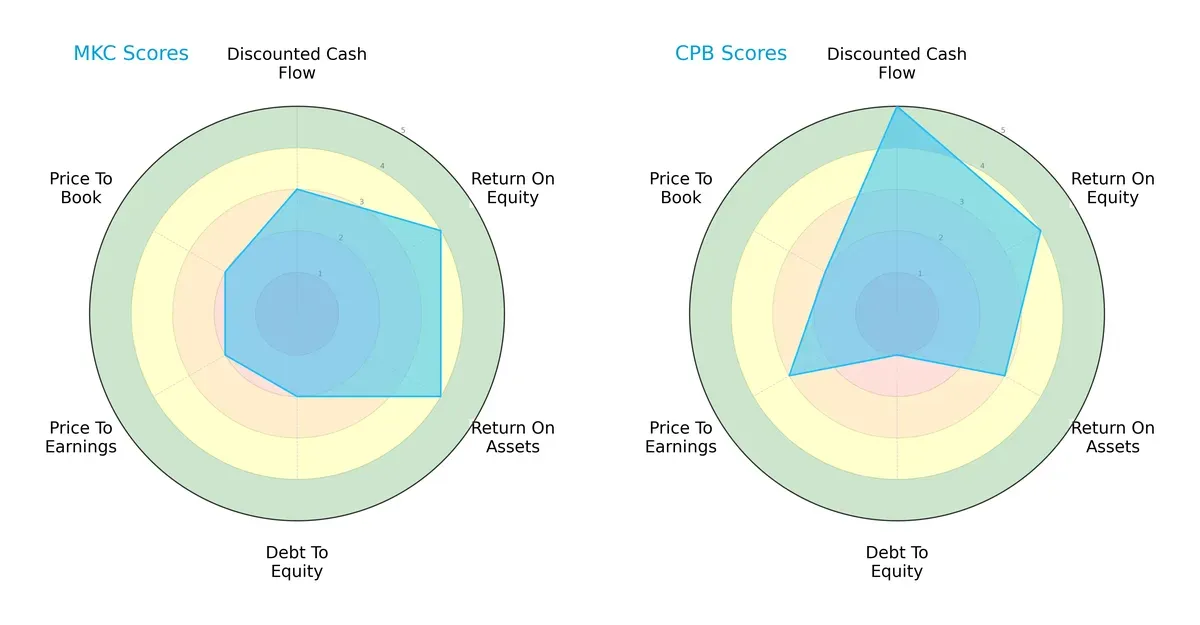
McCormick & Company shows balanced efficiency with favorable ROE and ROA scores at 4 each, but moderate debt management and valuation scores. Campbell Soup excels in discounted cash flow with a top score of 5 and maintains strong ROE, but its debt-to-equity score is notably weak at 1, indicating higher financial risk. McCormick’s profile is more balanced, while Campbell relies heavily on cash flow strength despite leverage concerns.
Bankruptcy Risk: Solvency Showdown
The Altman Z-Score gap signals differing survival odds in this cycle:
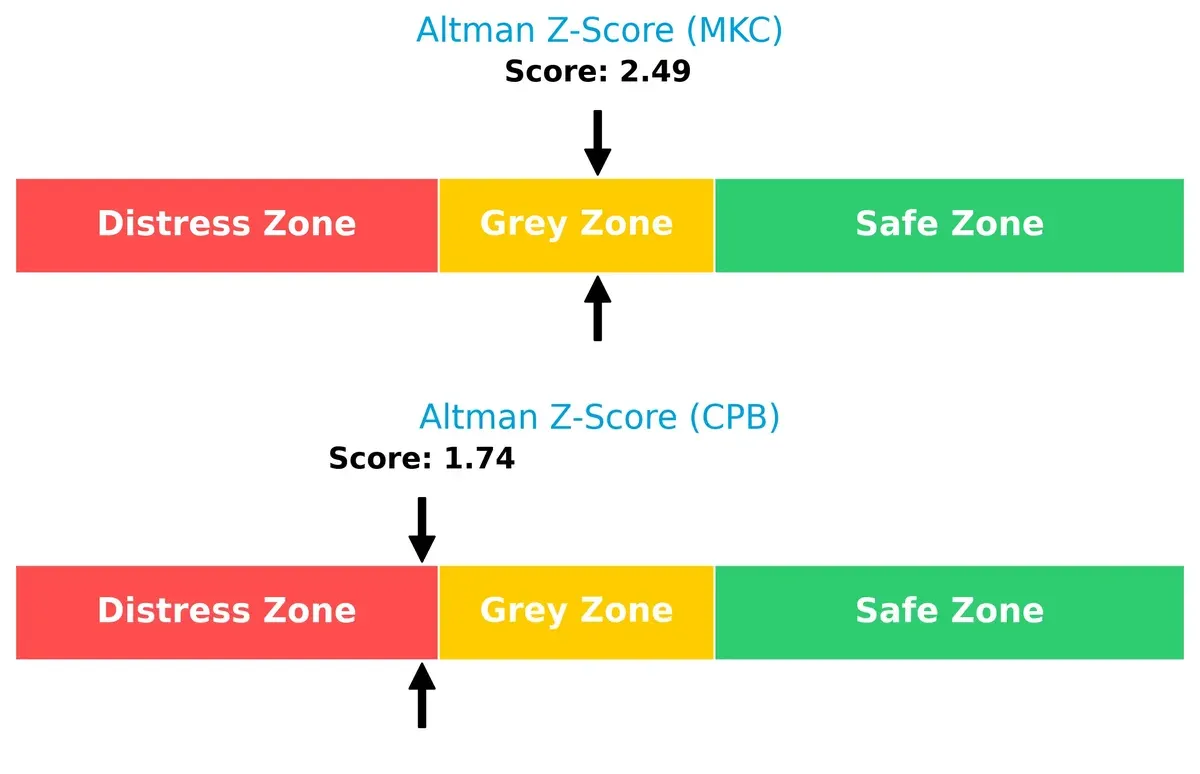
McCormick’s 2.49 places it in the grey zone, suggesting moderate bankruptcy risk but relative financial stability. Campbell’s 1.74 falls in the distress zone, raising caution about its ability to withstand adverse shocks. This disparity marks McCormick as the safer long-term bet amid economic uncertainty.
Financial Health: Quality of Operations
Piotroski F-Scores reveal operational quality and internal financial robustness:
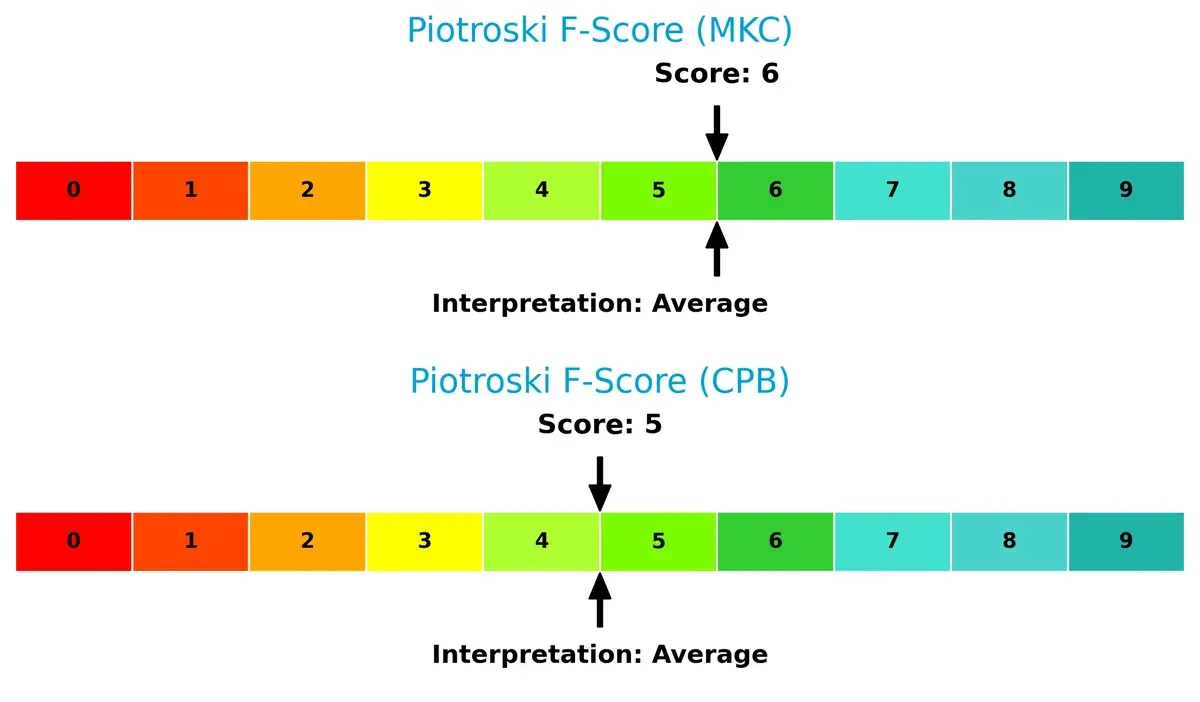
McCormick edges out Campbell with a 6 versus 5, both in the average range but with McCormick showing fewer red flags. This suggests McCormick manages profitability, leverage, and liquidity metrics more effectively, reinforcing its stronger financial footing. Investors should watch Campbell’s weaker internal signals closely.
How are the two companies positioned?
This section dissects the operational DNA of McCormick and Campbell by comparing their revenue distribution by segment and internal strengths and weaknesses. The objective is to confront their economic moats to identify which business model offers the most resilient, sustainable competitive advantage today.
Revenue Segmentation: The Strategic Mix
This visual comparison dissects how McCormick & Company and Campbell Soup diversify their income streams and where their primary sector bets lie:
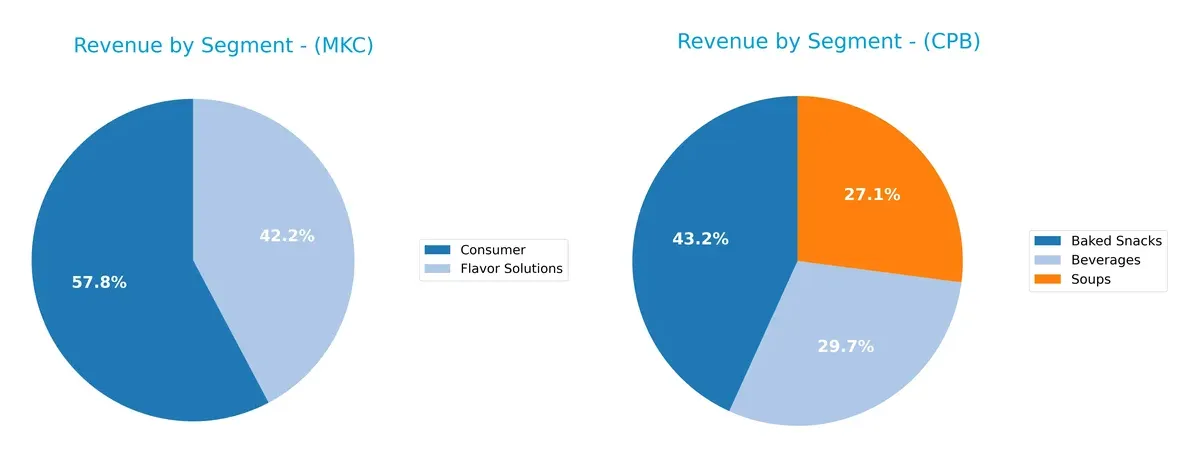
McCormick anchors its revenue in two balanced segments: Consumer at $3.95B and Flavor Solutions at $2.89B, showing a focused but diversified portfolio. Campbell Soup dwarfs with three major segments: Baked Snacks leads at $4.43B, followed by Beverages at $3.05B and Soups at $2.78B, reflecting broader diversification. McCormick pivots on product innovation, while Campbell manages concentration risk through varied consumer staples.
Strengths and Weaknesses Comparison
This table compares the strengths and weaknesses of McCormick & Company, Incorporated (MKC) and Campbell Soup Company (CPB):
MKC Strengths
- Higher net margin at 11.54% indicates stronger profitability
- Favorable WACC at 6.17% supports efficient capital use
- Strong interest coverage of 5.65 times reduces financial risk
- Higher fixed asset turnover (4.72) shows operational efficiency
- Diverse product segments including Consumer and Flavor Solutions
- Broad geographic presence across Americas, EMEA, and Asia Pacific
CPB Strengths
- Higher ROE at 15.43% reflects strong shareholder returns
- Favorable WACC at 4.22% underpins low cost of capital
- Higher dividend yield at 4.77% appeals to income investors
- Diversified product portfolio with Baked Snacks, Beverages, Soups, Simple Meals
- Strong US market presence with significant Non-US sales exposure
MKC Weaknesses
- Low liquidity ratios: current ratio 0.7 and quick ratio 0.28 signal short-term risk
- Unfavorable PB ratio at 3.11 suggests potential overvaluation
- Moderate leverage with D/E at 0.7 but could tighten controls
- ROE and ROIC only neutral, limiting return expansion prospects
CPB Weaknesses
- High leverage with D/E at 1.85 increases financial risk
- Low liquidity ratios: current ratio 0.77 and quick ratio 0.28 constrain flexibility
- Interest coverage at 3.31 times is moderate, limiting debt safety margin
- Lower net margin at 5.87% highlights margin pressure despite strong ROE
Both companies exhibit slightly favorable overall financial profiles with distinct strategic strengths. MKC excels in profitability and operational efficiency, while CPB offers superior shareholder returns and dividend income. However, liquidity constraints and leverage differences present areas requiring vigilant management to sustain competitive positioning.
The Moat Duel: Analyzing Competitive Defensibility
Structural moats shield long-term profits from relentless competitive forces. Without them, gains erode quickly. Let’s dissect the nature of these moats for two packaged food giants:
McCormick & Company, Incorporated: Intangible Brand Strength and Innovation
McCormick leverages powerful intangible assets—premium brands and unique flavor formulations—that sustain high 16% EBIT margins. Its growing ROIC signals improving profitability, though revenue growth slows in 2026. Continued innovation in global flavor solutions could deepen this advantage.
Campbell Soup Company: Scale-Driven Cost Advantage and Portfolio Breadth
Campbell’s moat centers on scale and a broad product portfolio spanning soups, snacks, and beverages. Despite solid 11% EBIT margins and value creation from ROIC above WACC, its declining ROIC trend warns of margin pressure. Expansion in snacks and beverages offers some growth potential.
Intangible Assets vs. Scale and Breadth: The Moat Showdown
McCormick’s rising ROIC and strong brand-driven moat appear deeper than Campbell’s scale-based advantage, which faces margin headwinds. I see McCormick better positioned to defend market share amid evolving consumer tastes and competitive pressures.
Which stock offers better returns?
Both McCormick & Company and Campbell Soup Company experienced notable price declines over the past year, with McCormick showing a less severe downward trend compared to Campbell.
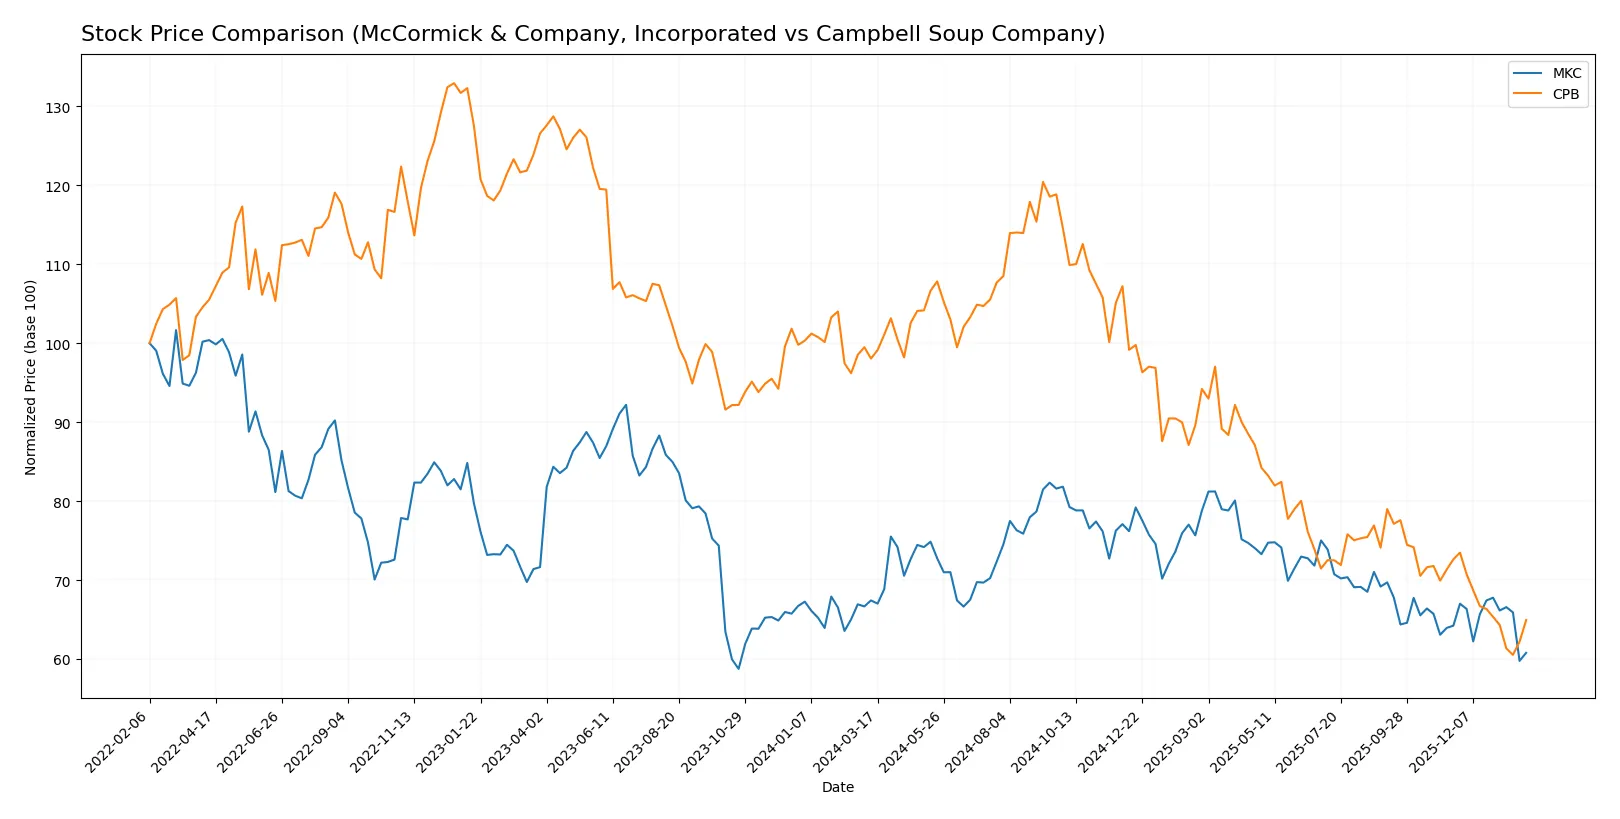
Trend Comparison
McCormick’s stock dropped 9.84% over the past 12 months, indicating a bearish trend with decelerating decline. The price ranged from a high of 83.76 to a low of 60.79.
Campbell Soup’s stock fell 33.78% in the same period, also bearish with decelerating decline. It showed higher volatility, ranging between 51.89 and 26.08.
McCormick outperformed Campbell Soup, delivering a smaller price drop and less severe market losses over the last year.
Target Prices
Analysts present a cautiously optimistic consensus for McCormick & Company and Campbell Soup Company.
| Company | Target Low | Target High | Consensus |
|---|---|---|---|
| McCormick & Company, Incorporated | 67 | 85 | 73.57 |
| Campbell Soup Company | 26 | 38 | 30.22 |
The consensus target prices for MKC and CPB exceed their current prices by 19% and 8%, respectively, signaling moderate upside potential. This reflects steady analyst confidence in their packaged foods market positioning.

Don’t Let Luck Decide Your Entry Point
Optimize your entry points with our advanced ProRealTime indicators. You’ll get efficient buy signals with precise price targets for maximum performance. Start outperforming now!
How do institutions grade them?
McCormick & Company, Incorporated Grades
Here is a summary of recent analyst grades for McCormick & Company, Incorporated:
| Grading Company | Action | New Grade | Date |
|---|---|---|---|
| Barclays | Maintain | Equal Weight | 2026-01-26 |
| UBS | Maintain | Neutral | 2026-01-23 |
| Stifel | Maintain | Hold | 2026-01-23 |
| Barclays | Maintain | Equal Weight | 2025-10-08 |
| Jefferies | Maintain | Buy | 2025-10-08 |
| Deutsche Bank | Maintain | Hold | 2025-10-08 |
| Stifel | Maintain | Hold | 2025-10-08 |
| UBS | Maintain | Neutral | 2025-10-08 |
| Bernstein | Maintain | Outperform | 2025-10-08 |
| UBS | Maintain | Neutral | 2025-10-01 |
Campbell Soup Company Grades
Here is a summary of recent analyst grades for Campbell Soup Company:
| Grading Company | Action | New Grade | Date |
|---|---|---|---|
| Morgan Stanley | Maintain | Equal Weight | 2026-01-16 |
| DA Davidson | Maintain | Neutral | 2025-12-11 |
| Wells Fargo | Maintain | Equal Weight | 2025-12-10 |
| Bernstein | Maintain | Outperform | 2025-12-10 |
| Stifel | Maintain | Hold | 2025-12-10 |
| RBC Capital | Maintain | Sector Perform | 2025-12-10 |
| UBS | Maintain | Sell | 2025-12-10 |
| Stephens & Co. | Maintain | Overweight | 2025-12-08 |
| Morgan Stanley | Maintain | Equal Weight | 2025-12-05 |
| UBS | Maintain | Sell | 2025-12-04 |
Which company has the best grades?
McCormick holds a stronger consensus with multiple “Hold,” “Neutral,” and “Equal Weight” ratings plus “Buy” and “Outperform” from top firms. Campbell presents mixed views, including “Sell” ratings from UBS. Investors may see McCormick as more favored by analysts, potentially implying steadier sentiment.
Risks specific to each company
The following categories identify the critical pressure points and systemic threats facing both firms in the 2026 market environment:
1. Market & Competition
McCormick & Company, Incorporated
- Operates in a crowded packaged foods sector with strong brands but faces intense competition from global and private label players.
Campbell Soup Company
- Competes heavily in meals, beverages, and snacks with broad product lines but contends with shifting consumer preferences and private label growth.
2. Capital Structure & Debt
McCormick & Company, Incorporated
- Moderate debt-to-equity ratio of 0.7 signals balanced leverage and manageable financial risk.
Campbell Soup Company
- High debt-to-equity ratio of 1.85 raises red flags about over-leverage and potential liquidity constraints.
3. Stock Volatility
McCormick & Company, Incorporated
- Beta of 0.617 indicates lower volatility and relative stability versus the broader market.
Campbell Soup Company
- Negative beta (-0.043) suggests unusual market behavior, possibly reflecting defensive or counter-cyclical stock traits.
4. Regulatory & Legal
McCormick & Company, Incorporated
- Faces standard food safety and labeling regulations; exposure to international compliance risks due to global operations.
Campbell Soup Company
- Subject to evolving food regulations and litigation risks in the US and Latin American markets.
5. Supply Chain & Operations
McCormick & Company, Incorporated
- Complex global sourcing for spices and seasonings makes supply chain vulnerable to commodity price swings and geopolitical disruptions.
Campbell Soup Company
- Extensive supply chain for soups and snacks with exposure to raw material inflation and logistical bottlenecks.
6. ESG & Climate Transition
McCormick & Company, Incorporated
- Increasing pressure to reduce carbon footprint and improve sustainable sourcing in flavor solutions.
Campbell Soup Company
- Faces challenges in packaging waste reduction and carbon emissions from manufacturing and distribution.
7. Geopolitical Exposure
McCormick & Company, Incorporated
- Significant exposure to Europe, Middle East, Africa, and China introduces geopolitical and currency risks.
Campbell Soup Company
- Latin America operations subject to political instability and trade barriers.
Which company shows a better risk-adjusted profile?
McCormick’s most impactful risk lies in its supply chain complexity and international geopolitical exposure. Campbell faces critical financial risk from its elevated leverage and liquidity concerns. Despite McCormick’s lower current ratio, its balanced debt level and stable stock volatility make it the better risk-adjusted profile. Campbell’s distress-zone Altman Z-score and high debt-to-equity ratio underscore heightened financial vulnerability, warranting caution.
Final Verdict: Which stock to choose?
McCormick & Company stands out for its operational resilience and steadily improving profitability. Its superpower lies in solid cash flow generation and efficient asset use despite a tight current ratio, which remains a point of vigilance. It suits portfolios aiming for stable income with moderate growth.
Campbell Soup’s strategic moat is its strong return on equity coupled with a notably lower cost of capital, signaling disciplined capital allocation. While its debt load raises caution, it offers a more attractive dividend yield and price valuation, fitting well with investors seeking growth at a reasonable price.
If you prioritize consistent cash generation and operational efficiency, McCormick appears the compelling choice due to its growing profitability and stable margins. However, if you seek higher dividend income alongside value potential, Campbell Soup offers better stability in valuation despite its heavier leverage. Each reflects distinct risk-return profiles aligned with different investor strategies.
Disclaimer: Investment carries a risk of loss of initial capital. The past performance is not a reliable indicator of future results. Be sure to understand risks before making an investment decision.
Go Further
I encourage you to read the complete analyses of McCormick & Company, Incorporated and Campbell Soup Company to enhance your investment decisions: