Choosing the right stocks in the packaged foods industry requires a close look at market leaders with strong innovation and global reach. JBS N.V., a global protein and food giant, and Campbell Soup Company, an iconic U.S.-based meals and snacks manufacturer, both compete in overlapping consumer markets with distinct strategies. This comparison will guide you through their strengths and risks to reveal which company might be the smarter addition to your investment portfolio.
Table of contents
Companies Overview
I will begin the comparison between JBS N.V. and Campbell Soup Company by providing an overview of these two companies and their main differences.
JBS N.V. Overview
JBS N.V. is a global protein and food company headquartered in Amstelveen, Netherlands. Founded in 1953, it operates across multiple segments including beef, pork, chicken, and plant-based products. The company also manages leather, biodiesel, packaging, and logistics services. With 280K employees, JBS has a broad value chain involvement from slaughtering and processing to distribution and waste management, positioning it as a diversified leader in the packaged foods industry.
Campbell Soup Company Overview
Campbell Soup Company, based in Camden, New Jersey, is a leading manufacturer and marketer of food and beverage products primarily in the US and internationally. Founded in 1869, it operates through Meals & Beverages and Snacks segments, offering soups, sauces, snacks, and beverages under well-known brands. Employing 14.4K people, Campbell distributes through various retail channels including e-commerce, focusing on consumer staples within the packaged foods sector.
Key similarities and differences
Both JBS and Campbell operate in the consumer defensive sector, specializing in packaged foods, but differ in scale and product diversification. JBS emphasizes protein production and extensive vertical integration including leather and biodiesel, while Campbell focuses on branded meals, beverages, and snacks with a strong retail presence. JBS’s workforce is significantly larger, reflecting its global processing and logistics operations, whereas Campbell leverages brand-driven consumer products with a concentrated geographic footprint.
Income Statement Comparison
Below is a comparison of key income statement metrics for JBS N.V. and Campbell Soup Company for their most recent fiscal years, providing insights into their financial performance.
| Metric | JBS N.V. (2024, BRL) | Campbell Soup Company (2025, USD) |
|---|---|---|
| Market Cap | 31.7B | 7.9B |
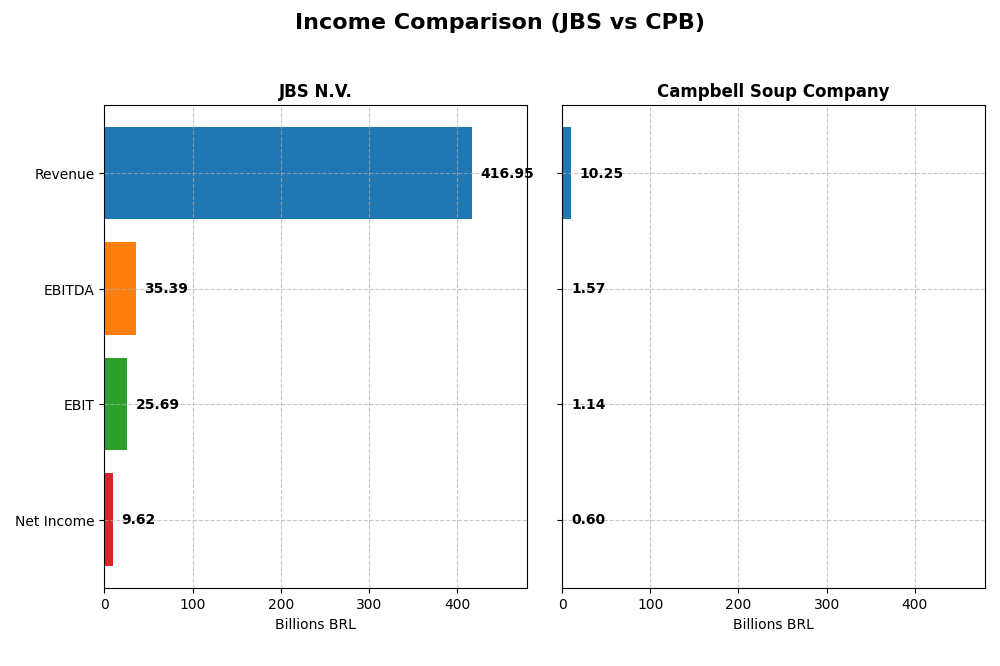
| Revenue | 417B | 10.3B |
| EBITDA | 35.4B | 1.58B |
| EBIT | 25.7B | 1.14B |
| Net Income | 9.6B | 602M |
| EPS | 30.55 | 2.02 |
| Fiscal Year | 2024 | 2025 |
Income Statement Interpretations
JBS N.V.
JBS N.V. displayed strong revenue growth of 54.3% from 2020 to 2024, with net income more than doubling over the period. Margins remained mostly stable, with a 15.1% gross margin and a 2.3% net margin in 2024. The latest year showed significant improvements, including a 14.6% revenue increase and an 890.8% net margin growth, indicating robust profitability recovery.
Campbell Soup Company
Campbell Soup’s revenue rose by 21% from 2021 to 2025, though net income declined by nearly 40%. Margins were generally favorable, with a 30.4% gross margin and a 5.9% net margin in 2025, but net margin growth was negative over the period. The most recent year saw modest revenue growth of 6.4% and a slight net margin decrease, reflecting some margin pressure.
Which one has the stronger fundamentals?
JBS N.V. demonstrates stronger fundamentals with robust revenue and net income growth, alongside improving margins and a high percentage of favorable income statement metrics. Campbell Soup, while maintaining stable gross and EBIT margins, faces declining net income and margin contractions over the overall period. JBS’s more pronounced growth and margin recovery position it more favorably in this comparison.
Financial Ratios Comparison
Below is a comparison of key financial ratios for JBS N.V. and Campbell Soup Company based on their most recent fiscal year data.
| Ratios | JBS N.V. (2024) | Campbell Soup Company (2025) |
|---|---|---|
| ROE | 21.47% | 15.43% |
| ROIC | 8.61% | 7.96% |
| P/E | 3.20 | 15.98 |
| P/B | 0.69 | 2.47 |
| Current Ratio | 1.47 | 0.77 |
| Quick Ratio | 0.90 | 0.28 |
| D/E (Debt-to-Equity) | 3.01 | 1.85 |
| Debt-to-Assets | 53.56% | 48.42% |
| Interest Coverage | 2.33 | 3.92 |
| Asset Turnover | 1.65 | 0.69 |
| Fixed Asset Turnover | 4.85 | 3.71 |
| Payout Ratio | 46.14% | 76.25% |
| Dividend Yield | 14.42% | 4.77% |
Interpretation of the Ratios
JBS N.V.
JBS shows a mix of strong and weak ratios, with a favorable 21.47% ROE and a low PE of 3.2, indicating attractiveness. However, high debt-to-equity (3.01) and debt-to-assets (53.56%) ratios raise leverage concerns. The current ratio at 1.47 is neutral, suggesting adequate liquidity. Dividend yield is 14.42%, supported but caution is warranted given leverage.
Campbell Soup Company
Campbell Soup demonstrates moderate strength with a 15.43% ROE and a neutral net margin of 5.87%. Liquidity ratios are weak, with current and quick ratios below 1. Debt-to-equity at 1.85 is unfavorable but less leveraged than JBS. The 4.77% dividend yield appears sustainable amid neutral coverage ratios, indicating balanced shareholder returns.
Which one has the best ratios?
Both companies exhibit slightly favorable overall ratios. JBS benefits from stronger profitability and valuation metrics but has higher leverage risks. Campbell Soup shows more conservative leverage and steady dividend yield but weaker liquidity. The choice depends on preference for growth and yield versus financial stability and liquidity.
Strategic Positioning
This section compares the strategic positioning of JBS N.V. and Campbell Soup Company, including their market position, key segments, and exposure to technological disruption:
JBS N.V.
- Large global protein and food company with diversified product range, facing competitive food industry pressures.
- Key segments include beef, pork, poultry, leather, biodiesel, and logistics, supporting diverse revenue streams.
- Exposure to technological disruption not explicitly detailed; operates in traditional food processing and logistics.
Campbell Soup Company
- Mid-sized packaged foods firm focused on US and Canada retail and foodservice, competing in snacks and beverages.
- Key segments are Baked Snacks, Beverages, and Soups, driving revenue primarily through branded consumer products.
- No explicit data on technological disruption; operates in established packaged foods and snacks sectors.
JBS N.V. vs Campbell Soup Company Positioning
JBS N.V. pursues a highly diversified strategy across proteins, by-products, and logistics, offering broad market reach but higher operational complexity. Campbell Soup focuses on concentrated branded foods and snacks, simplifying focus but limiting diversification.
Which has the best competitive advantage?
Both companies show slightly favorable moats, creating value with ROIC above WACC but experiencing declining profitability trends, indicating moderate competitive advantages with risks related to sustaining returns.
Stock Comparison
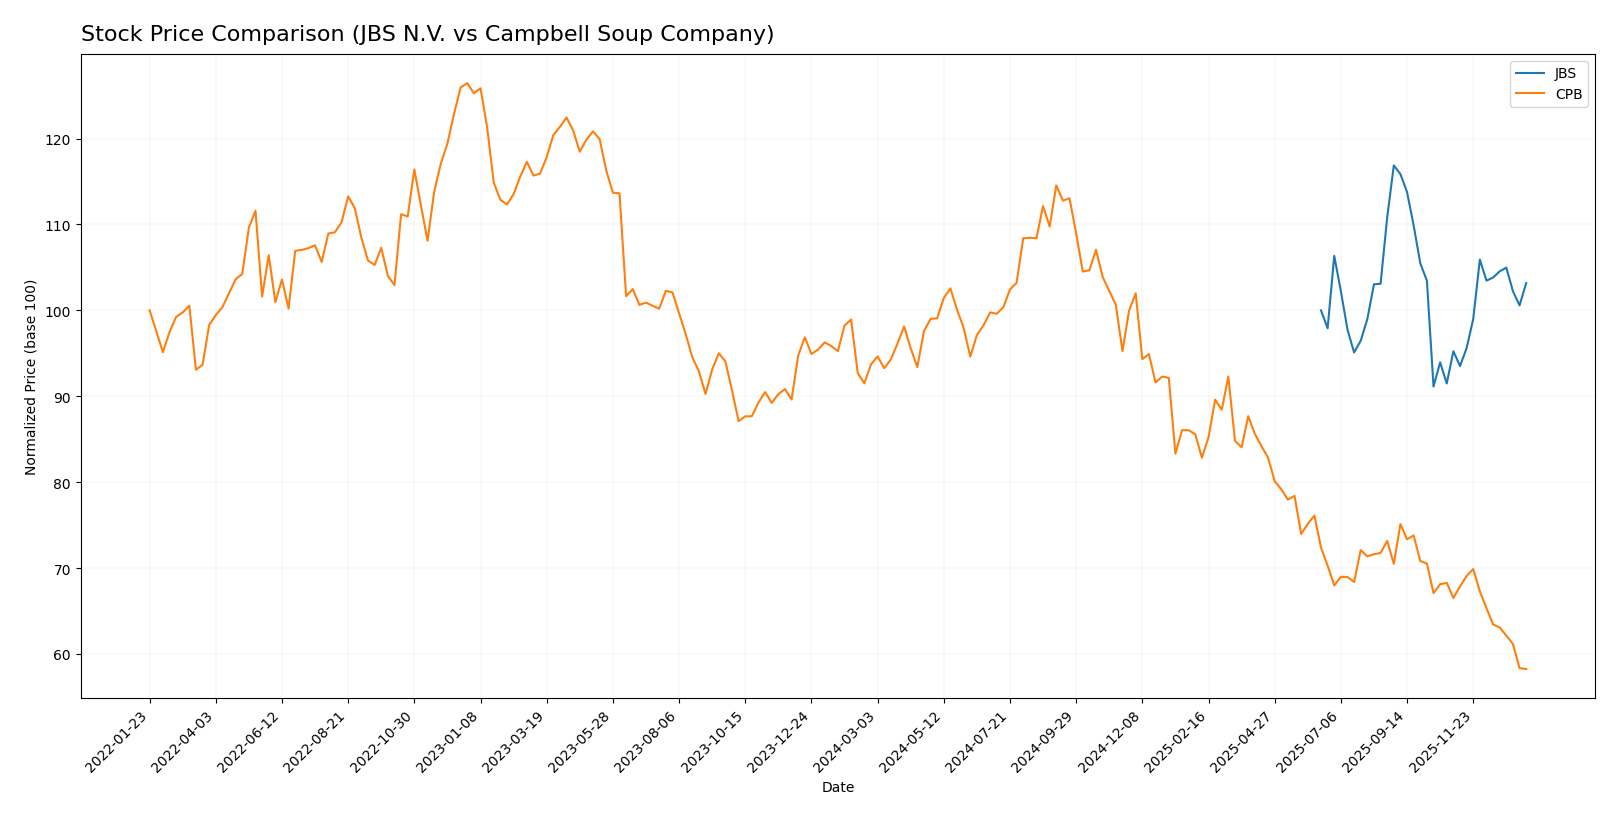
The stock price movements over the past year reveal contrasting dynamics: JBS N.V. shows a modest bullish trend with steady acceleration, while Campbell Soup Company faces a pronounced bearish trend marked by deceleration and significant price decline.
Trend Analysis
JBS N.V. experienced a 3.17% price increase over the past 12 months, indicating a bullish trend with accelerating momentum and moderate volatility (std deviation 0.9). Prices ranged between 12.64 and 16.21.
Campbell Soup Company’s stock declined by 37.83% over the same period, reflecting a bearish trend with deceleration and high volatility (std deviation 6.86). The price fluctuated between 26.39 and 51.89.
Comparing both, JBS N.V. delivered the highest market performance with positive price growth, whereas Campbell Soup Company showed significant losses and downward momentum.
Target Prices
The current consensus target prices indicate moderate upside potential for both JBS N.V. and Campbell Soup Company.
| Company | Target High | Target Low | Consensus |
|---|---|---|---|
| JBS N.V. | 20 | 17 | 18.5 |
| Campbell Soup Company | 38 | 26 | 30.88 |
Analysts expect JBS shares to appreciate from $14.31 to around $18.5, suggesting a favorable risk-reward. Campbell Soup’s consensus target of $30.88 also implies upside from the current $26.39 price, reflecting positive market sentiment.
Analyst Opinions Comparison
This section compares analysts’ ratings and grades for JBS N.V. and Campbell Soup Company:
Rating Comparison
JBS Rating
- Rating: A, considered very favorable by analysts.
- Discounted Cash Flow Score: 4, favorable valuation.
- ROE Score: 5, very favorable profit generation.
- ROA Score: 5, very favorable asset utilization.
- Debt To Equity Score: 1, very unfavorable financial risk.
- Overall Score: 4, favorable overall financial standing.
CPB Rating
- Rating: B-, also marked as very favorable overall.
- Discounted Cash Flow Score: 5, very favorable valuation.
- ROE Score: 3, moderate efficiency in generating equity returns.
- ROA Score: 2, moderate asset efficiency.
- Debt To Equity Score: 1, very unfavorable financial risk.
- Overall Score: 3, moderate overall financial standing.
Which one is the best rated?
Based strictly on the data, JBS holds a higher overall rating (A) and superior scores in ROE and ROA, indicating better profitability and asset use. CPB scores higher only in discounted cash flow, with a lower overall score.
Scores Comparison
The scores comparison between JBS and Campbell Soup Company based on their Altman Z-Score and Piotroski Score is as follows:
JBS Scores
- Altman Z-Score: 10.74, indicating a safe zone.
- Piotroski Score: 8, categorized as very strong.
CPB Scores
- Altman Z-Score: 1.73, indicating a distress zone.
- Piotroski Score: 5, categorized as average.
Which company has the best scores?
JBS shows a significantly higher Altman Z-Score, placing it in the safe zone, and a very strong Piotroski Score of 8. In contrast, Campbell Soup Company’s scores indicate financial distress and average strength.
Grades Comparison
The following section compares the latest grades and ratings from reputable grading companies for JBS N.V. and Campbell Soup Company:
JBS N.V. Grades
This table summarizes recent grades assigned by recognized financial institutions for JBS N.V.:
| Grading Company | Action | New Grade | Date |
|---|---|---|---|
| JP Morgan | Maintain | Overweight | 2025-10-14 |
| JP Morgan | Maintain | Overweight | 2025-09-03 |
| Stephens & Co. | Maintain | Overweight | 2025-08-15 |
| Stephens & Co. | Maintain | Overweight | 2025-06-26 |
Overall, JBS N.V. consistently receives an “Overweight” rating, indicating a positive outlook from its analysts.
Campbell Soup Company Grades
This table shows the latest ratings from multiple established grading companies for Campbell Soup Company:
| Grading Company | Action | New Grade | Date |
|---|---|---|---|
| DA Davidson | Maintain | Neutral | 2025-12-11 |
| RBC Capital | Maintain | Sector Perform | 2025-12-10 |
| Wells Fargo | Maintain | Equal Weight | 2025-12-10 |
| Stifel | Maintain | Hold | 2025-12-10 |
| UBS | Maintain | Sell | 2025-12-10 |
| Bernstein | Maintain | Outperform | 2025-12-10 |
| Stephens & Co. | Maintain | Overweight | 2025-12-08 |
| Morgan Stanley | Maintain | Equal Weight | 2025-12-05 |
| UBS | Maintain | Sell | 2025-12-04 |
| Wells Fargo | Maintain | Equal Weight | 2025-09-25 |
Campbell Soup Company’s ratings show a mixed trend, ranging from “Sell” to “Outperform” with a predominance of neutral and hold ratings.
Which company has the best grades?
JBS N.V. holds a clearer consensus with consistent “Overweight” ratings and a consensus “Buy,” suggesting stronger analyst confidence. Campbell Soup Company presents a more varied rating spectrum and a consensus “Hold,” reflecting greater uncertainty and mixed outlook among analysts. This divergence may affect investor perception of risk and growth potential.
Strengths and Weaknesses
Below is a comparison table highlighting the key strengths and weaknesses of JBS N.V. and Campbell Soup Company based on the most recent financial and operational data.
| Criterion | JBS N.V. | Campbell Soup Company |
|---|---|---|
| Diversification | Global meat processing portfolio, less diversified beyond meat products | Diverse food segments: Baked Snacks, Beverages, Soups |
| Profitability | Moderate net margin (2.31%, unfavorable), strong ROE (21.47%, favorable) | Better net margin (5.87%, neutral), good ROE (15.43%, favorable) |
| Innovation | Stable asset turnover (4.85, favorable), moderate ROIC (8.61%, neutral) | Innovation in snack and beverage segments, moderate ROIC (7.96%, neutral) |
| Global presence | Strong global presence, large scale operations | Primarily North America focused, leading in snacks and soups |
| Market Share | Leading global meat processor, high debt levels (debt-to-assets 53.56%, unfavorable) | Strong in packaged foods, lower debt (debt-to-assets 48.42%, neutral) |
Key takeaways: Both companies are value creators with slightly favorable economic moats, but face declining profitability trends. JBS excels in global reach and asset efficiency but carries higher leverage risk. Campbell is more diversified in food categories with steadier margins but limited global presence.
Risk Analysis
Below is a summary table presenting key risk factors for JBS N.V. and Campbell Soup Company based on the most recent data available in 2026:
| Metric | JBS N.V. | Campbell Soup Company |
|---|---|---|
| Market Risk | Beta 0.48, low volatility | Beta -0.04, very low volatility |
| Debt level | High leverage (D/E 3.01, Debt/Assets 53.6%) | Moderate leverage (D/E 1.85, Debt/Assets 48.4%) |
| Regulatory Risk | Moderate, global food regulations | Moderate, US and international food standards |
| Operational Risk | Large scale, complex supply chain | Diversified product lines, but smaller scale |
| Environmental Risk | Exposure to sustainability regulations in agriculture | Moderate, focus on sustainability initiatives |
| Geopolitical Risk | Exposure to multiple countries including Brazil and NL | Primarily US and Canada, some Latin America exposure |
JBS faces the most impactful risks from its high debt levels and complex global operations, which could increase financial and operational vulnerability. Campbell Soup’s main concern is liquidity weakness and moderate debt, with a potential distress indicated by its Altman Z-Score. Both companies have manageable regulatory and environmental risks in their sectors.
Which Stock to Choose?
JBS N.V. shows a favorable income evolution with strong revenue and net income growth over 2020-2024, supported by a slightly favorable global ratios evaluation and a very favorable rating of A. Profitability is solid with ROE at 21.47%, though debt levels are high with a debt-to-equity ratio of 3.01.
Campbell Soup Company (CPB) presents a favorable income statement overall, but with mixed growth metrics including declining net income and EPS over 2021-2025. Its financial ratios are slightly favorable, featuring moderate profitability and a very favorable rating of B-, while carrying moderate debt levels and weaker liquidity ratios.
Considering the ratings and comprehensive financial results, JBS might appear more attractive for investors seeking growth and strong returns despite higher leverage, whereas CPB could be more suitable for those favoring moderate stability with a slightly favorable moat but facing recent profitability challenges.
Disclaimer: Investment carries a risk of loss of initial capital. The past performance is not a reliable indicator of future results. Be sure to understand risks before making an investment decision.
Go Further
I encourage you to read the complete analyses of JBS N.V. and Campbell Soup Company to enhance your investment decisions: