In the competitive world of packaged foods, Hormel Foods Corporation (HRL) and Campbell Soup Company (CPB) stand out as industry stalwarts with significant market presence and innovative product strategies. Both companies serve diverse consumer needs across multiple food categories, blending tradition with modern innovation. This article will analyze their strengths and challenges to help you decide which company holds the most promise for your investment portfolio in 2026.

Table of contents
Companies Overview
I will begin the comparison between Hormel Foods Corporation and Campbell Soup Company by providing an overview of these two companies and their main differences.
Hormel Foods Corporation Overview
Hormel Foods Corporation develops, processes, and distributes various meat, nuts, and food products to retail, foodservice, deli, and commercial customers in the US and internationally. The company operates through four segments: Grocery Products, Refrigerated Foods, Jennie-O Turkey Store, and International & Other, offering a wide range of perishable and shelf-stable products under multiple brands. Founded in 1891, it is headquartered in Austin, Minnesota.
Campbell Soup Company Overview
Campbell Soup Company manufactures and markets food and beverage products primarily in the US and Canada through its Meals & Beverages and Snacks segments. Its portfolio includes soups, sauces, snacks, and beverages sold under well-known brands. Founded in 1869, Campbell operates in retail, foodservice, and international markets, with a significant presence in Latin America. The company is headquartered in Camden, New Jersey.
Key similarities and differences
Both companies operate in the packaged foods industry with diversified product lines and international reach. Hormel focuses more on meat and perishable products, while Campbell emphasizes soups, sauces, and snack foods. They target retail and foodservice channels but differ in segment structure and product specialization, reflecting distinct approaches within the consumer defensive sector.
Income Statement Comparison
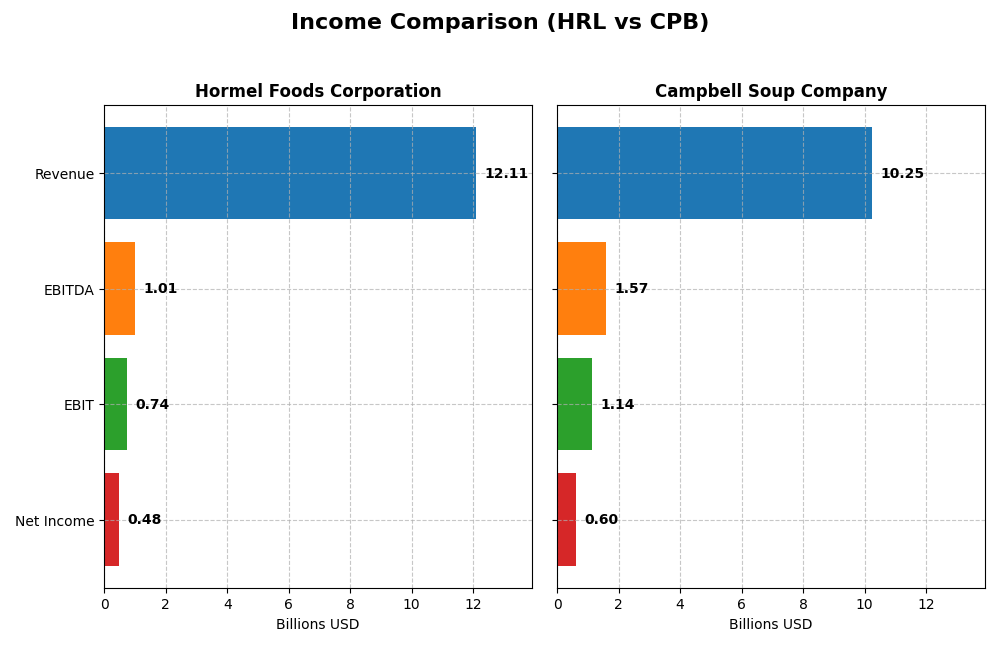
The table below compares the key income statement metrics of Hormel Foods Corporation and Campbell Soup Company for their most recent fiscal year, providing a snapshot of their financial performance.
| Metric | Hormel Foods Corporation | Campbell Soup Company |
|---|---|---|
| Market Cap | 12.6B | 7.9B |
| Revenue | 12.11B | 10.25B |
| EBITDA | 1.01B | 1.58B |
| EBIT | 742M | 1.14B |
| Net Income | 478M | 602M |
| EPS | 0.87 | 2.02 |
| Fiscal Year | 2025 | 2025 |
Income Statement Interpretations
Hormel Foods Corporation
Hormel Foods showed modest revenue growth of 1.55% in the most recent year but experienced a significant decline in net income by 40.82%, reflecting pressure on profitability. Margins remained largely stable, with a gross margin near 15.45% and a net margin around 3.95%, both neutral. The latest fiscal year saw a notable contraction in EBIT and net margin, indicating margin compression and operational challenges.
Campbell Soup Company
Campbell Soup delivered steady revenue growth of 6.4% in the last year and a 13.42% increase in EBIT, supported by favorable margin trends. Gross margin stood robustly at 30.42%, and net margin was 5.87%, both marked favorable. While net income decreased over the overall period, recent EPS growth of 6.35% signals improved profitability in the latest fiscal year.
Which one has the stronger fundamentals?
Campbell Soup demonstrates stronger fundamentals with superior margins and favorable income statement trends, including higher revenue growth and improved EBIT. Hormel Foods shows weaker recent performance marked by declining net income and compressed margins. Overall, Campbell’s income statement indicators are mostly favorable, whereas Hormel’s are predominantly unfavorable, suggesting stronger financial health for Campbell Soup.
Financial Ratios Comparison
This table presents the most recent financial ratios of Hormel Foods Corporation (HRL) and Campbell Soup Company (CPB) for an objective overview of their fiscal performance in 2025.
| Ratios | Hormel Foods Corporation (HRL) | Campbell Soup Company (CPB) |
|---|---|---|
| ROE | 6.04% | 15.43% |
| ROIC | 4.31% | 7.96% |
| P/E | 24.84 | 15.98 |
| P/B | 1.50 | 2.47 |
| Current Ratio | 2.47 | 0.77 |
| Quick Ratio | 1.20 | 0.28 |
| D/E (Debt-to-Equity) | 0.36 | 1.85 |
| Debt-to-Assets | 21.3% | 48.4% |
| Interest Coverage | 9.21 | 3.92 |
| Asset Turnover | 0.90 | 0.69 |
| Fixed Asset Turnover | 5.41 | 3.71 |
| Payout Ratio | 132.4% | 76.2% |
| Dividend Yield | 5.33% | 4.77% |
Interpretation of the Ratios
Hormel Foods Corporation
Hormel shows a mixed ratio profile with strengths in liquidity (current ratio 2.47) and debt management (debt-to-equity 0.36), but weaker profitability metrics like ROE at 6.04% and net margin at 3.95%. Its dividend yield of 5.33% is neutral, suggesting steady shareholder returns, supported by a balance of payout and cash flow coverage without excessive risk.
Campbell Soup Company
Campbell Soup exhibits favorable profitability with ROE at 15.43% and a solid dividend yield of 4.77%. However, liquidity ratios are weak, with a current ratio of 0.77 and quick ratio of 0.28, and higher leverage (debt-to-equity 1.85) raising some concerns. Dividend payments appear sustainable, reflecting a stable focus on shareholder returns despite operational constraints.
Which one has the best ratios?
Both companies show a slightly favorable overall ratio evaluation, but Hormel balances stronger liquidity and debt metrics against weaker profitability, whereas Campbell Soup offers higher returns on equity and dividends but with weaker liquidity and higher leverage. The choice depends on investor priorities between stability and profitability metrics.
Strategic Positioning
This section compares the strategic positioning of Hormel Foods Corporation and Campbell Soup Company, focusing on market position, key segments, and exposure to technological disruption:
Hormel Foods Corporation
- Market leader in packaged foods with diversified segments; faces competitive pressure in meat and grocery sectors.
- Key segments include Retail (7.5B), Foodservice (3.9B), and International (0.7B), driven by meat, poultry, and shelf-stable products.
- Exposure to disruption not explicitly detailed; operates in traditional food segments with established brand portfolios.
Campbell Soup Company
- Operates in packaged foods with focus on soups, snacks, and beverages; competes in retail and foodservice markets.
- Key segments are Baked Snacks (4.4B), Beverages (3.0B), and Soups (2.8B), driven by snacks and meal solutions.
- Exposure to disruption not specified; maintains diverse product lines in meals, snacks, and beverages.
Hormel Foods Corporation vs Campbell Soup Company Positioning
Hormel presents a more diversified portfolio across meat, poultry, and shelf-stable products, while Campbell concentrates on baked snacks, soups, and beverages. Hormel’s broader segment spread contrasts with Campbell’s focused meal and snack offerings, each with distinct market drivers.
Which has the best competitive advantage?
Based on MOAT evaluation, Campbell creates value with ROIC above WACC despite declining profitability, while Hormel is shedding value with decreasing returns, indicating Campbell has a slight competitive advantage.
Stock Comparison
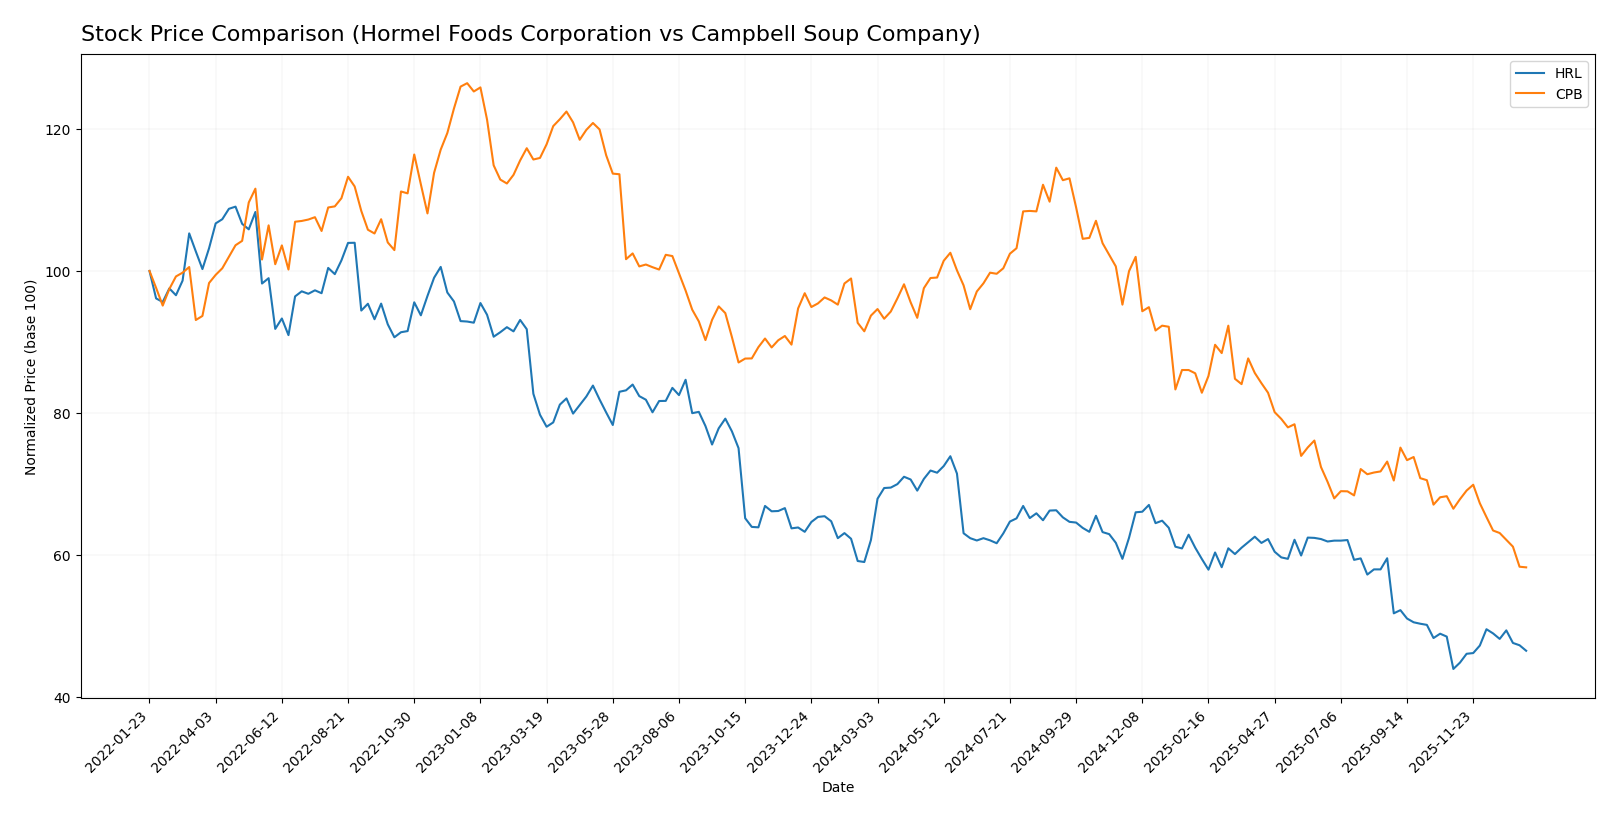
The past 12 months reveal marked bearish trends in the stock prices of Hormel Foods Corporation and Campbell Soup Company, with notable price declines and contrasting recent trading dynamics.
Trend Analysis
Hormel Foods Corporation’s stock experienced a 25.11% decline over the past year, reflecting a bearish trend with accelerating downward momentum. The price ranged from a high of 36.31 to a low of 21.59, exhibiting moderate volatility (std dev 3.52).
Campbell Soup Company’s stock declined by 37.83% over the same period, also bearish but with decelerating downward momentum. It showed higher volatility (std dev 6.86) and a trading range between 51.89 and 26.39.
Comparing both, Hormel Foods delivered a less severe loss and showed a recent positive price change of 5.84%, while Campbell Soup continued a sharper decline, indicating Hormel Foods had the better market performance.
Target Prices
The current analyst consensus presents optimistic target prices for Hormel Foods Corporation and Campbell Soup Company.
| Company | Target High | Target Low | Consensus |
|---|---|---|---|
| Hormel Foods Corporation | 30 | 26 | 27.75 |
| Campbell Soup Company | 38 | 26 | 30.88 |
Analysts expect both stocks to rise from their current prices of $22.85 (HRL) and $26.39 (CPB), indicating potential upside based on consensus targets.
Analyst Opinions Comparison
This section compares analysts’ ratings and grades for Hormel Foods Corporation (HRL) and Campbell Soup Company (CPB):
Rating Comparison
HRL Rating
- Rating: B, considered very favorable overall.
- Discounted Cash Flow Score: 4, indicating favorable valuation on future cash flows.
- ROE Score: 2, moderate efficiency in generating profit from shareholders’ equity.
- ROA Score: 3, moderate effectiveness in asset utilization.
- Debt To Equity Score: 3, moderate financial risk with balanced debt levels.
- Overall Score: 3, reflecting a moderate overall financial standing.
CPB Rating
- Rating: B-, also viewed as very favorable overall.
- Discounted Cash Flow Score: 5, showing a very favorable valuation outlook.
- ROE Score: 3, moderately higher efficiency than HRL in profit generation.
- ROA Score: 2, slightly less effective in asset utilization than HRL.
- Debt To Equity Score: 1, very unfavorable due to higher financial risk.
- Overall Score: 3, also reflecting a moderate overall financial standing.
Which one is the best rated?
Based strictly on the provided data, HRL and CPB share the same overall score of 3, but CPB has a slightly better discounted cash flow and ROE scores, while HRL shows better ROA and debt-to-equity scores. Each has strengths in different areas without a clear overall superiority.
Scores Comparison
Here is a comparison of the Altman Z-Score and Piotroski Score for Hormel Foods Corporation and Campbell Soup Company:
HRL Scores
- Altman Z-Score: 5.17, indicating safe zone
- Piotroski Score: 7, classified as strong
CPB Scores
- Altman Z-Score: 1.73, indicating distress zone
- Piotroski Score: 5, classified as average
Which company has the best scores?
Hormel Foods shows stronger financial stability with a high Altman Z-Score in the safe zone and a strong Piotroski Score. Campbell Soup’s scores indicate higher bankruptcy risk and average financial strength.
Grades Comparison
Here is a comparison of the recent grades assigned to Hormel Foods Corporation and Campbell Soup Company by major financial institutions:
Hormel Foods Corporation Grades
This table summarizes recent analyst grades and recommendations for Hormel Foods Corporation:
| Grading Company | Action | New Grade | Date |
|---|---|---|---|
| Barclays | Maintain | Overweight | 2025-12-09 |
| JP Morgan | Maintain | Overweight | 2025-12-05 |
| B of A Securities | Maintain | Neutral | 2025-12-05 |
| Piper Sandler | Maintain | Neutral | 2025-12-05 |
| JP Morgan | Maintain | Overweight | 2025-11-21 |
| Piper Sandler | Maintain | Neutral | 2025-11-06 |
| Goldman Sachs | Maintain | Buy | 2025-10-30 |
| Goldman Sachs | Maintain | Buy | 2025-08-29 |
| B of A Securities | Maintain | Neutral | 2025-08-29 |
| Barclays | Maintain | Overweight | 2025-08-29 |
The overall trend for Hormel Foods shows a predominance of “Overweight” and “Neutral” grades, with consistent maintenance of “Buy” ratings by Goldman Sachs.
Campbell Soup Company Grades
This table presents recent analyst grades and recommendations for Campbell Soup Company:
| Grading Company | Action | New Grade | Date |
|---|---|---|---|
| DA Davidson | Maintain | Neutral | 2025-12-11 |
| RBC Capital | Maintain | Sector Perform | 2025-12-10 |
| Wells Fargo | Maintain | Equal Weight | 2025-12-10 |
| Stifel | Maintain | Hold | 2025-12-10 |
| UBS | Maintain | Sell | 2025-12-10 |
| Bernstein | Maintain | Outperform | 2025-12-10 |
| Stephens & Co. | Maintain | Overweight | 2025-12-08 |
| Morgan Stanley | Maintain | Equal Weight | 2025-12-05 |
| UBS | Maintain | Sell | 2025-12-04 |
| Wells Fargo | Maintain | Equal Weight | 2025-09-25 |
Campbell Soup’s grades are more mixed, with several “Hold,” “Equal Weight,” and “Sell” ratings, balanced by some “Outperform” and “Overweight” grades.
Which company has the best grades?
Hormel Foods Corporation generally receives stronger and more consistent positive grades, including multiple “Overweight” and “Buy” ratings. Campbell Soup Company’s ratings are more varied and include notable sell-side recommendations. This difference could influence investors’ perception of relative risk and growth potential.
Strengths and Weaknesses
The table below summarizes the key strengths and weaknesses of Hormel Foods Corporation (HRL) and Campbell Soup Company (CPB) based on their diversification, profitability, innovation, global presence, and market share as of 2026.
| Criterion | Hormel Foods Corporation (HRL) | Campbell Soup Company (CPB) |
|---|---|---|
| Diversification | Strong product diversification across food segments including perishable meat, poultry, and shelf-stable products; expanding in foodservice and retail channels. | Diversified product portfolio in baked snacks, soups, beverages, and simple meals, with steady growth in baked snacks. |
| Profitability | Profitability declining with ROIC (4.31%) below WACC (4.86%) indicating value destruction; net margin low at 3.95%. | Profitability better with ROIC (7.96%) above WACC (4.2%), creating value; net margin moderate at 5.87%. |
| Innovation | Moderate innovation focused on specialty and refrigerated foods; no strong recent breakthroughs. | Incremental innovation in snacks and beverages, leveraging evolving consumer preferences. |
| Global presence | Growing international segment but still limited compared to domestic revenue dominance. | Less international exposure, primarily focused on North American markets. |
| Market Share | Leading in perishable meat and specialty foods in U.S.; strong retail footprint. | Strong presence in baked snacks and soups; competitive in simple meals but market share challenged by larger players. |
In summary, Hormel Foods shows strong diversification and a solid retail presence but faces profitability challenges and declining returns on capital. Campbell Soup maintains better profitability and value creation with a focus on baked snacks and soups but has weaker liquidity and higher debt levels, which warrant caution.
Risk Analysis
Below is a comparative table presenting key risks for Hormel Foods Corporation (HRL) and Campbell Soup Company (CPB) based on the most recent 2025 data.
| Metric | Hormel Foods Corporation (HRL) | Campbell Soup Company (CPB) |
|---|---|---|
| Market Risk | Low beta (0.32) indicates low volatility relative to the market | Negative beta (-0.04) suggests weak correlation, slightly unpredictable |
| Debt level | Low debt-to-equity (0.36), debt-to-assets 21.3% (favorable) | High debt-to-equity (1.85), debt-to-assets 48.4% (neutral) |
| Regulatory Risk | Moderate, typical of packaged foods sector | Moderate, with broad product range subject to food safety regulations |
| Operational Risk | Diversified product lines reduce risk, solid asset turnover | Lower asset turnover, liquidity ratios unfavorable, indicating operational challenges |
| Environmental Risk | Moderate, food production impact managed but present | Moderate, similar exposure in food and beverage production |
| Geopolitical Risk | Low, primarily US-based with some international exposure | Moderate, with North American and Latin American markets involved |
Hormel’s low market volatility and strong liquidity ratios mitigate risk effectively, while Campbell shows higher financial leverage and liquidity concerns, placing it in a more vulnerable position. Campbell’s Altman Z-Score in the distress zone highlights elevated bankruptcy risk compared to Hormel’s safe zone score. Investors should weigh Hormel’s financial stability against Campbell’s higher leverage when managing portfolio risk.
Which Stock to Choose?
Hormel Foods Corporation (HRL) shows a declining income trend with unfavorable growth in net margin and EPS over recent years. Its financial ratios are slightly favorable, supported by solid liquidity and manageable debt, yet profitability remains low. The company’s rating is very favorable, and its scores indicate strong financial health with a safe Altman Z-Score and robust Piotroski score. However, its economic moat is very unfavorable due to declining ROIC below WACC.
Campbell Soup Company (CPB) presents a more favorable income statement with positive EBIT margin and moderate revenue growth, though net income has declined. Its financial ratios are slightly favorable overall but show concerns in liquidity and high debt levels. The rating is also very favorable with mixed score results: a safe Piotroski score but an Altman Z-Score in the distress zone. CPB’s moat is slightly favorable, creating value despite a declining ROIC trend.
For investors prioritizing economic moat and financial stability, HRL’s strong rating and scores but declining profitability might signal caution. Conversely, CPB’s value creation and better income metrics could appeal to those focusing on operational performance despite liquidity risks. Thus, the choice might depend on whether emphasis is placed on financial strength or income statement favorability.
Disclaimer: Investment carries a risk of loss of initial capital. The past performance is not a reliable indicator of future results. Be sure to understand risks before making an investment decision.
Go Further
I encourage you to read the complete analyses of Hormel Foods Corporation and Campbell Soup Company to enhance your investment decisions: