General Mills, Inc. (GIS) and Campbell Soup Company (CPB) are two stalwarts in the packaged foods industry, each boasting a rich history and a diverse product portfolio. Both companies compete in overlapping markets, focusing on innovation and expanding their presence in retail and foodservice channels. This comparison aims to highlight their strategic strengths and market positions, helping you decide which stock might be the smarter addition to your investment portfolio. Let’s dive in and uncover which company stands out for investors.
Table of contents
Companies Overview
I will begin the comparison between General Mills and Campbell Soup by providing an overview of these two companies and their main differences.
General Mills Overview
General Mills, Inc. is a global manufacturer and marketer of branded consumer foods, operating in segments including North America Retail and Pet products. The company offers a diverse portfolio ranging from ready-to-eat cereals and refrigerated yogurt to pet food. Established in 1866 and headquartered in Minneapolis, it serves multiple retail and foodservice channels worldwide, positioning itself as a major player in the packaged foods industry with a market cap of approximately 23.7B USD.
Campbell Soup Overview
Campbell Soup Company produces and markets food and beverage products primarily in the U.S. and internationally. It operates through Meals & Beverages and Snacks segments, offering soups, sauces, juices, and a variety of snack products such as cookies and crackers. Founded in 1869 and based in Camden, NJ, Campbell Soup serves retail and foodservice customers with a focus on both North American and Latin American markets, holding a market cap near 7.9B USD.
Key similarities and differences
Both companies operate in the packaged foods sector with a strong presence in North America and diversified product portfolios spanning meals and snacks. General Mills has a broader global footprint and a larger market capitalization, while Campbell Soup emphasizes its Snacks segment and international retail business in Latin America. Each company sells through multiple channels including retail chains and e-commerce, but they differ in scale and segment focus, reflecting distinct strategic priorities within the consumer defensive sector.
Income Statement Comparison
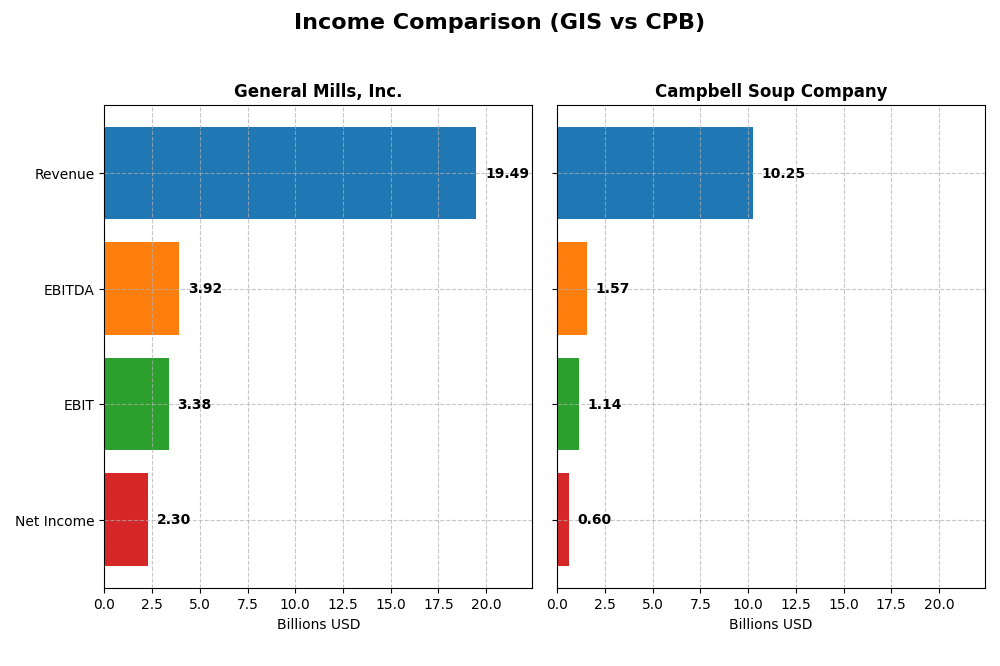
This table compares key financial metrics from the most recent fiscal year for General Mills, Inc. and Campbell Soup Company, providing a snapshot of their income statement performance.
| Metric | General Mills, Inc. | Campbell Soup Company |
|---|---|---|
| Market Cap | 23.7B | 7.9B |
| Revenue | 19.5B | 10.3B |
| EBITDA | 3.9B | 1.6B |
| EBIT | 3.4B | 1.1B |
| Net Income | 2.3B | 602M |
| EPS | 4.12 | 2.02 |
| Fiscal Year | 2025 | 2025 |
Income Statement Interpretations
General Mills, Inc.
General Mills showed modest revenue growth of 7.5% from 2021 to 2025 but experienced a net income decline of 1.9% over the same period. Margins remained generally favorable, with a gross margin of 34.55% and net margin of 11.78%, although both contracted slightly in the latest year. The 2025 fiscal year saw a 1.87% revenue drop and a 6.32% decrease in net margin, signaling some pressure on profitability.
Campbell Soup Company
Campbell Soup’s revenue grew 20.97% over 2021-2025, with a 6.4% increase in 2025 alone, reflecting solid top-line momentum. However, net income fell sharply by nearly 40% over the five years, dragged down by a 50.33% net margin contraction. Despite this, gross and EBIT margins were stable and favorable, and the company improved EBIT by 13.42% in 2025, indicating operational gains.
Which one has the stronger fundamentals?
Campbell Soup exhibits stronger income statement fundamentals, with a higher proportion of favorable income metrics and consistent revenue expansion, albeit offset by net income and margin declines. General Mills maintains better margin stability but faces declining profitability and revenue contraction recently. The balance of growth and margin trends suggests differing strengths and challenges for each company’s fundamentals.
Financial Ratios Comparison
The table below presents the most recent key financial ratios for General Mills, Inc. (GIS) and Campbell Soup Company (CPB) based on their 2025 fiscal year data.
| Ratios | General Mills, Inc. (GIS) | Campbell Soup Company (CPB) |
|---|---|---|
| ROE | 24.95% | 15.43% |
| ROIC | 9.62% | 7.96% |
| P/E | 12.90 | 15.98 |
| P/B | 3.22 | 2.47 |
| Current Ratio | 0.67 | 0.77 |
| Quick Ratio | 0.43 | 0.28 |
| D/E (Debt-to-Equity) | 1.66 | 1.85 |
| Debt-to-Assets | 46.25% | 48.42% |
| Interest Coverage | 6.02 | 3.92 |
| Asset Turnover | 0.59 | 0.69 |
| Fixed Asset Turnover | 4.83 | 3.71 |
| Payout Ratio | 58.33% | 76.25% |
| Dividend Yield | 4.52% | 4.77% |
Interpretation of the Ratios
General Mills, Inc.
General Mills shows a mix of strengths and weaknesses in its ratios. The company benefits from a favorable net margin of 11.78% and a strong return on equity at 24.95%, but it suffers from an unfavorable current ratio of 0.67 and high debt-to-equity at 1.66. The dividend yield is attractive at 4.52%, supported by a stable payout, though the balance between distributions and free cash flow coverage should be monitored carefully.
Campbell Soup Company
Campbell Soup’s ratios present a balanced but cautious picture. Its return on equity is favorable at 15.43%, while the net margin is neutral at 5.87%. The current ratio of 0.77 and quick ratio of 0.28 indicate liquidity concerns, and its debt-to-equity ratio of 1.85 adds to financial leverage risks. Dividend yield stands at 4.77%, with a consistent payout but moderate interest coverage that warrants attention.
Which one has the best ratios?
Both companies have slightly favorable overall ratio profiles, but General Mills exhibits stronger profitability and coverage ratios, offset by some liquidity and leverage concerns. Campbell Soup shows more neutral to unfavorable liquidity and leverage metrics but maintains a solid dividend yield. The choice depends on weighing profitability against financial stability factors.
Strategic Positioning
This section compares the strategic positioning of General Mills, Inc. and Campbell Soup Company, focusing on market position, key segments, and exposure to technological disruption:
General Mills, Inc.
- Larger market cap at $23.7B, operates in multiple global markets, faces broad competitive pressure.
- Diversified segments: cereals, snacks, pet food, baking, yogurt, meals, ice cream, and vegetables.
- No explicit data on technological disruption exposure provided in the profile or segments.
Campbell Soup Company
- Smaller market cap at $7.9B, competes mainly in U.S. and Canada with retail and foodservice focus.
- Concentrated on baked snacks, beverages, and soups with clear focus on Meals & Beverages and Snacks.
- No explicit data on technological disruption exposure provided in the profile or segments.
General Mills, Inc. vs Campbell Soup Company Positioning
General Mills demonstrates a diversified business model across multiple food categories and global markets, offering a broad revenue base. Campbell Soup has a more concentrated portfolio focused on snacks, beverages, and soups, primarily in North America, potentially limiting exposure but increasing reliance on fewer segments.
Which has the best competitive advantage?
General Mills shows a very favorable moat with growing ROIC above WACC, indicating a durable competitive advantage. Campbell Soup also creates value but has a slightly favorable moat with declining ROIC, suggesting weakening profitability and competitive position.
Stock Comparison
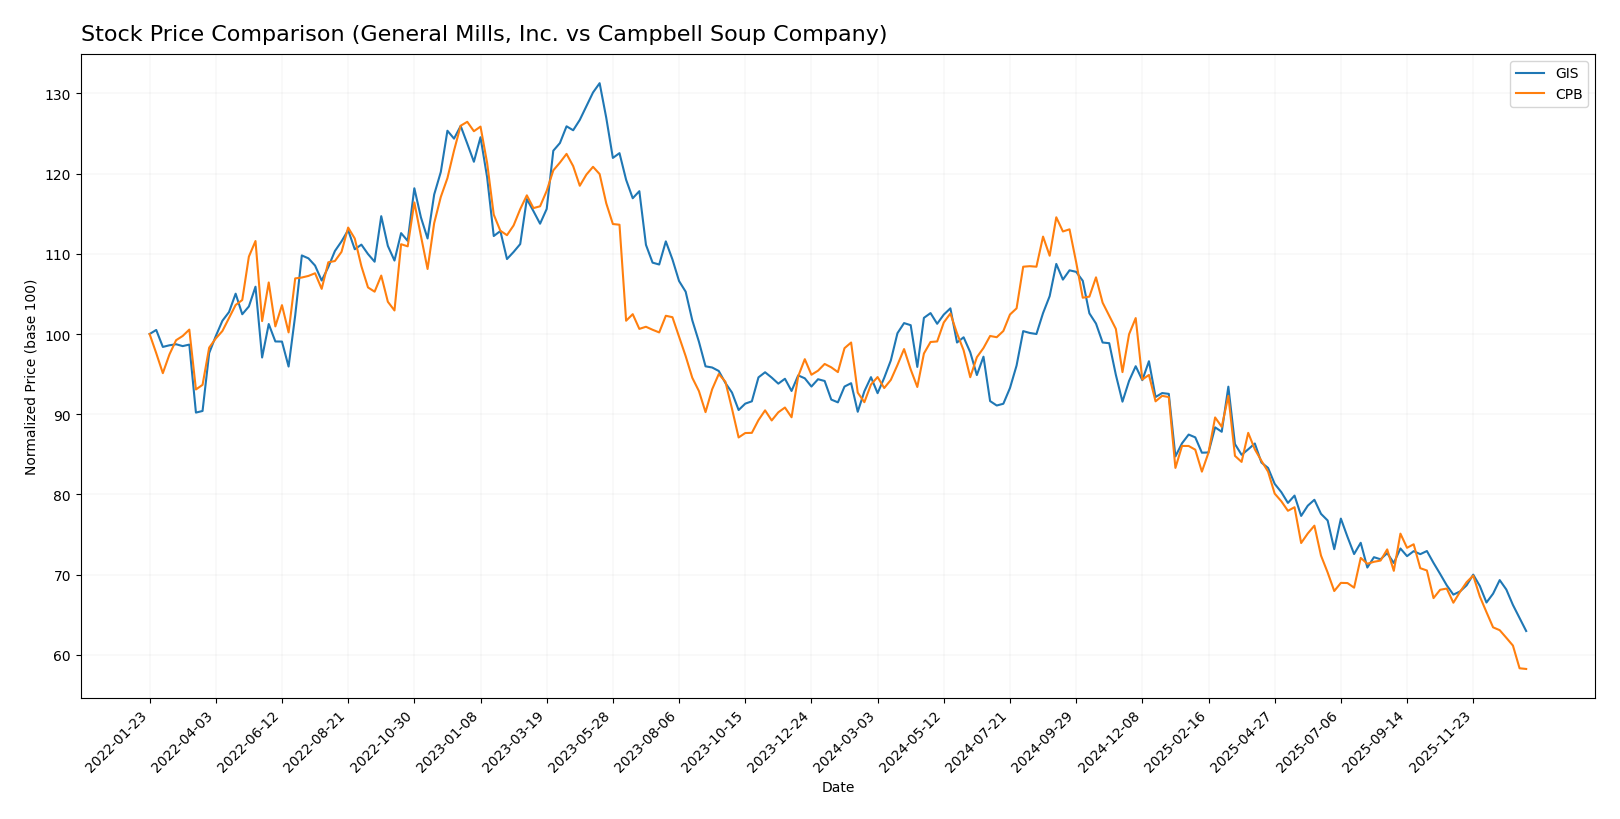
The stock price trajectories of General Mills, Inc. (GIS) and Campbell Soup Company (CPB) over the past 12 months reveal significant declines, with both experiencing bearish trends marked by notable price drops and differing acceleration patterns.
Trend Analysis
General Mills, Inc. (GIS) shows a bearish trend over the past year with a -33.44% price change, accompanied by accelerating decline and high volatility (std deviation 8.84). Prices ranged from 75.06 to 43.48.
Campbell Soup Company (CPB) also exhibits a bearish trend with a -37.83% price change, but its decline is decelerating and somewhat less volatile (std deviation 6.86). The price moved between 51.89 and 26.39.
Comparing both, CPB’s stock has experienced the largest loss in market value over the past year, underperforming GIS despite GIS’s accelerated bearish movement.
Target Prices
Analysts provide a clear consensus on target prices for General Mills, Inc. and Campbell Soup Company.
| Company | Target High | Target Low | Consensus |
|---|---|---|---|
| General Mills, Inc. | 63 | 47 | 52.2 |
| Campbell Soup Company | 38 | 26 | 30.88 |
The consensus targets suggest upside potential for both stocks compared to current prices: General Mills at 43.48 versus a 52.2 consensus and Campbell Soup at 26.39 versus 30.88. Analysts expect moderate appreciation reflecting stable fundamentals.
Analyst Opinions Comparison
This section compares analysts’ ratings and grades for General Mills, Inc. (GIS) and Campbell Soup Company (CPB):
Rating Comparison
GIS Rating
- Rating: A-, considered very favorable by analysts.
- Discounted Cash Flow Score: 5, indicating very favorable valuation.
- ROE Score: 5, showing strong profitability efficiency.
- ROA Score: 4, demonstrating favorable asset utilization.
- Debt To Equity Score: 1, considered very unfavorable due to high leverage.
- Overall Score: 4, rated favorable overall.
CPB Rating
- Rating: B-, also marked very favorable.
- Discounted Cash Flow Score: 5, indicating very favorable valuation.
- ROE Score: 3, reflecting moderate profitability efficiency.
- ROA Score: 2, indicating moderate asset utilization.
- Debt To Equity Score: 1, also very unfavorable for leverage.
- Overall Score: 3, rated moderate overall.
Which one is the best rated?
Based strictly on the data, GIS holds a higher overall rating (A- vs. B-) and superior scores in ROE, ROA, and overall assessment. Both have equally unfavorable debt-to-equity scores, but GIS’s financial health metrics are generally stronger.
Scores Comparison
Here is a comparison of the financial scores for General Mills, Inc. and Campbell Soup Company:
GIS Scores
- Altman Z-Score: 2.43, indicating grey zone risk of bankruptcy.
- Piotroski Score: 6, reflecting average financial strength.
CPB Scores
- Altman Z-Score: 1.73, indicating distress zone with higher bankruptcy risk.
- Piotroski Score: 5, reflecting average financial strength.
Which company has the best scores?
Based on the provided data, General Mills has a higher Altman Z-Score, placing it in the grey zone versus Campbell’s distress zone. Both have average Piotroski Scores, but General Mills’ scores suggest comparatively better financial stability.
Grades Comparison
Here is a comparison of the recent grades assigned to General Mills, Inc. and Campbell Soup Company by reputable grading firms:
General Mills, Inc. Grades
The following table summarizes recent grades from well-known financial institutions for General Mills, Inc.:
| Grading Company | Action | New Grade | Date |
|---|---|---|---|
| Wells Fargo | Maintain | Equal Weight | 2026-01-05 |
| Morgan Stanley | Maintain | Underweight | 2025-12-22 |
| Wells Fargo | Maintain | Equal Weight | 2025-12-18 |
| TD Cowen | Maintain | Hold | 2025-12-18 |
| Bernstein | Maintain | Market Perform | 2025-12-18 |
| TD Cowen | Maintain | Hold | 2025-12-15 |
| Wells Fargo | Maintain | Equal Weight | 2025-12-12 |
| Stifel | Maintain | Buy | 2025-12-11 |
| Jefferies | Maintain | Hold | 2025-12-11 |
| Mizuho | Maintain | Neutral | 2025-09-19 |
The overall trend for General Mills shows a predominance of hold or equal weight ratings, with a single buy rating and no strong buy or sell recommendations.
Campbell Soup Company Grades
Below is the table of recent grades from recognized grading companies for Campbell Soup Company:
| Grading Company | Action | New Grade | Date |
|---|---|---|---|
| DA Davidson | Maintain | Neutral | 2025-12-11 |
| RBC Capital | Maintain | Sector Perform | 2025-12-10 |
| Wells Fargo | Maintain | Equal Weight | 2025-12-10 |
| Stifel | Maintain | Hold | 2025-12-10 |
| UBS | Maintain | Sell | 2025-12-10 |
| Bernstein | Maintain | Outperform | 2025-12-10 |
| Stephens & Co. | Maintain | Overweight | 2025-12-08 |
| Morgan Stanley | Maintain | Equal Weight | 2025-12-05 |
| UBS | Maintain | Sell | 2025-12-04 |
| Wells Fargo | Maintain | Equal Weight | 2025-09-25 |
Campbell Soup Company’s grades exhibit a wider range, including sell, hold, and outperform ratings, reflecting more diverse opinions among analysts.
Which company has the best grades?
General Mills, Inc. generally holds a more stable and conservative rating profile with mostly hold and equal weight grades, whereas Campbell Soup Company shows a broader spectrum from sell to outperform. This variability in Campbell’s grades may indicate higher analyst disagreement, potentially increasing uncertainty for investors.
Strengths and Weaknesses
Below is a comparison of key strengths and weaknesses for General Mills, Inc. (GIS) and Campbell Soup Company (CPB) based on recent financial and operational data:
| Criterion | General Mills, Inc. (GIS) | Campbell Soup Company (CPB) |
|---|---|---|
| Diversification | Highly diversified product portfolio including snacks (4.19B), cereals (3.08B), pet food (2.59B), and more | Moderate diversification focused on baked snacks (4.43B), beverages (3.05B), and soups (2.78B) |
| Profitability | Strong profitability with net margin at 11.78%, ROE 24.95%, and favorable PE of 12.9 | Moderate profitability; net margin at 5.87%, ROE 15.43%, PE slightly higher at 15.98 |
| Innovation | Consistent investment in product innovation supporting growing ROIC trend (+2.87%) and a very favorable economic moat | Innovation appears limited with declining ROIC trend (-16.7%), suggesting challenges in maintaining competitive edge |
| Global presence | Strong global footprint with multiple product segments targeting various markets | More regional focus with product lines centered in North America, less global reach |
| Market Share | Large market share in snacks and cereals with steady revenue growth across segments | Significant share in baked snacks and soups but facing stagnation and slight decline in some categories |
Key takeaways: General Mills exhibits a durable competitive advantage with strong profitability, growing returns, and a well-diversified product base, making it a more robust long-term investment. Campbell Soup, while still profitable, shows signs of declining efficiency and less diversification, warranting cautious consideration.
Risk Analysis
The table below summarizes key risk factors for General Mills, Inc. (GIS) and Campbell Soup Company (CPB) based on the latest available data from 2025.
| Metric | General Mills, Inc. (GIS) | Campbell Soup Company (CPB) |
|---|---|---|
| Market Risk | Moderate, beta: -0.068 (low sensitivity to market swings) | Moderate, beta: -0.043 (low sensitivity to market swings) |
| Debt level | High debt-to-equity ratio (1.66), debt-to-assets 46.25% | Higher debt-to-equity ratio (1.85), debt-to-assets 48.42% |
| Regulatory Risk | Moderate, operates globally with food safety regulations | Moderate, exposure to U.S. and international food regulations |
| Operational Risk | Medium, diverse product range and supply chain complexity | Medium, diversified product segments but smaller scale than GIS |
| Environmental Risk | Moderate, sustainability initiatives ongoing but food production impact | Moderate, increasing focus on reducing environmental footprint |
| Geopolitical Risk | Moderate, operations in multiple regions including emerging markets | Moderate, exposure to North America and Latin America markets |
The most impactful risks are the relatively high debt levels for both companies, with CPB slightly more leveraged, which could pressure financial flexibility. Market risk is mitigated by their low beta values, reflecting defensive consumer staples profiles. Regulatory and operational risks remain moderate given their global footprints and product diversity. Monitoring debt management and regulatory changes is essential for risk-conscious investors.
Which Stock to Choose?
General Mills, Inc. (GIS) shows a slightly unfavorable income statement trend with declining revenues and net margin but maintains favorable profitability and efficiency ratios, supported by a strong rating of A- and a very favorable economic moat indicating durable competitive advantage. Its debt levels and liquidity ratios are less favorable, and scores place it in a grey zone for financial distress.
Campbell Soup Company (CPB) demonstrates a favorable income statement with steady revenue growth and improved EBIT, though net income growth is negative overall. Financial ratios are slightly favorable with moderate profitability and a B- rating. The company creates value but shows a declining ROIC trend and scores in the distress zone, suggesting caution.
Investors prioritizing durable competitive advantages and stable profitability might find GIS more appealing due to its very favorable moat and higher rating, while those focusing on recent income growth and moderate ratios could see CPB as a different profile fit despite its declining profitability trend. The choice might depend on the investor’s risk tolerance and investment strategy.
Disclaimer: Investment carries a risk of loss of initial capital. The past performance is not a reliable indicator of future results. Be sure to understand risks before making an investment decision.
Go Further
I encourage you to read the complete analyses of General Mills, Inc. and Campbell Soup Company to enhance your investment decisions: