In the competitive world of packaged foods, Conagra Brands, Inc. (CAG) and Campbell Soup Company (CPB) stand out as two major players with strong market presence and diverse product portfolios. Both companies focus on innovation and expanding their reach across retail and foodservice channels, addressing evolving consumer tastes. This comparison will help you, the investor, identify which company offers the most compelling opportunity for your portfolio in 2026.
Table of contents
Companies Overview
I will begin the comparison between Conagra Brands and Campbell Soup by providing an overview of these two companies and their main differences.
Conagra Brands Overview
Conagra Brands, Inc. is a North American consumer packaged goods food company operating through four segments: Grocery & Snacks, Refrigerated & Frozen, International, and Foodservice. It offers a broad portfolio of shelf-stable, temperature-controlled, and customized food products under well-known brands like Birds Eye and Duncan Hines. Headquartered in Chicago, Conagra has a market cap of approximately 7.98B USD and employs around 18,500 people.
Campbell Soup Overview
Campbell Soup Company manufactures and markets food and beverage products primarily in the US and Canada, with international presence. It operates through Meals & Beverages and Snacks segments, offering products such as soups, sauces, snacks, and beverages under brands like Pepperidge Farm and V8. Based in Camden, New Jersey, Campbell Soup has a market cap near 7.86B USD and employs about 14,400 people.
Key similarities and differences
Both companies operate in the packaged foods industry with diversified product lines targeting retail and foodservice channels. Conagra focuses on temperature-varied products across multiple segments including international markets, whereas Campbell Soup emphasizes meals, beverages, and snacks with a strong presence in North America and Latin America. Their business models share distribution through various retail channels but differ in segment specialization and geographic reach.
Income Statement Comparison
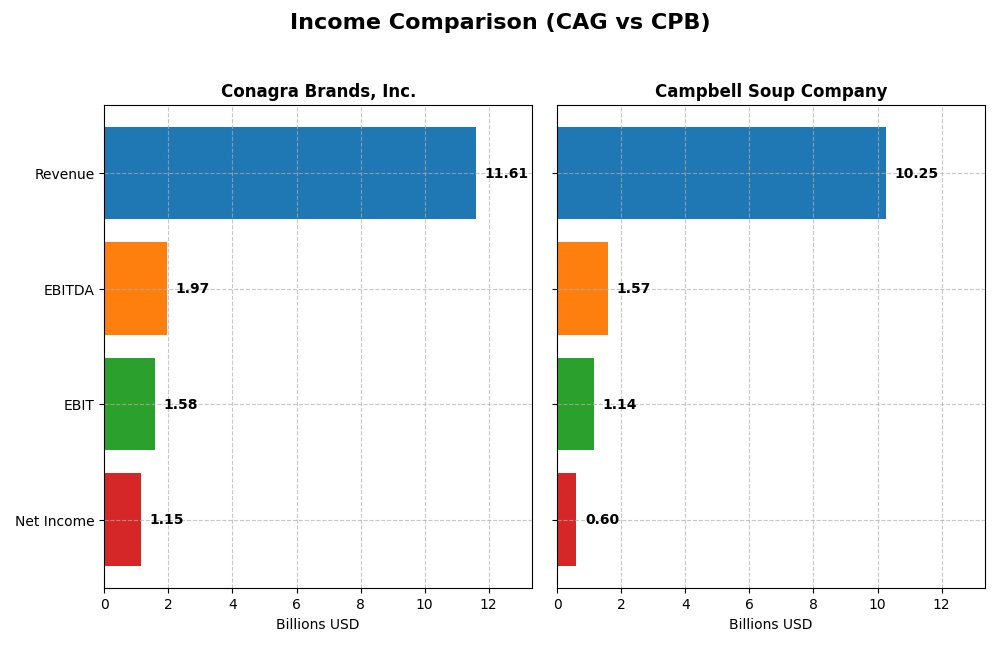
This table presents a side-by-side comparison of key income statement metrics for Conagra Brands, Inc. and Campbell Soup Company for the fiscal year 2025.
| Metric | Conagra Brands, Inc. (CAG) | Campbell Soup Company (CPB) |
|---|---|---|
| Market Cap | 7.98B | 7.86B |
| Revenue | 11.61B | 10.25B |
| EBITDA | 1.97B | 1.58B |
| EBIT | 1.58B | 1.14B |
| Net Income | 1.15B | 602M |
| EPS | 2.41 | 2.02 |
| Fiscal Year | 2025 | 2025 |
Income Statement Interpretations
Conagra Brands, Inc.
Conagra’s revenue showed a slight overall increase of 3.83% from 2021 to 2025 but declined by 3.64% in 2025 alone. Net income decreased by 11.27% over the period, though it surged significantly in 2025 compared to 2024, supported by a strong 244.43% net margin growth. Margins remain favorable, with a gross margin of 25.86% and an ebit margin of 13.57%. The latest year’s performance reveals improved profitability despite revenue softness.
Campbell Soup Company
Campbell Soup’s revenue grew steadily by 20.97% over 2021-2025, with a 6.4% increase in 2025. Net income declined sharply by nearly 40% over the period, and net margin contracted by over 50%. While gross margin stayed robust at 30.42%, ebit margin was lower at 11.13%. The latest year saw moderate earnings per share growth but a slight drop in net margin, indicating mixed profitability trends despite top-line growth.
Which one has the stronger fundamentals?
Both companies exhibit favorable global income statement evaluations, scoring 57.14% favorable metrics. Conagra shows better margin stability and significant recent margin expansion, while Campbell Soup demonstrates stronger revenue growth but more pronounced net income and margin deterioration. Conagra’s improved profitability in the latest year contrasts with Campbell’s weaker margin trends, presenting a nuanced fundamental comparison.
Financial Ratios Comparison
Below is a comparison of key financial ratios for Conagra Brands, Inc. (CAG) and Campbell Soup Company (CPB) based on their most recent fiscal year data.
| Ratios | Conagra Brands, Inc. (2025) | Campbell Soup Company (2025) |
|---|---|---|
| ROE | 12.9% | 15.4% |
| ROIC | 7.4% | 7.96% |
| P/E | 9.30 | 15.98 |
| P/B | 1.20 | 2.47 |
| Current Ratio | 0.71 | 0.77 |
| Quick Ratio | 0.24 | 0.28 |
| D/E (Debt-to-Equity) | 0.93 | 1.85 |
| Debt-to-Assets | 39.7% | 48.4% |
| Interest Coverage | 3.27 | 3.92 |
| Asset Turnover | 0.55 | 0.69 |
| Fixed Asset Turnover | 4.09 | 3.71 |
| Payout Ratio | 58.1% | 76.2% |
| Dividend Yield | 6.25% | 4.77% |
Interpretation of the Ratios
Conagra Brands, Inc.
Conagra Brands shows a mix of neutral and favorable ratios, with a price-to-earnings (PE) ratio of 9.3 and a price-to-book (PB) ratio of 1.2 indicating relative valuation strength. However, its current and quick ratios are below 1, suggesting liquidity concerns. The dividend yield is 6.25%, supported by stable payouts, though caution is warranted on cash flow coverage given recent negative free cash flow to equity.
Campbell Soup Company
Campbell Soup features a generally balanced ratio profile with a higher return on equity (ROE) of 15.43% and a favorable weighted average cost of capital (WACC) at 4.2%. The dividend yield stands at 4.77%, backed by manageable payout levels. Some liquidity ratios and debt-to-equity are less favorable, reflecting potential leverage risks, while asset turnover remains neutral.
Which one has the best ratios?
Both companies exhibit a slightly favorable overall ratio profile, though Conagra Brands benefits from stronger valuation metrics and dividend yield. Campbell Soup’s higher ROE and lower WACC are positive but its increased leverage and weaker liquidity ratios present cautious signals. Overall, neither stands out decisively, as strengths and weaknesses balance out in each case.
Strategic Positioning
This section compares the strategic positioning of Conagra Brands, Inc. (CAG) and Campbell Soup Company (CPB) across market position, key segments, and exposure to technological disruption:
Conagra Brands, Inc. (CAG)
- Large US packaged foods player with diversified segment presence facing consumer defensive competition.
- Operates four segments: Grocery & Snacks, Refrigerated & Frozen, International, and Foodservice.
- Exposure to technological disruption not explicitly detailed in available data.
Campbell Soup Company (CPB)
- Similar market cap, US-based packaged foods firm with competitive pressure in consumer defensive sector.
- Operates Meals & Beverages and Snacks segments, including baked snacks, beverages, and soups.
- No explicit data on technological disruption exposure provided.
CAG vs CPB Positioning
CAG has a more diversified segment structure including international and foodservice channels, while CPB focuses more on meals, beverages, and snacks with some international retail presence. CAG’s broader segmentation may offer varied business drivers; CPB’s focus is more concentrated.
Which has the best competitive advantage?
Both companies create value with ROIC above WACC but face declining profitability trends. Their MOAT evaluations are slightly favorable without clear superiority between them based on the provided data.
Stock Comparison
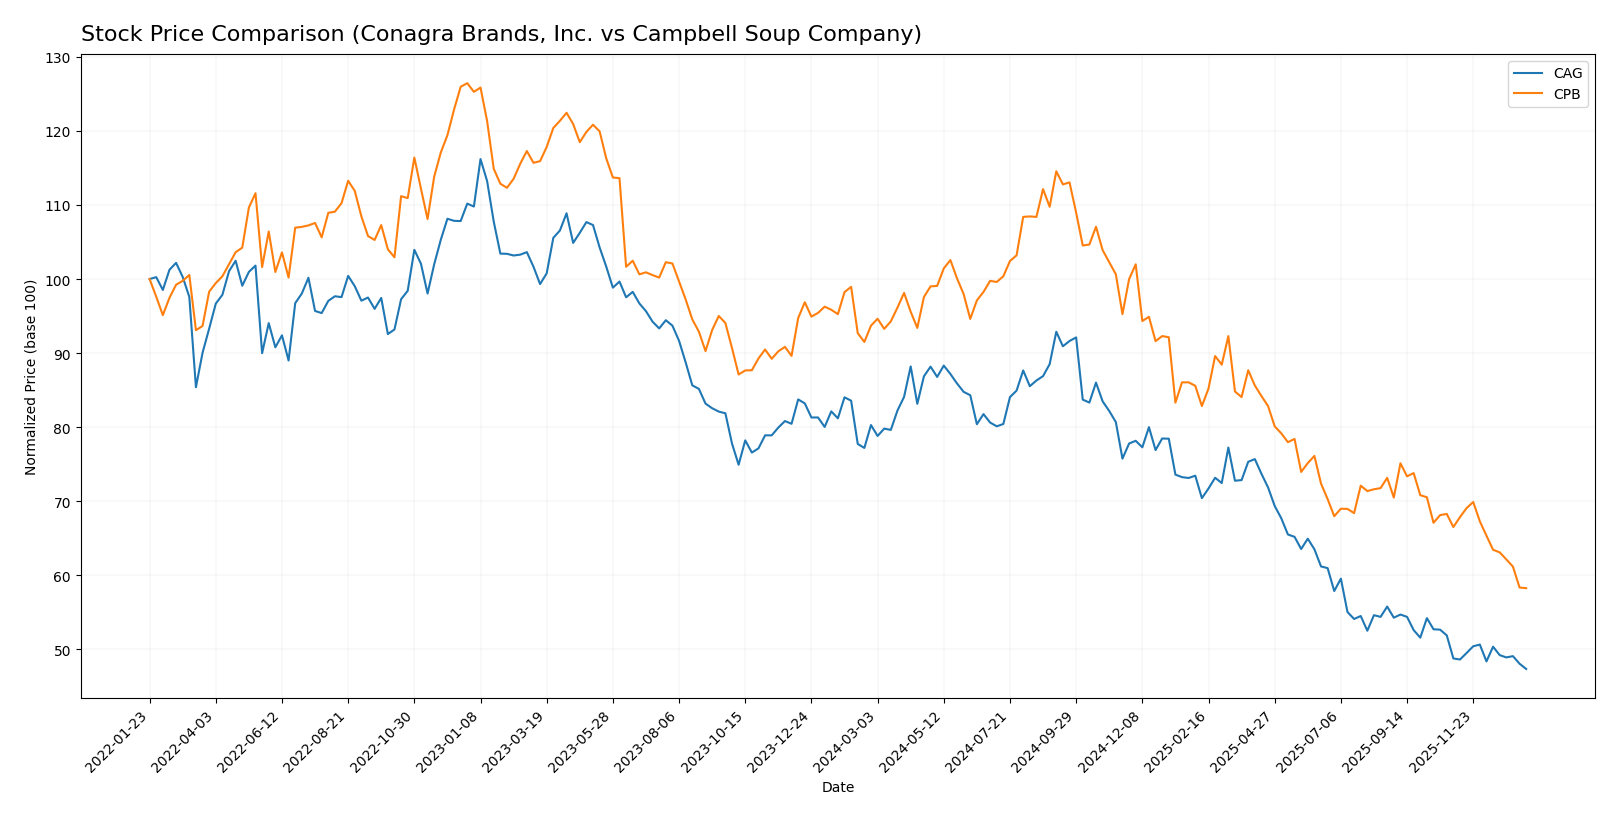
The stock price performance of Conagra Brands, Inc. (CAG) and Campbell Soup Company (CPB) over the past year reveals significant declines with differing volatility and trend dynamics.
Trend Analysis
Conagra Brands, Inc. (CAG) experienced a bearish trend over the past 12 months with a price decline of 41.02%. The trend shows acceleration, marked by a high volatility of 4.93 and a price range from 32.74 to 16.69.
Campbell Soup Company (CPB) also followed a bearish trend with a 37.83% price drop over the same period. Its trend shows deceleration and a higher volatility of 6.86, with prices ranging between 51.89 and 26.39.
Comparing the two, CAG’s stock has delivered a slightly worse market performance than CPB, reflecting a steeper decline and accelerating bearish momentum.
Target Prices
Analysts present a clear consensus on target prices for Conagra Brands, Inc. and Campbell Soup Company, reflecting moderate upside potential.
| Company | Target High | Target Low | Consensus |
|---|---|---|---|
| Conagra Brands, Inc. | 22 | 16 | 18.6 |
| Campbell Soup Company | 38 | 26 | 30.88 |
The consensus target prices imply a moderate increase for both stocks, with Conagra slightly above its current price of 16.68 USD and Campbell Soup showing more upside potential from its 26.39 USD level.
Analyst Opinions Comparison
This section compares analysts’ ratings and grades for Conagra Brands, Inc. (CAG) and Campbell Soup Company (CPB):
Rating Comparison
CAG Rating
- Rating: B-, considered Very Favorable.
- Discounted Cash Flow Score: 5, Very Favorable, showing strong valuation.
- ROE Score: 1, Very Unfavorable, low profit generation from equity.
- ROA Score: 1, Very Unfavorable, poor asset utilization.
- Debt To Equity Score: 2, Moderate financial risk.
- Overall Score: 2, Moderate overall financial standing.
CPB Rating
- Rating: B-, considered Very Favorable.
- Discounted Cash Flow Score: 5, Very Favorable, indicating solid valuation.
- ROE Score: 3, Moderate, indicating better profit efficiency from equity.
- ROA Score: 2, Moderate, showing more effective asset use.
- Debt To Equity Score: 1, Very Unfavorable, higher financial risk.
- Overall Score: 3, Moderate but higher overall standing than CAG.
Which one is the best rated?
Based strictly on the provided data, CPB holds a higher overall score and better ROE and ROA scores than CAG, despite a less favorable debt-to-equity score. Both share the same analyst rating of B-.
Scores Comparison
Here is a comparison of the Altman Z-Score and Piotroski Score for Conagra Brands (CAG) and Campbell Soup Company (CPB):
CAG Scores
- Altman Z-Score: 1.48, indicating financial distress zone.
- Piotroski Score: 3, categorized as very weak financial health.
CPB Scores
- Altman Z-Score: 1.73, indicating financial distress zone.
- Piotroski Score: 5, categorized as average financial health.
Which company has the best scores?
Based on the scores provided, CPB shows a slightly higher Altman Z-Score and a better Piotroski Score compared to CAG. CPB’s scores indicate a less severe financial distress and stronger financial health than CAG’s.
Grades Comparison
Here is a summary of the latest grades assigned to Conagra Brands, Inc. and Campbell Soup Company by recognized grading firms:
Conagra Brands, Inc. Grades
The table below shows recent grades from established grading companies for Conagra Brands, Inc.:
| Grading Company | Action | New Grade | Date |
|---|---|---|---|
| Wells Fargo | Maintain | Equal Weight | 2026-01-05 |
| UBS | Maintain | Neutral | 2025-12-23 |
| Morgan Stanley | Maintain | Equal Weight | 2025-12-22 |
| Deutsche Bank | Maintain | Hold | 2025-12-22 |
| RBC Capital | Maintain | Sector Perform | 2025-12-22 |
| Evercore ISI Group | Maintain | In Line | 2025-12-22 |
| TD Cowen | Maintain | Hold | 2025-12-22 |
| B of A Securities | Maintain | Underperform | 2025-12-22 |
| JP Morgan | Maintain | Neutral | 2025-12-16 |
| Wells Fargo | Maintain | Equal Weight | 2025-12-12 |
The grades for Conagra Brands mostly range from Hold to Equal Weight, indicating a broadly neutral consensus with some cautious views.
Campbell Soup Company Grades
The table below shows recent grades from established grading companies for Campbell Soup Company:
| Grading Company | Action | New Grade | Date |
|---|---|---|---|
| DA Davidson | Maintain | Neutral | 2025-12-11 |
| RBC Capital | Maintain | Sector Perform | 2025-12-10 |
| Wells Fargo | Maintain | Equal Weight | 2025-12-10 |
| Stifel | Maintain | Hold | 2025-12-10 |
| UBS | Maintain | Sell | 2025-12-10 |
| Bernstein | Maintain | Outperform | 2025-12-10 |
| Stephens & Co. | Maintain | Overweight | 2025-12-08 |
| Morgan Stanley | Maintain | Equal Weight | 2025-12-05 |
| UBS | Maintain | Sell | 2025-12-04 |
| Wells Fargo | Maintain | Equal Weight | 2025-09-25 |
Campbell Soup Company’s grades show more dispersion, from Sell to Outperform, reflecting a mixed but slightly more varied analyst opinion.
Which company has the best grades?
Both companies have a consensus rating of Hold, but Campbell Soup Company exhibits a wider range of grades including Outperform and Overweight, suggesting some analysts see higher potential upside. Conagra’s grades cluster more closely around Hold and Equal Weight, indicating more consistent but neutral sentiment. These differences may affect investor perceptions of risk and reward.
Strengths and Weaknesses
Below is a comparison of Conagra Brands, Inc. (CAG) and Campbell Soup Company (CPB) based on key criteria relevant to investors.
| Criterion | Conagra Brands, Inc. (CAG) | Campbell Soup Company (CPB) |
|---|---|---|
| Diversification | Broad product mix with Grocery & Snacks (4.9B), Refrigerated & Frozen (4.7B), Foodservice (1.1B), and International (0.96B) | Concentrated in Baked Snacks (4.4B), Soups (2.8B), and Beverages (3.0B) |
| Profitability | Neutral net margin (9.9%), ROIC 7.36%, stable but declining profitability | Neutral net margin (5.9%), ROIC 7.96%, higher ROE (15.4%) but declining trend |
| Innovation | Moderate innovation with steady product segments growth, but ROIC trend declining by -6.6% | Innovation reflected in product line expansion but ROIC trend declining more sharply by -16.7% |
| Global presence | Limited international revenue (~1B), mostly US-focused | Primarily North American market focus, less international exposure |
| Market Share | Strong presence in frozen and refrigerated foods segments; diversified channels | Leading in baked snacks and soups with steady revenue but less diverse |
Key takeaways: Both companies are creating value with ROIC above WACC but face declining profitability trends. Conagra offers greater product diversification and strong frozen food presence, while Campbell shows higher profitability metrics but with a sharper decline. Investors should weigh diversification versus margin strength when choosing.
Risk Analysis
Below is a risk comparison table for Conagra Brands, Inc. (CAG) and Campbell Soup Company (CPB) based on the most recent 2025 data:
| Metric | Conagra Brands, Inc. (CAG) | Campbell Soup Company (CPB) |
|---|---|---|
| Market Risk | Low beta (-0.014), stable price range but sensitive to consumer trends | Low beta (-0.043), moderate price volatility with some exposure to commodity costs |
| Debt level | Moderate debt-to-equity (0.93), neutral rating | Higher debt-to-equity (1.85), unfavorable rating indicating higher leverage risk |
| Regulatory Risk | Moderate, typical for packaged foods industry | Moderate, exposure to food safety and labeling regulations |
| Operational Risk | Slightly unfavorable liquidity ratios (current 0.71, quick 0.24) | Similar liquidity challenges (current 0.77, quick 0.28), moderate operational efficiency |
| Environmental Risk | Moderate, with increasing consumer focus on sustainability | Moderate, ongoing pressure to improve supply chain environmental impact |
| Geopolitical Risk | Low, mostly North American operations | Low to moderate, with some international exposure in Latin America |
Conagra’s key risks center on liquidity constraints and moderate leverage, while Campbell faces higher financial risk due to elevated debt levels. Both operate in regulated food sectors with increasing environmental scrutiny, but neither shows significant geopolitical vulnerability. Investors should monitor debt management and liquidity improvements closely.
Which Stock to Choose?
Conagra Brands, Inc. (CAG) shows a favorable income statement with strong EBIT and net margins despite a one-year revenue decline of -3.64%. Its financial ratios are slightly favorable, with a stable debt level and a favorable price-to-earnings ratio, though liquidity ratios are weak. The company’s rating is very favorable overall but with some unfavorable scores on profitability metrics.
Campbell Soup Company (CPB) also presents a favorable income statement with stable gross and EBIT margins and moderate revenue growth of 6.4% in the last year. Its financial ratios are slightly favorable, supported by a stronger return on equity and a solid dividend yield, but it faces higher debt-to-equity concerns. CPB’s rating is very favorable, with moderate scores in return and valuation metrics.
For investors, the choice might depend on risk tolerance and investment goals: those focused on consistent profitability and valuation might find Conagra’s metrics slightly more attractive, while investors valuing higher returns on equity and dividend income could view Campbell Soup as favorable. Both companies create value above their cost of capital but face declining profitability trends.
Disclaimer: Investment carries a risk of loss of initial capital. The past performance is not a reliable indicator of future results. Be sure to understand risks before making an investment decision.
Go Further
I encourage you to read the complete analyses of Conagra Brands, Inc. and Campbell Soup Company to enhance your investment decisions: