In the evolving uranium sector, Cameco Corporation (CCJ) and Uranium Royalty Corp. (UROY) stand out as key players with distinct approaches. Cameco leads with integrated uranium production and fuel services, while Uranium Royalty focuses on royalty interests in diverse uranium projects. Both companies operate within the same industry and share a Canadian base, sparking a compelling comparison. This article will help you identify which company offers the most promising investment opportunity.
Table of contents
Companies Overview
I will begin the comparison between Cameco Corporation and Uranium Royalty Corp. by providing an overview of these two companies and their main differences.
Cameco Corporation Overview
Cameco Corporation is a leading uranium producer engaged in exploration, mining, milling, and the sale of uranium concentrate. It operates two segments: Uranium and Fuel Services, which include refining, conversion, and fuel bundle production for CANDU reactors. Headquartered in Saskatoon, Canada, Cameco serves nuclear utilities across the Americas, Europe, and Asia, positioning itself as a vertically integrated player in the uranium energy sector.
Uranium Royalty Corp. Overview
Uranium Royalty Corp. is a pure-play uranium royalty company that acquires and manages a diversified portfolio of uranium interests across North America and Namibia. Founded in 2017 and based in Vancouver, Canada, it focuses on royalty income from various uranium projects rather than direct mining or production. This business model allows the company to gain uranium exposure with limited operational risk and a smaller workforce.
Key similarities and differences
Both companies operate within the uranium energy sector and are headquartered in Canada, but their business models differ significantly. Cameco is a full-scale producer involved in uranium mining, refining, and fuel fabrication, with a larger workforce and more direct operational involvement. In contrast, Uranium Royalty Corp. acts as a royalty holder, focusing on acquiring and managing uranium interests to generate royalties, which entails lower operational risk and overhead.
Income Statement Comparison
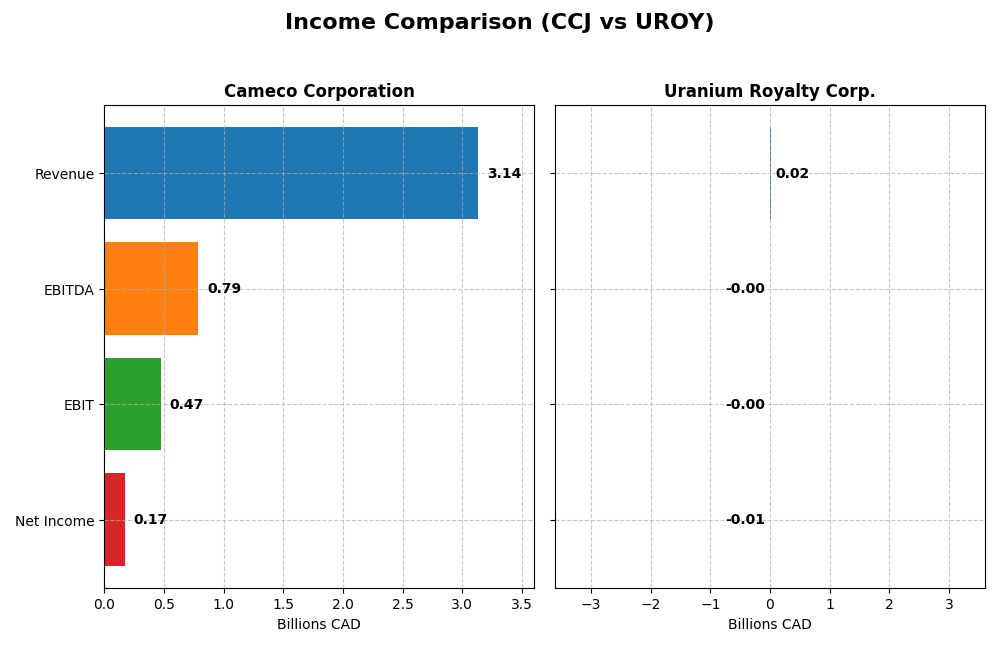
This table presents a side-by-side comparison of the most recent fiscal year income statement metrics for Cameco Corporation and Uranium Royalty Corp., highlighting their financial performance.
| Metric | Cameco Corporation | Uranium Royalty Corp. |
|---|---|---|
| Market Cap | 46.8B CAD | 535M CAD |
| Revenue | 3.14B CAD | 15.6M CAD |
| EBITDA | 789M CAD | -4.75M CAD |
| EBIT | 475M CAD | -4.87M CAD |
| Net Income | 172M CAD | -5.65M CAD |
| EPS | 0.40 CAD | -0.045 CAD |
| Fiscal Year | 2024 | 2025 |
Income Statement Interpretations
Cameco Corporation
Cameco’s revenue grew steadily from CAD 1.47B in 2021 to CAD 3.14B in 2024, with net income rebounding from a loss of CAD -102.6M in 2021 to a positive CAD 171.9M in 2024. Margins improved markedly overall, with a gross margin of 33.91% and net margin of 5.48% by 2024. However, the latest year showed a slowdown in EBIT and net margin growth, signaling some pressure on profitability despite robust revenue gains.
Uranium Royalty Corp.
Uranium Royalty’s revenue peaked at CAD 42.7M in 2024 but declined sharply to CAD 15.6M in 2025. Net income followed a similar pattern, turning positive to CAD 9.78M in 2024 before dropping to a negative CAD -5.65M in 2025. The company’s gross margin remained low and neutral at 9.98%, with EBIT and net margins deeply negative in 2025, reflecting deteriorated profitability and operational challenges in the latest period.
Which one has the stronger fundamentals?
Cameco Corporation demonstrates stronger fundamentals with favorable trends in revenue growth, improving margins, and a positive net income trajectory over the medium term despite some recent margin compression. In contrast, Uranium Royalty exhibits unfavorable profitability metrics, marked by declining revenues, negative margins, and net losses in the latest fiscal year. Overall, Cameco presents a more robust income statement profile.
Financial Ratios Comparison
The table below compares key financial ratios for Cameco Corporation (CCJ) and Uranium Royalty Corp. (UROY) based on their most recent fiscal year data, providing a snapshot of operational efficiency, profitability, liquidity, and leverage.
| Ratios | Cameco Corporation (CCJ) | Uranium Royalty Corp. (UROY) |
|---|---|---|
| ROE | 2.70% | -1.92% |
| ROIC | 3.79% | -1.63% |
| P/E | 187.0 | -56.0 |
| P/B | 5.05 | 1.07 |
| Current Ratio | 1.62 | 233.49 |
| Quick Ratio | 0.80 | 233.49 |
| D/E (Debt-to-Equity) | 0.20 | 0.0007 |
| Debt-to-Assets | 13.1% | 0.07% |
| Interest Coverage | 4.60 | -11.02 |
| Asset Turnover | 0.32 | 0.05 |
| Fixed Asset Turnover | 0.95 | 82.51 |
| Payout ratio | 40.5% | 0% |
| Dividend yield | 0.22% | 0% |
Interpretation of the Ratios
Cameco Corporation
Cameco shows mixed ratio strength with favorable liquidity and low leverage but unfavorable profitability indicators such as ROE at 2.7% and ROIC at 3.79%, both below ideal levels. Its high P/E and P/B ratios raise valuation concerns. The company pays a modest dividend yielding 0.22%, with potential risks from a low payout ratio and limited coverage from free cash flow.
Uranium Royalty Corp.
Uranium Royalty’s ratios are generally weak, with negative margins and returns on equity and invested capital, reflecting operational challenges. However, it benefits from low debt levels and a strong quick ratio, despite an unfavorable current ratio due to working capital structure. The company does not pay dividends, likely reinvesting earnings to support growth and portfolio management.
Which one has the best ratios?
Cameco presents a slightly unfavorable overall ratio profile with stronger liquidity and dividend presence, while Uranium Royalty’s ratios are more unfavorable due to negative profitability and cash flow metrics despite some favorable leverage ratios. Neither company exhibits a fully robust ratio set, with each showing specific strengths and weaknesses.
Strategic Positioning
This section compares the strategic positioning of Cameco Corporation and Uranium Royalty Corp., including Market position, Key segments, and exposure to disruption:
Cameco Corporation
- Large market cap of 46.8B with exposure to global nuclear utilities markets, facing competitive pressures in uranium mining and fuel services.
- Two segments: Uranium mining and fuel services with sales in Americas, Europe, and Asia, driving business through production and refining.
- Exposure to technological disruption is moderate, focused on traditional uranium mining and fuel fabrication with potential sector shifts.
Uranium Royalty Corp.
- Smaller market cap of 535M, focused on uranium royalties across geographically diversified projects, facing competitive pressures in royalty management.
- Pure-play uranium royalty company with diverse royalty interests in multiple uranium projects across North America and Namibia.
- Limited exposure to technological disruption as a royalty company, less reliant on operational innovations in uranium extraction or processing.
Cameco Corporation vs Uranium Royalty Corp. Positioning
Cameco’s diversified operations across mining and fuel services contrast with Uranium Royalty’s concentrated focus on royalty holdings. Cameco benefits from vertical integration but faces operational risks; Uranium Royalty’s model reduces operational risk but depends on project royalties.
Which has the best competitive advantage?
Neither company demonstrates a strong economic moat; Cameco shows slightly unfavorable moat with growing profitability, while Uranium Royalty has a very unfavorable moat with declining profitability, indicating higher risk in sustaining competitive advantage.
Stock Comparison
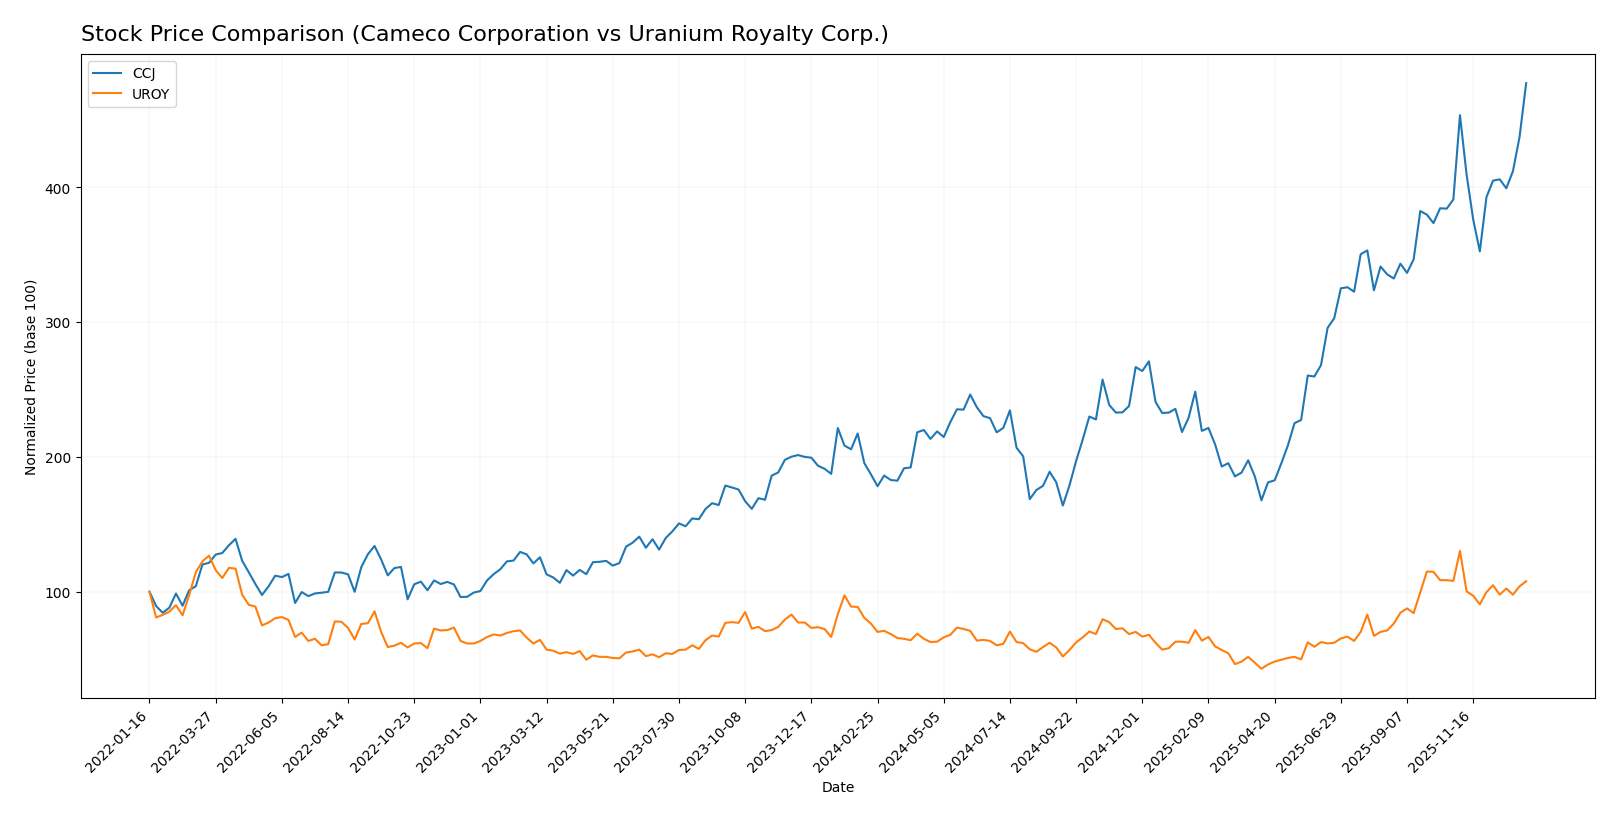
The stock price movements over the past 12 months reveal significant bullish momentum for Cameco Corporation, while Uranium Royalty Corp. experienced moderate gains with recent stabilization in trading activity.
Trend Analysis
Cameco Corporation’s stock showed a strong bullish trend over the past year, with a 155.0% price increase and accelerating momentum. The price ranged from a low of 36.96 to a high of 107.56, with notable volatility (std deviation 17.73).
Uranium Royalty Corp. also exhibited a bullish trend over the year, rising 41.05%. However, the trend shows deceleration and lower volatility (std deviation 0.67), with a price range between 1.6 and 4.86. Recent trading indicates a slight negative trend (-0.25%).
Comparing the two, Cameco Corporation delivered a substantially higher market performance and stronger bullish momentum than Uranium Royalty Corp. over the past 12 months.
Target Prices
The target price consensus for Cameco Corporation reveals moderate upside potential.
| Company | Target High | Target Low | Consensus |
|---|---|---|---|
| Cameco Corporation | 109 | 99.74 | 102.75 |
Analysts expect Cameco’s price to trade slightly above the current level of 107.56 USD, suggesting a cautiously optimistic outlook. No verified target price data is available from recognized analysts for Uranium Royalty Corp.
Analyst Opinions Comparison
This section compares analysts’ ratings and grades for Cameco Corporation and Uranium Royalty Corp.:
Rating Comparison
CCJ Rating
- Rating: B, assessed as Very Favorable overall.
- Discounted Cash Flow Score: 3, considered Moderate valuation.
- ROE Score: 4, showing Favorable performance in generating shareholder profit.
- ROA Score: 4, indicating Favorable asset utilization.
- Debt To Equity Score: 3, Moderate financial risk level.
- Overall Score: 3, Moderate overall financial standing.
UROY Rating
- Rating: C-, also marked Very Favorable overall.
- Discounted Cash Flow Score: 1, indicating Very Unfavorable valuation.
- ROE Score: 1, rated Very Unfavorable for profit generation efficiency.
- ROA Score: 1, considered Very Unfavorable in asset usage.
- Debt To Equity Score: 4, Favorable, indicating lower financial risk.
- Overall Score: 1, Very Unfavorable overall financial standing.
Which one is the best rated?
Based on the provided data, Cameco Corporation is better rated overall, with higher scores in discounted cash flow, ROE, ROA, and overall financial standing. Uranium Royalty Corp. scores better only in debt to equity, indicating lower financial risk.
Scores Comparison
Here is a comparison of the Altman Z-Score and Piotroski Score for the two companies:
CCJ Scores
- Altman Z-Score: 10.76, indicating a safe financial zone with low bankruptcy risk.
- Piotroski Score: 8, classified as very strong, showing sound financial health.
UROY Scores
- Altman Z-Score: 388.37, indicating a safe financial zone with very low bankruptcy risk.
- Piotroski Score: 3, considered very weak, indicating weaker financial strength.
Which company has the best scores?
Based strictly on the data, UROY has a much higher Altman Z-Score suggesting an extremely low bankruptcy risk, while CCJ has a far stronger Piotroski Score indicating better overall financial health. The scores reflect different strengths for each company.
Grades Comparison
Here is a detailed comparison of recent grades from reputable grading companies for the two companies:
Cameco Corporation Grades
The following table summarizes recent grades assigned to Cameco Corporation by major financial institutions.
| Grading Company | Action | New Grade | Date |
|---|---|---|---|
| RBC Capital | Maintain | Outperform | 2025-11-13 |
| RBC Capital | Maintain | Outperform | 2025-10-31 |
| Goldman Sachs | Maintain | Buy | 2025-10-29 |
| RBC Capital | Maintain | Outperform | 2025-08-01 |
| RBC Capital | Maintain | Outperform | 2025-06-20 |
| GLJ Research | Maintain | Buy | 2025-06-12 |
| Goldman Sachs | Maintain | Buy | 2025-06-11 |
| GLJ Research | Maintain | Buy | 2025-03-12 |
| RBC Capital | Maintain | Outperform | 2025-03-04 |
| Scotiabank | Maintain | Outperform | 2024-08-19 |
Cameco Corporation’s grades consistently show a strong positive outlook with multiple “Outperform” and “Buy” ratings maintained over the past two years.
Uranium Royalty Corp. Grades
The following table shows Uranium Royalty Corp.’s recent grades from a single grading company.
| Grading Company | Action | New Grade | Date |
|---|---|---|---|
| HC Wainwright & Co. | Maintain | Buy | 2025-04-22 |
| HC Wainwright & Co. | Maintain | Buy | 2024-12-19 |
| HC Wainwright & Co. | Maintain | Buy | 2024-09-17 |
| HC Wainwright & Co. | Maintain | Buy | 2024-06-17 |
| HC Wainwright & Co. | Maintain | Buy | 2024-03-11 |
| HC Wainwright & Co. | Maintain | Buy | 2022-01-03 |
| HC Wainwright & Co. | Maintain | Buy | 2021-09-29 |
| HC Wainwright & Co. | Maintain | Buy | 2021-09-28 |
| HC Wainwright & Co. | Maintain | Buy | 2021-07-02 |
| HC Wainwright & Co. | Maintain | Buy | 2021-07-01 |
Uranium Royalty Corp. has consistently received “Buy” ratings from HC Wainwright & Co. for several years, reflecting stable positive sentiment.
Which company has the best grades?
Cameco Corporation has received a broader range of grades from multiple reputable firms, mostly “Outperform” and “Buy,” indicating a stronger consensus of above-average performance. Uranium Royalty Corp. shows consistent “Buy” ratings but only from one source, which suggests a narrower analyst coverage. Investors may perceive Cameco’s more diverse analyst support as a sign of broader market confidence.
Strengths and Weaknesses
Below is a summary table highlighting the key strengths and weaknesses of Cameco Corporation (CCJ) and Uranium Royalty Corp. (UROY) based on their recent financial and operational performance.
| Criterion | Cameco Corporation (CCJ) | Uranium Royalty Corp. (UROY) |
|---|---|---|
| Diversification | Moderate product focus; limited segments | Highly focused on uranium royalties; narrow diversification |
| Profitability | Slightly unfavorable; positive net margin (5.48%) but low ROE (2.7%) and ROIC (3.79%) | Unfavorable; negative net margin (-36.26%), negative ROE (-1.92%), and ROIC (-1.63%) |
| Innovation | Moderate; improving ROIC trend (+450%) but still value destructive | Low; declining ROIC trend (-12.6%), value destructive |
| Global presence | Established global uranium producer with solid market presence | Smaller, royalty-based company with limited operational footprint |
| Market Share | Significant player in uranium mining with stable market share | Niche player in uranium royalties, smaller market share |
Key takeaways: Cameco shows improving profitability trends but still faces challenges in value creation and efficiency. Uranium Royalty Corp. struggles with profitability and declining returns, reflecting higher investment risk. Both require careful consideration of growth prospects and risk tolerance.
Risk Analysis
Below is a comparison of key risks for Cameco Corporation (CCJ) and Uranium Royalty Corp. (UROY) based on the most recent data from 2025-2026.
| Metric | Cameco Corporation (CCJ) | Uranium Royalty Corp. (UROY) |
|---|---|---|
| Market Risk | Moderate (Beta 1.22) | High (Beta 2.03) |
| Debt Level | Low (Debt/Equity 0.2) | Very Low (Debt/Equity 0.0) |
| Regulatory Risk | Moderate (Energy sector) | Moderate (Energy sector) |
| Operational Risk | Moderate (Mining & Fuel Services) | Low (Royalty-based model) |
| Environmental Risk | Moderate (Mining impact) | Low (No direct operations) |
| Geopolitical Risk | Moderate (Global uranium markets) | Moderate (Diversified royalties) |
Cameco faces moderate market and regulatory risks with manageable debt but shows slightly unfavorable profitability metrics, while Uranium Royalty Corp. carries higher market volatility and unfavorable earnings but benefits from minimal debt and lower operational risk. The most impactful risks are UROY’s high market risk and poor profitability, and CCJ’s exposure to mining operational challenges and regulatory environment.
Which Stock to Choose?
Cameco Corporation (CCJ) shows a favorable income evolution with 21.18% revenue growth in 2024 and strong long-term net income gains. Its financial ratios are slightly unfavorable overall, with solid liquidity and low debt. Profitability is modest, with ROE at 2.7%, and it carries a moderate debt load. The company’s rating is very favorable (B), supported by strong Altman Z-Score and Piotroski Score, though valuation metrics appear stretched.
Uranium Royalty Corp. (UROY) presents an unfavorable income evolution, marked by a steep revenue decline of 63.48% in 2025 and negative profitability ratios. Its financial ratios are globally unfavorable, despite very low leverage and a very high current ratio. The company’s rating is very favorable (C-), mainly reflecting low debt, but its Altman Z-Score is strong while Piotroski Score is weak, indicating financial instability in profitability and efficiency.
For investors, CCJ could appear more favorable given its positive income growth and improving profitability despite some valuation concerns, which might appeal to those seeking quality and growth. Conversely, UROY’s financial challenges and declining profitability may signal higher risk, potentially suiting risk-tolerant investors looking for speculative opportunities with low leverage. The choice could depend on an investor’s risk appetite and investment strategy.
Disclaimer: Investment carries a risk of loss of initial capital. The past performance is not a reliable indicator of future results. Be sure to understand risks before making an investment decision.
Go Further
I encourage you to read the complete analyses of Cameco Corporation and Uranium Royalty Corp. to enhance your investment decisions: