In the evolving energy sector, Cameco Corporation (CCJ) and Uranium Energy Corp. (UEC) stand out as key players in uranium production and innovation. Both companies operate in overlapping markets, supplying uranium to meet global nuclear energy demands while pursuing distinct strategies in exploration and fuel services. This article will analyze their strengths and risks to help you decide which uranium stock could be the most promising addition to your investment portfolio.
Table of contents
Companies Overview
I will begin the comparison between Cameco Corporation and Uranium Energy Corp. by providing an overview of these two companies and their main differences.
Cameco Overview
Cameco Corporation operates in the uranium industry with a focus on producing and selling uranium and fuel services. Its operations span exploration, mining, milling, refining, conversion, and fabrication of uranium concentrate. Headquartered in Saskatoon, Canada, Cameco serves nuclear utilities across the Americas, Europe, and Asia, positioning itself as a significant player with a market cap of $46.8B and 730 employees.
Uranium Energy Overview
Uranium Energy Corp. engages in the exploration, extraction, and processing of uranium and titanium concentrates primarily in the United States, Canada, and Paraguay. Based in Corpus Christi, Texas, the company holds interests in multiple projects across North and South America. Smaller in scale, UEC has a market cap of $7.1B and employs 94 people, focusing on resource development within the energy sector.
Key similarities and differences
Both companies operate in the uranium sector within the energy industry and provide raw materials essential for nuclear power generation. Cameco’s business model includes a broader value chain presence, covering fuel fabrication and international sales, while Uranium Energy concentrates on exploration and extraction with a regional project focus. Cameco’s larger scale and diversified operations contrast with UEC’s smaller, resource-focused approach in primarily North American markets.
Income Statement Comparison
The table below presents a factual comparison of key income statement metrics for Cameco Corporation and Uranium Energy Corp. for their most recent fiscal years.
| Metric | Cameco Corporation (CCJ) | Uranium Energy Corp. (UEC) |
|---|---|---|
| Market Cap | 46.8B CAD | 7.1B USD |
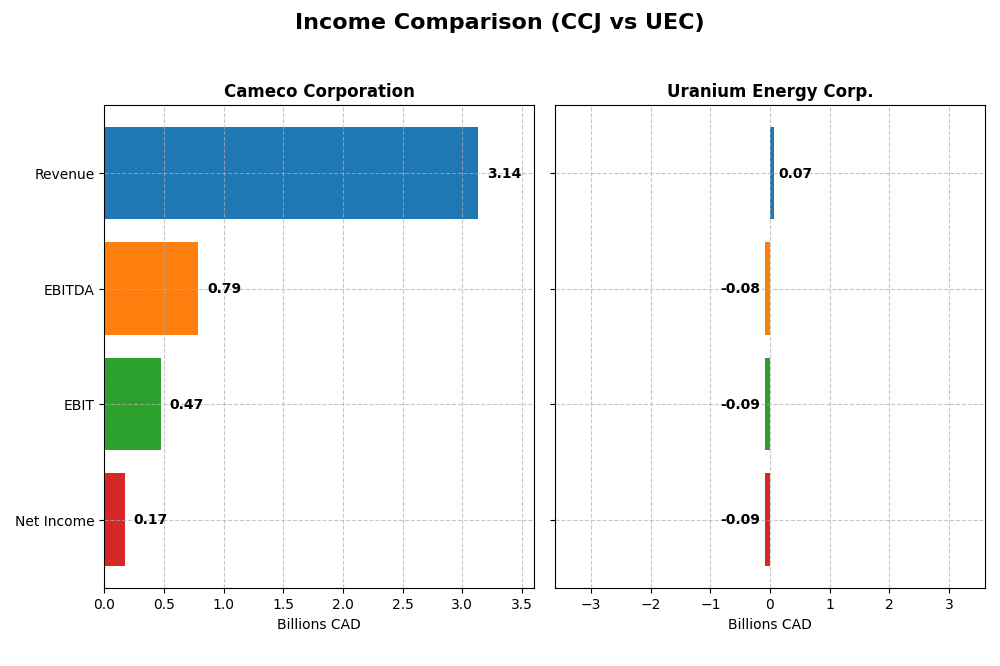
| Revenue | 3.14B CAD (2024) | 66.8M USD (2025) |
| EBITDA | 789M CAD (2024) | -84.5M USD (2025) |
| EBIT | 475M CAD (2024) | -89.0M USD (2025) |
| Net Income | 172M CAD (2024) | -87.7M USD (2025) |
| EPS | 0.40 CAD (2024) | -0.20 USD (2025) |
| Fiscal Year | 2024 | 2025 |
Income Statement Interpretations
Cameco Corporation
Cameco’s revenue increased significantly from 1.47B CAD in 2021 to 3.14B CAD in 2024, demonstrating strong growth. Net income fluctuated, peaking at 361M CAD in 2023 before dropping to 172M CAD in 2024. Margins improved overall, with a favorable gross margin of 33.91% and net margin of 5.48% in 2024, despite a recent decline in EBIT and net margin growth.
Uranium Energy Corp.
Uranium Energy’s revenue rose sharply from zero in 2021 to 66.8M USD in 2025, with net income remaining negative through the period, reaching -87.7M USD in 2025. While gross margin was favorable at 36.62%, EBIT and net margins were deeply negative, reflecting operational challenges. Recent revenue growth was exceptional, yet profitability metrics show continued losses and margin deterioration.
Which one has the stronger fundamentals?
Cameco Corporation exhibits stronger fundamentals with consistent revenue growth, positive net income, and stable, favorable margins over the period. Uranium Energy Corp. shows impressive revenue growth but sustained net losses and unfavorable EBIT and net margin trends. Overall, Cameco’s income statement presents a more favorable and stable financial profile compared to Uranium Energy.
Financial Ratios Comparison
Below is a comparison of key financial ratios for Cameco Corporation (CCJ) and Uranium Energy Corp. (UEC) based on their most recent fiscal year data.
| Ratios | Cameco Corporation (CCJ) 2024 | Uranium Energy Corp. (UEC) 2025 |
|---|---|---|
| ROE | 2.7% | -8.9% |
| ROIC | 3.8% | -6.6% |
| P/E | 187.0 | -42.3 |
| P/B | 5.05 | 3.77 |
| Current Ratio | 1.62 | 8.85 |
| Quick Ratio | 0.80 | 5.85 |
| D/E | 0.20 | 0.0023 |
| Debt-to-Assets | 13.1% | 0.21% |
| Interest Coverage | 4.60 | -50.7 |
| Asset Turnover | 0.32 | 0.060 |
| Fixed Asset Turnover | 0.95 | 0.086 |
| Payout ratio | 40.5% | 0% |
| Dividend yield | 0.22% | 0% |
Interpretation of the Ratios
Cameco Corporation
Cameco’s ratios reveal a slightly unfavorable profile with only 21.43% favorable metrics, including a strong current ratio (1.62) and low debt-to-equity (0.2). However, unfavorable indicators include a high P/E ratio (187.01) and weak returns on equity (2.7%) and invested capital (3.79%). The company pays dividends, but the yield is low at 0.22%, indicating modest shareholder returns with potential concerns about payout sustainability.
Uranium Energy Corp.
Uranium Energy shows an unfavorable ratio set, with 64.29% of metrics negative, such as a deeply negative net margin (-131.15%) and return on equity (-8.91%). The company maintains a strong quick ratio (5.85) and zero debt-to-equity, reflecting low leverage. It does not pay dividends, likely due to ongoing losses and reinvestment priorities typical of its growth phase, with no share buyback programs reported.
Which one has the best ratios?
Comparing both, Cameco Corporation holds a more balanced ratio profile with a modest dividend and stronger operational metrics despite some weaknesses. Uranium Energy’s ratios are largely unfavorable, with significant losses and no dividend payments, reflecting higher risk. Overall, Cameco demonstrates relatively better financial stability and shareholder returns based on the evaluated ratios.
Strategic Positioning
This section compares the strategic positioning of Cameco Corporation and Uranium Energy Corp., including market position, key segments, and exposure to technological disruption:
Cameco Corporation
- Leading uranium producer with significant market cap and competitive pressure from global utilities.
- Operates two segments: Uranium mining and Fuel Services supplying nuclear utilities globally.
- Limited explicit exposure to technological disruption mentioned, focused on traditional uranium fuel cycle.
Uranium Energy Corp.
- Smaller market cap with competitive pressure focused on US and regional uranium projects.
- Engages in uranium and titanium exploration, extraction, and processing across multiple US and international sites.
- No direct mention of technological disruption exposure; emphasis on diversified geographic mining projects.
Cameco Corporation vs Uranium Energy Corp. Positioning
Cameco shows a diversified business model with uranium and fuel services globally, while Uranium Energy concentrates on exploration and mining across several regions. Cameco’s scale offers broad market access; Uranium Energy has a more project-focused approach.
Which has the best competitive advantage?
Both companies are shedding value with slightly unfavorable MOATs, though each shows growing ROIC trends. Neither currently demonstrates a strong economic moat based on ROIC versus WACC analysis.
Stock Comparison
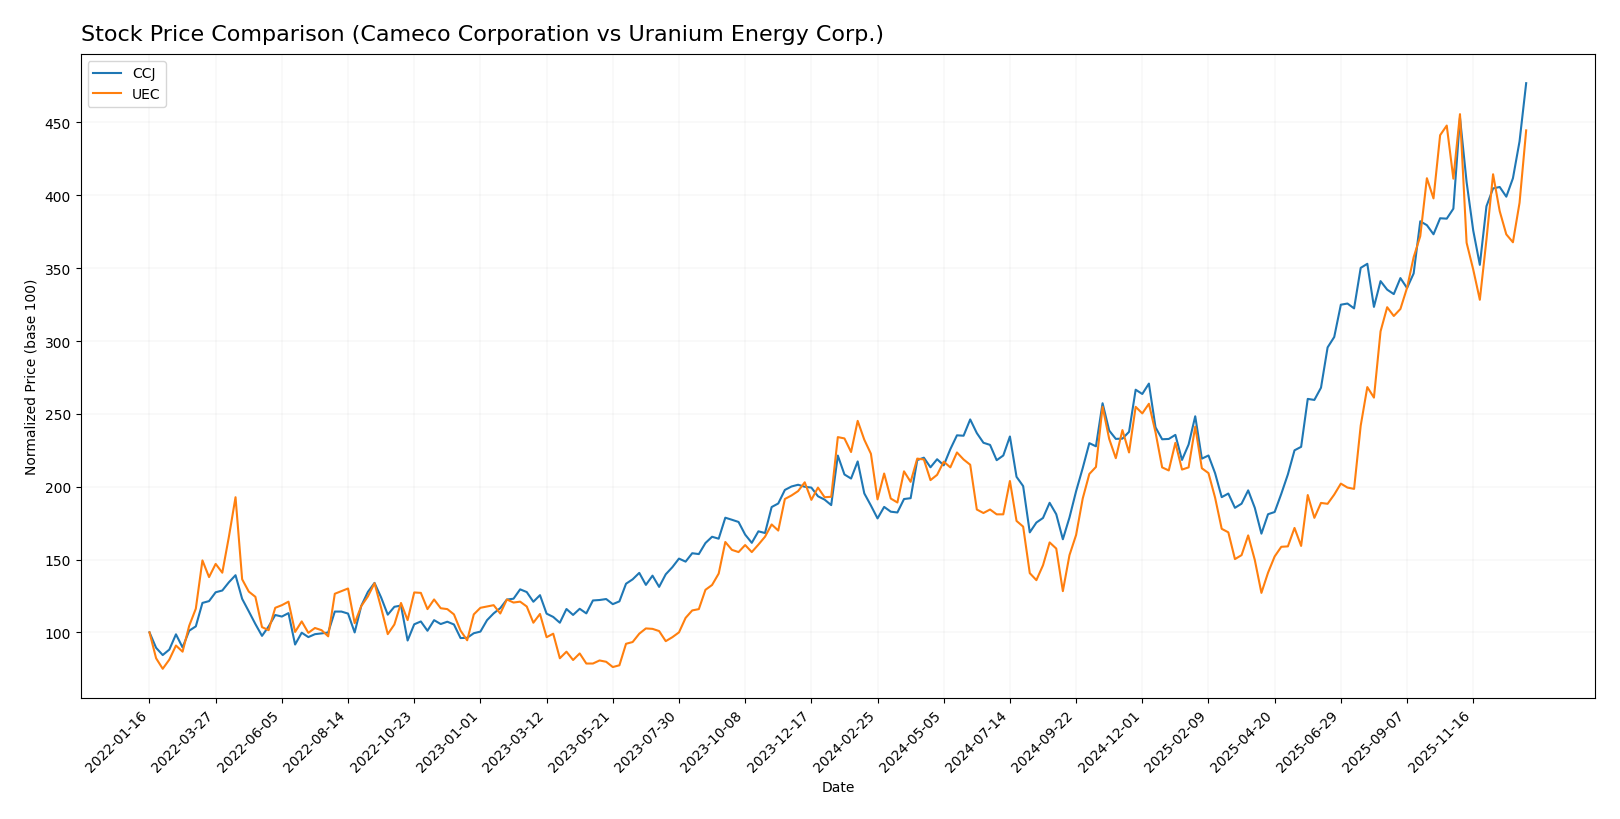
The stock price chart highlights significant bullish trends for both Cameco Corporation and Uranium Energy Corp. over the past year, with Cameco showing stronger acceleration and higher volatility, while Uranium Energy experiences deceleration amid shifting trading volumes.
Trend Analysis
Cameco Corporation (CCJ) exhibited a robust bullish trend over the past 12 months with a 155.0% price increase, marked by acceleration and notable volatility (std deviation 17.73), peaking at 107.56 and bottoming at 36.96.
Uranium Energy Corp. (UEC) also showed a bullish trend with a 99.73% gain over the same period but with deceleration and lower volatility (std deviation 2.82), reaching a high of 15.13 and a low of 4.22.
Comparatively, Cameco Corporation delivered the highest market performance, outperforming Uranium Energy with a larger price increase and stronger recent upward momentum.
Target Prices
The current analyst consensus presents a moderately bullish outlook for both Cameco Corporation and Uranium Energy Corp.
| Company | Target High | Target Low | Consensus |
|---|---|---|---|
| Cameco Corporation | 109 | 99.74 | 102.75 |
| Uranium Energy Corp. | 19.75 | 14 | 17.08 |
Analysts expect Cameco’s price to hover near its current level of 107.56 USD, while Uranium Energy’s consensus target of 17.08 USD suggests upside potential from its current 14.76 USD price.
Analyst Opinions Comparison
This section compares analysts’ ratings and grades for Cameco Corporation and Uranium Energy Corp.:
Rating Comparison
CCJ Rating
- Rating: B, considered Very Favorable
- Discounted Cash Flow Score: 3, Moderate level
- ROE Score: 4, Favorable performance
- ROA Score: 4, Favorable performance
- Debt To Equity Score: 3, Moderate financial risk
- Overall Score: 3, Moderate assessment
UEC Rating
- Rating: D+, considered Very Unfavorable
- Discounted Cash Flow Score: 1, Very Unfavorable
- ROE Score: 1, Very Unfavorable
- ROA Score: 1, Very Unfavorable
- Debt To Equity Score: 1, Very Unfavorable
- Overall Score: 1, Very Unfavorable
Which one is the best rated?
Based on the provided data, Cameco Corporation (CCJ) holds stronger ratings and higher financial scores compared to Uranium Energy Corp (UEC), indicating it is better rated overall.
Scores Comparison
Here is a comparison of the Altman Z-Score and Piotroski Score for Cameco Corporation and Uranium Energy Corp.:
CCJ Scores
- Altman Z-Score: 10.76, indicating a safe financial zone with low bankruptcy risk.
- Piotroski Score: 8, reflecting very strong financial health and investment potential.
UEC Scores
- Altman Z-Score: 30.44, indicating a very safe financial zone with extremely low bankruptcy risk.
- Piotroski Score: 2, indicating very weak financial strength and poor investment potential.
Which company has the best scores?
Based on the provided data, UEC has a significantly higher Altman Z-Score than CCJ, suggesting superior bankruptcy safety. However, CCJ’s Piotroski Score is much stronger, reflecting better overall financial health compared to UEC.
Grades Comparison
The grades comparison for Cameco Corporation and Uranium Energy Corp. is as follows:
Cameco Corporation Grades
Here are the recent grades issued by notable financial institutions for Cameco Corporation:
| Grading Company | Action | New Grade | Date |
|---|---|---|---|
| RBC Capital | Maintain | Outperform | 2025-11-13 |
| RBC Capital | Maintain | Outperform | 2025-10-31 |
| Goldman Sachs | Maintain | Buy | 2025-10-29 |
| RBC Capital | Maintain | Outperform | 2025-08-01 |
| RBC Capital | Maintain | Outperform | 2025-06-20 |
| GLJ Research | Maintain | Buy | 2025-06-12 |
| Goldman Sachs | Maintain | Buy | 2025-06-11 |
| GLJ Research | Maintain | Buy | 2025-03-12 |
| RBC Capital | Maintain | Outperform | 2025-03-04 |
| Scotiabank | Maintain | Outperform | 2024-08-19 |
Cameco Corporation’s grades consistently show strong confidence, with multiple Outperform and Buy ratings maintained over the last year.
Uranium Energy Corp. Grades
Recent grades from recognized institutions for Uranium Energy Corp. are summarized below:
| Grading Company | Action | New Grade | Date |
|---|---|---|---|
| Roth Capital | Maintain | Buy | 2025-12-11 |
| Goldman Sachs | Maintain | Buy | 2025-09-26 |
| Roth Capital | Maintain | Buy | 2025-09-25 |
| HC Wainwright & Co. | Maintain | Buy | 2025-09-25 |
| BMO Capital | Downgrade | Market Perform | 2025-09-25 |
| Roth Capital | Maintain | Buy | 2025-09-03 |
| HC Wainwright & Co. | Maintain | Buy | 2025-08-06 |
| HC Wainwright & Co. | Maintain | Buy | 2025-03-13 |
| HC Wainwright & Co. | Maintain | Buy | 2024-12-09 |
| Roth MKM | Maintain | Buy | 2024-10-23 |
Uranium Energy Corp. mostly holds Buy ratings, with one recent downgrade to Market Perform indicating some cautious re-evaluation.
Which company has the best grades?
Cameco Corporation has received more consistently higher and stable grades, mainly Outperform and Buy, compared to Uranium Energy Corp., which has mostly Buy ratings but one downgrade to Market Perform. This suggests Cameco’s analyst sentiment is generally stronger, potentially reflecting greater confidence in its performance or outlook, which investors may interpret as a sign of relative stability or growth potential.
Strengths and Weaknesses
Below is a comparison table highlighting the key strengths and weaknesses of Cameco Corporation (CCJ) and Uranium Energy Corp. (UEC) based on recent financial and operational data.
| Criterion | Cameco Corporation (CCJ) | Uranium Energy Corp. (UEC) |
|---|---|---|
| Diversification | Moderate; primarily uranium mining with some geographical spread but limited product range | Limited; focused mainly on uranium with minimal diversification |
| Profitability | Neutral net margin (5.48%), but overall slightly unfavorable due to low ROIC and high PE ratio | Unfavorable profitability with a large negative net margin (-131%) and negative ROIC |
| Innovation | Moderate innovation reflected in improving ROIC trend despite current value destruction | Limited innovation; profitability improving but still shedding value |
| Global presence | Established global player with stable financial footing and moderate debt levels | Smaller scale with less global reach, but very low debt and strong liquidity ratios |
| Market Share | Significant market share in uranium mining industry | Smaller market share, growing sales primarily from inventory sales |
Key takeaways: Both companies are currently shedding value with ROIC below WACC, but they show improving profitability trends. Cameco benefits from a stronger global presence and better financial stability, while Uranium Energy has liquidity advantages but struggles with profitability and scale. Investors should weigh risk tolerance carefully.
Risk Analysis
Below is a comparative risk table for Cameco Corporation (CCJ) and Uranium Energy Corp. (UEC) based on the most recent available data.
| Metric | Cameco Corporation (CCJ) | Uranium Energy Corp. (UEC) |
|---|---|---|
| Market Risk | Beta 1.22; moderate volatility typical for energy sector | Beta 1.24; slightly higher volatility, reflecting smaller market cap and project risks |
| Debt Level | Low debt-to-equity ratio at 0.2, favorable leverage | Very low debt (0.0), favorable financial risk profile |
| Regulatory Risk | Moderate; operates internationally with nuclear regulations in Americas, Europe, Asia | High; multiple US and international projects with varying regulatory frameworks |
| Operational Risk | Established mining and fuel services, moderate operational complexity | Higher; exploration and development stage projects increase operational uncertainty |
| Environmental Risk | Moderate; uranium mining with environmental scrutiny and safety standards | Moderate to high; exploration and mining activities under strict environmental regulations |
| Geopolitical Risk | Exposure to global nuclear markets, some risk from geopolitical tensions | Concentrated in US and Latin America; regional political risks present |
Cameco (CCJ) faces moderate market and regulatory risks but benefits from low debt and solid operational footing. Uranium Energy (UEC) has very low debt but higher operational and regulatory risks due to its smaller scale and multiple exploration projects, making it more vulnerable to market and geopolitical fluctuations. The most impactful risks for both are regulatory and operational challenges inherent in the uranium industry.
Which Stock to Choose?
Cameco Corporation (CCJ) shows a favorable income evolution with a 74.2% revenue growth over five years and a 423.22% net income increase. However, its financial ratios are slightly unfavorable, with a low ROE of 2.7% and a high P/E of 187. Its debt levels are moderate and well managed, supported by a current ratio of 1.62 and a debt-to-assets ratio of 13.08%. The company’s rating is very favorable, reflecting solid overall financial health.
Uranium Energy Corp. (UEC) exhibits a mixed performance with an unfavorable global income statement, marked by negative net margins and declining net income over the period. Its financial ratios are generally unfavorable, including negative ROE and ROIC, though it holds a favorable debt profile with zero debt-to-equity. Despite a very favorable rating, its operational efficiency and profitability remain weak, and liquidity ratios are high but may reflect operational challenges.
For investors, CCJ might appear more suitable for those prioritizing income growth and financial stability, given its improving profitability and moderate debt. Conversely, UEC could be considered by risk-tolerant investors seeking potential turnaround opportunities, despite unfavorable profitability and financial ratios. The choice depends on individual risk profiles and investment strategies.
Disclaimer: Investment carries a risk of loss of initial capital. The past performance is not a reliable indicator of future results. Be sure to understand risks before making an investment decision.
Go Further
I encourage you to read the complete analyses of Cameco Corporation and Uranium Energy Corp. to enhance your investment decisions: