In the evolving uranium sector, Cameco Corporation (CCJ) and NexGen Energy Ltd. (NXE) stand out as key players shaping the future of nuclear energy. Cameco, a well-established miner and fuel services provider, contrasts with NexGen’s exploration-driven innovation in high-grade deposits. Their shared focus on uranium and Canadian roots makes this comparison insightful. Join me as we explore which company presents the most compelling opportunity for your investment portfolio.
Table of contents
Companies Overview
I will begin the comparison between Cameco Corporation and NexGen Energy Ltd. by providing an overview of these two companies and their main differences.
Cameco Corporation Overview
Cameco Corporation is a major uranium producer operating through two segments: Uranium and Fuel Services. The Uranium segment focuses on exploration, mining, milling, and trading of uranium concentrate, while Fuel Services handles refining, conversion, and fuel bundle fabrication for CANDU reactors. Headquartered in Saskatoon, Canada, Cameco serves nuclear utilities across the Americas, Europe, and Asia, positioning itself as a leading integrated player in the uranium market.
NexGen Energy Ltd. Overview
NexGen Energy Ltd. is an exploration and development stage company specializing in uranium properties in Canada. Its main asset, the Rook I project, covers 35,065 hectares in Saskatchewan’s Athabasca Basin. Based in Vancouver, Canada, NexGen focuses on acquiring, exploring, and developing uranium claims, distinguishing itself from producers through its emphasis on resource development rather than active mining or fuel services.
Key similarities and differences
Both Cameco and NexGen operate within the uranium industry and are headquartered in Canada. Cameco is a fully integrated uranium producer with mining and fuel fabrication capabilities, while NexGen is primarily an exploration and development company focused on advancing its Rook I project. Cameco’s broader operational scope contrasts with NexGen’s focus on resource acquisition and evaluation, reflecting different stages in the uranium value chain.
Income Statement Comparison
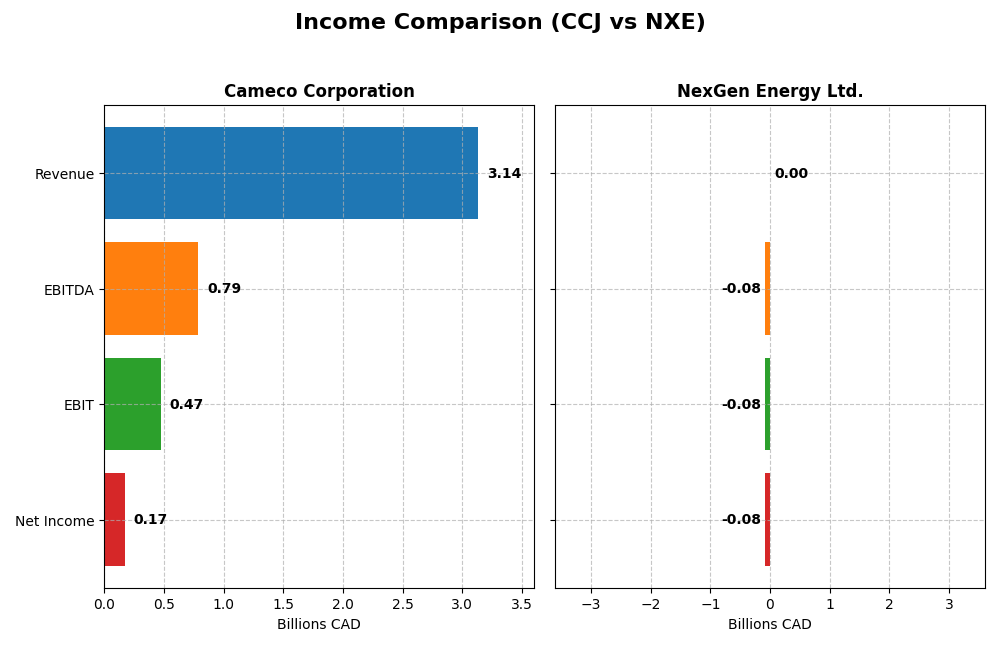
This table compares the key income statement metrics for Cameco Corporation and NexGen Energy Ltd. for the fiscal year 2024, providing a clear view of their financial performance.
| Metric | Cameco Corporation (CCJ) | NexGen Energy Ltd. (NXE) |
|---|---|---|
| Market Cap | 46.8B CAD | 7.0B CAD |
| Revenue | 3.14B CAD | 0 CAD |
| EBITDA | 789M CAD | -77M CAD |
| EBIT | 475M CAD | -78M CAD |
| Net Income | 172M CAD | -78M CAD |
| EPS | 0.40 CAD | -0.14 CAD |
| Fiscal Year | 2024 | 2024 |
Income Statement Interpretations
Cameco Corporation
Cameco Corporation’s revenue grew steadily from CAD 1.47B in 2021 to CAD 3.14B in 2024, with net income recovering from a loss in 2021 to CAD 172M in 2024. Margins improved overall, with a gross margin near 34% and a net margin of 5.5% in 2024. However, net income and EBIT margins declined sharply in the latest year, signaling some pressure despite revenue growth.
NexGen Energy Ltd.
NexGen Energy reported no revenue from 2020 to 2024, reflecting its exploration stage, with net income fluctuating and turning negative in 2024 at CAD -78M. Margins remain at zero due to lack of sales, and operating expenses have increased, though interest expense remains low. The company’s net income and EPS deteriorated significantly in 2024, reflecting ongoing investment and development costs.
Which one has the stronger fundamentals?
Cameco exhibits stronger fundamentals with positive revenue growth and improving margins over the long term, despite recent margin pressures. In contrast, NexGen’s lack of revenue and persistent losses indicate higher operational risk and less mature financial metrics. Overall, Cameco’s income statement shows a more favorable and stable financial performance compared to NexGen’s exploration-stage profile.
Financial Ratios Comparison
The table below presents a side-by-side comparison of key financial ratios for Cameco Corporation (CCJ) and NexGen Energy Ltd. (NXE) based on their most recent fiscal year data as of 2024.
| Ratios | Cameco Corporation (CCJ) | NexGen Energy Ltd. (NXE) |
|---|---|---|
| ROE | 2.70% | -6.58% |
| ROIC | 3.79% | -4.39% |
| P/E | 187.0 | -67.8 |
| P/B | 5.05 | 4.46 |
| Current Ratio | 1.62 | 1.03 |
| Quick Ratio | 0.80 | 1.03 |
| D/E | 0.20 | 0.39 |
| Debt-to-Assets | 13.1% | 27.6% |
| Interest Coverage | 4.60 | -2.33 |
| Asset Turnover | 0.32 | 0 |
| Fixed Asset Turnover | 0.95 | 0 |
| Payout Ratio | 40.5% | 0% |
| Dividend Yield | 0.22% | 0% |
Interpretation of the Ratios
Cameco Corporation
Cameco’s 2024 ratios show a mixed picture with a current ratio of 1.62 and low debt-to-equity at 0.2, both favorable, indicating reasonable liquidity and financial leverage. However, return on equity (2.7%) and return on invested capital (3.79%) are considered unfavorable, while valuation metrics like P/E at 187 and P/B at 5.05 raise concerns. The company pays dividends with a low yield of 0.22%, suggesting limited shareholder returns.
NexGen Energy Ltd.
NexGen’s 2024 ratios mostly reflect challenges, with net margin at 0% and negative returns on equity (-6.58%) and invested capital (-4.39%), all unfavorable. Liquidity ratios like quick ratio (1.03) and debt-to-assets (27.56%) are favorable, but operating efficiency is weak, with zero asset turnover. The company does not pay dividends, consistent with its exploration and development stage focus.
Which one has the best ratios?
Comparing the two, Cameco exhibits a stronger liquidity position and dividend payout, though it faces valuation and profitability headwinds. NexGen shows more unfavorable profitability and operational ratios, but maintains a healthier balance of liquidity and leverage for its stage. Overall, Cameco’s ratios are slightly unfavorable, while NexGen’s are assessed as unfavorable in 2024.
Strategic Positioning
This section compares the strategic positioning of Cameco Corporation and NexGen Energy Ltd., including their market position, key segments, and exposure to technological disruption:
Cameco Corporation
- Established uranium producer with significant market cap, facing competitive pressure in uranium industry.
- Operates two segments: Uranium mining and Fuel Services including refining and fuel fabrication.
- No explicit mention of exposure to technological disruption in uranium mining or fuel services.
NexGen Energy Ltd.
- Exploration and development stage focused on uranium properties in Canada, with smaller market cap and higher beta.
- Focused on acquisition, exploration, and development of uranium properties, mostly centered on Rook I project.
- No explicit mention of exposure to technological disruption; primarily exploration activities.
Cameco Corporation vs NexGen Energy Ltd. Positioning
Cameco is diversified with established uranium production and fuel services, offering broad market reach. NexGen is concentrated in exploration and development with a smaller scale and higher market risk. Both face value destruction but show improving profitability.
Which has the best competitive advantage?
Both companies are slightly unfavorable in MOAT evaluation, shedding value but with growing ROIC. Cameco’s larger scale and segment diversification may offer a more stable advantage compared to NexGen’s exploration focus.
Stock Comparison
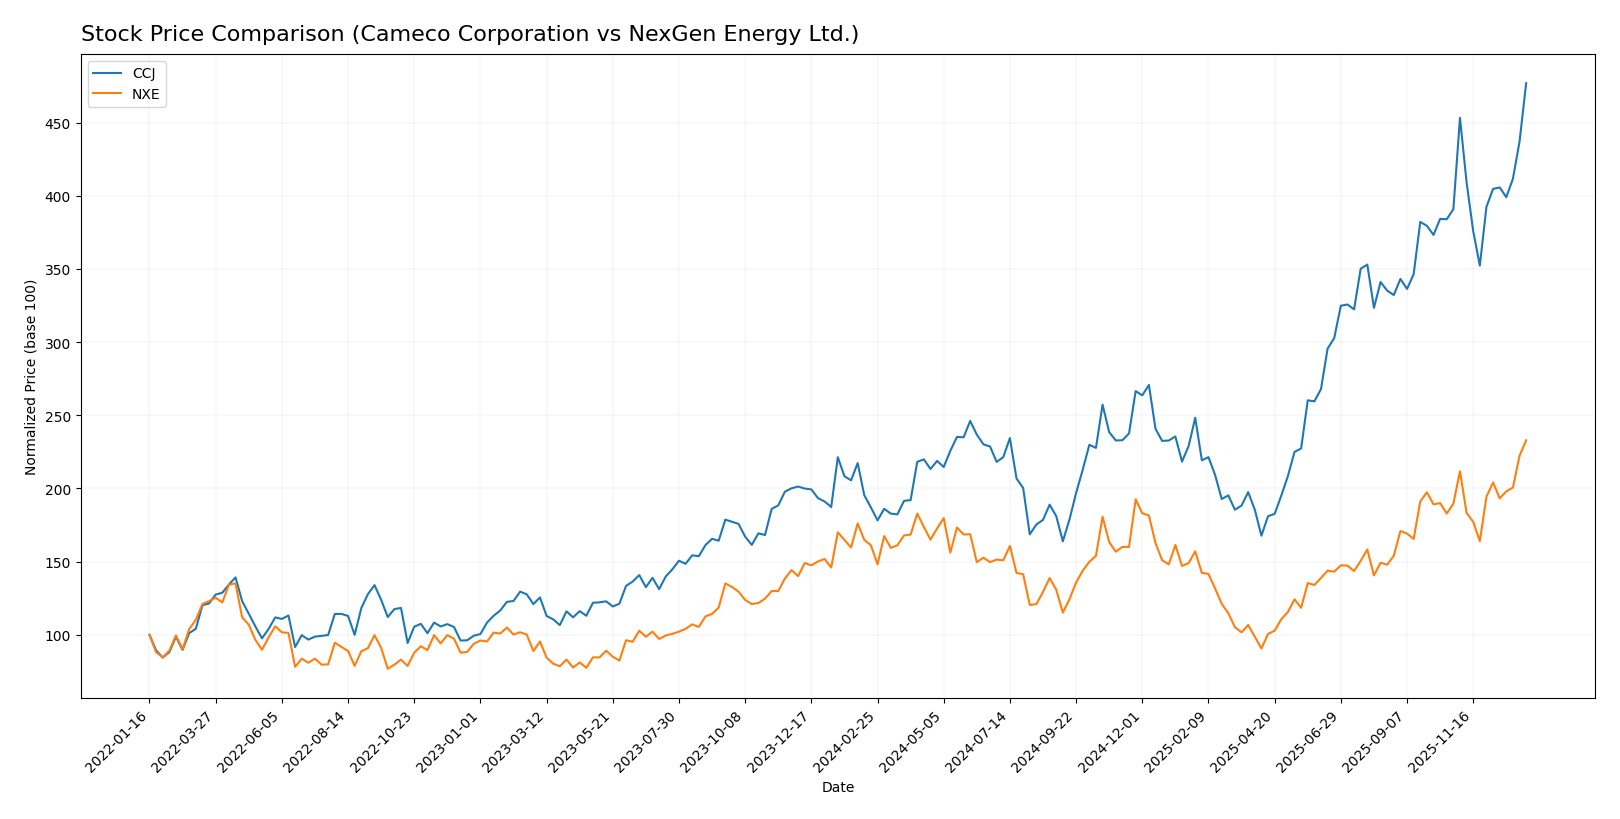
The stock prices of Cameco Corporation (CCJ) and NexGen Energy Ltd. (NXE) have shown notable bullish movements over the past 12 months, with both exhibiting acceleration in their upward trends and distinct trading volumes dynamics.
Trend Analysis
Cameco Corporation’s stock recorded a 155.0% increase over the past year, confirming a strong bullish trend with accelerating momentum. The price ranged from a low of 36.96 to a high of 107.56, accompanied by a relatively high volatility of 17.73%.
NexGen Energy Ltd. saw a 44.55% price gain over the same period, also reflecting a bullish trend with acceleration. The stock price fluctuated between 4.18 and 10.74, exhibiting lower volatility at 1.3% compared to Cameco’s.
Comparing the two, Cameco Corporation delivered the higher market performance with a 155.0% rise versus NexGen’s 44.55%, both showing buyer dominance but differing in volatility and volume trends.
Target Prices
The analyst consensus for Cameco Corporation indicates moderate upside potential based on recent target prices.
| Company | Target High | Target Low | Consensus |
|---|---|---|---|
| Cameco Corporation | 109 | 99.74 | 102.75 |
Analysts expect Cameco’s price to trade slightly above the current level of $107.56, suggesting cautious optimism. No verified target price data is available for NexGen Energy Ltd.
Analyst Opinions Comparison
This section compares analysts’ ratings and grades for Cameco Corporation and NexGen Energy Ltd.:
Rating Comparison
CCJ Rating
- Rating: B, evaluated as Very Favorable by analysts.
- Discounted Cash Flow Score: Moderate at 3, indicating balanced valuation.
- ROE Score: Favorable at 4, reflecting strong profit generation from equity.
- ROA Score: Favorable at 4, demonstrating effective asset utilization.
- Debt To Equity Score: Moderate at 3, suggesting manageable financial risk.
- Overall Score: Moderate at 3, summarizing a balanced financial standing.
NXE Rating
- Rating: D+, also marked as Very Favorable by analysts.
- Discounted Cash Flow Score: Moderate at 2, showing some valuation concerns.
- ROE Score: Very Unfavorable at 1, indicating weak equity profitability.
- ROA Score: Very Unfavorable at 1, showing poor asset efficiency.
- Debt To Equity Score: Very Unfavorable at 1, implying higher financial risk.
- Overall Score: Very Unfavorable at 1, indicating weak overall financials.
Which one is the best rated?
Based on the provided data, Cameco Corporation (CCJ) holds stronger ratings and scores across key financial metrics compared to NexGen Energy Ltd. (NXE), which shows consistently lower scores and an overall very unfavorable financial profile.
Scores Comparison
Here is the comparison of financial health scores between Cameco Corporation and NexGen Energy Ltd.:
CCJ Scores
- Altman Z-Score: 10.76, indicating a strong financial position in the safe zone.
- Piotroski Score: 8, reflecting very strong financial strength and value.
NXE Scores
- Altman Z-Score: 6.89, also in the safe zone but lower than CCJ’s score.
- Piotroski Score: 1, showing very weak financial health and potential risks.
Which company has the best scores?
Based strictly on the provided data, CCJ has stronger scores with a higher Altman Z-Score and a very strong Piotroski Score compared to NXE’s safe zone Altman Z-Score but very weak Piotroski Score.
Grades Comparison
The following section compares the available grades and ratings for Cameco Corporation and NexGen Energy Ltd.:
Cameco Corporation Grades
This table summarizes the recent grades assigned to Cameco Corporation by recognized grading companies.
| Grading Company | Action | New Grade | Date |
|---|---|---|---|
| RBC Capital | Maintain | Outperform | 2025-11-13 |
| RBC Capital | Maintain | Outperform | 2025-10-31 |
| Goldman Sachs | Maintain | Buy | 2025-10-29 |
| RBC Capital | Maintain | Outperform | 2025-08-01 |
| RBC Capital | Maintain | Outperform | 2025-06-20 |
| GLJ Research | Maintain | Buy | 2025-06-12 |
| Goldman Sachs | Maintain | Buy | 2025-06-11 |
| GLJ Research | Maintain | Buy | 2025-03-12 |
| RBC Capital | Maintain | Outperform | 2025-03-04 |
| Scotiabank | Maintain | Outperform | 2024-08-19 |
The grades for Cameco Corporation demonstrate a consistent pattern of positive ratings, predominantly “Outperform” and “Buy,” with all actions being “maintain.”
No reliable grades are available for NexGen Energy Ltd., indicating a lack of publicly reported professional analyst ratings.
Which company has the best grades?
Cameco Corporation holds the stronger and more frequent grades from reputable firms, consistently rated as “Outperform” or “Buy.” NexGen Energy Ltd. lacks comparable professional evaluations, which may translate to higher uncertainty for investors assessing its market potential.
Strengths and Weaknesses
Below is a comparative overview of the key strengths and weaknesses of Cameco Corporation (CCJ) and NexGen Energy Ltd. (NXE) based on their diversification, profitability, innovation, global presence, and market share as of 2026.
| Criterion | Cameco Corporation (CCJ) | NexGen Energy Ltd. (NXE) |
|---|---|---|
| Diversification | Moderate, focused on uranium production | Limited, primarily uranium exploration |
| Profitability | Slightly unfavorable; ROIC below WACC but improving (ROIC 3.79%, WACC 9.46%) | Unfavorable; ROIC significantly below WACC and negative net margin |
| Innovation | Stable with ongoing efforts to improve operations | Emerging, with growth potential but currently unprofitable |
| Global presence | Established global player with solid financial stability | Smaller global footprint, more regional focus |
| Market Share | Significant share in uranium mining | Smaller market presence, early-stage growth |
Key takeaways: Both companies are currently shedding value with ROIC below WACC, but both show improving profitability trends. Cameco offers more stability and diversification, whereas NexGen presents higher risk but potential growth. Investors should weigh these factors carefully, balancing risk and opportunity.
Risk Analysis
Below is a comparison table summarizing key risks for Cameco Corporation (CCJ) and NexGen Energy Ltd. (NXE) based on the latest 2024 data and 2026 market context:
| Metric | Cameco Corporation (CCJ) | NexGen Energy Ltd. (NXE) |
|---|---|---|
| Market Risk | Beta 1.22, moderate market volatility exposure | Beta 1.86, higher volatility risk |
| Debt Level | Low debt-to-equity (0.2), favorable leverage | Moderate debt-to-equity (0.39), manageable but higher |
| Regulatory Risk | Medium, uranium mining heavily regulated globally | Medium to high, exploration stage with regulatory approvals pending |
| Operational Risk | Established operations, moderate operational risks | High, as development stage company with no production yet |
| Environmental Risk | Significant due to uranium mining impact, but established protocols | High, exploration activities in sensitive areas |
| Geopolitical Risk | Exposure to global nuclear policies, moderate risk | Similar exposure, but higher risk due to project location and stage |
The most impactful risks are operational and regulatory for NexGen due to its early development status, increasing uncertainty and potential delays. Cameco’s main risks lie in market volatility and environmental regulation compliance, but its stable operations reduce immediate threat levels. Investors should weigh NexGen’s higher risk-return profile against Cameco’s steadier, more mature position.
Which Stock to Choose?
Cameco Corporation (CCJ) shows a favorable income evolution with 78.57% positive income statement indicators and strong revenue growth of 74.2% over five years. However, its financial ratios are slightly unfavorable, with only 21.43% favorable ratios and challenges in profitability metrics like ROE and ROIC. The company maintains low debt levels and a very favorable overall rating of B.
NexGen Energy Ltd. (NXE) presents an unfavorable income statement profile with 71.43% unfavorable metrics and stagnant revenue growth. Financial ratios remain mostly unfavorable at 64.29%, though debt-related ratios are favorable. NXE’s rating is very favorable at D+, but underlying profitability and efficiency scores are weak, reflecting ongoing value destruction despite some improvement in ROIC.
For investors prioritizing income statement strength and a track record of revenue and profit growth, CCJ might appear more favorable. Conversely, those who consider current valuation and are tolerant of operational challenges could see potential in NXE, given its very favorable rating despite weak profitability measures. The choice could thus depend on one’s risk tolerance and investment strategy focus.
Disclaimer: Investment carries a risk of loss of initial capital. The past performance is not a reliable indicator of future results. Be sure to understand risks before making an investment decision.
Go Further
I encourage you to read the complete analyses of Cameco Corporation and NexGen Energy Ltd. to enhance your investment decisions: