In the evolving uranium industry, Cameco Corporation (CCJ) and IsoEnergy Ltd. (ISOU) stand out as key players with distinct approaches. Cameco, a well-established producer with extensive mining and fuel services, contrasts with IsoEnergy, a nimble explorer focused on promising Canadian properties. Both companies share a market overlap and innovation in nuclear energy supply. This article will analyze their strengths to reveal which investment is more compelling for your portfolio.

Table of contents
Companies Overview
I will begin the comparison between Cameco Corporation and IsoEnergy Ltd. by providing an overview of these two companies and their main differences.
Cameco Corporation Overview
Cameco Corporation operates in the uranium industry, focusing on exploration, mining, and milling, alongside refining and fabrication of uranium fuel. It serves nuclear utilities across the Americas, Europe, and Asia. Founded in 1987 and headquartered in Saskatoon, Canada, Cameco is a well-established player with a market capitalization of approximately 46.8B USD, employing around 730 people.
IsoEnergy Ltd. Overview
IsoEnergy Ltd. is a younger company incorporated in 2016, specializing in the acquisition, development, and exploration of uranium mineral properties primarily in the Athabasca Basin of Saskatchewan, Canada. With a market cap near 600M USD and a workforce of 18 employees, it operates as a subsidiary of NexGen Energy Ltd. IsoEnergy is focused on advancing its mineral property interests rather than uranium production or fuel services.
Key similarities and differences
Both companies operate within the uranium sector and are headquartered in Saskatoon, Canada, but they differ significantly in scale and business focus. Cameco offers a fully integrated uranium supply chain including mining and fuel services, catering to global nuclear utilities. In contrast, IsoEnergy concentrates on uranium property exploration and development, without engaging in fuel fabrication or sales, highlighting a more specialized and earlier-stage business model.
Income Statement Comparison
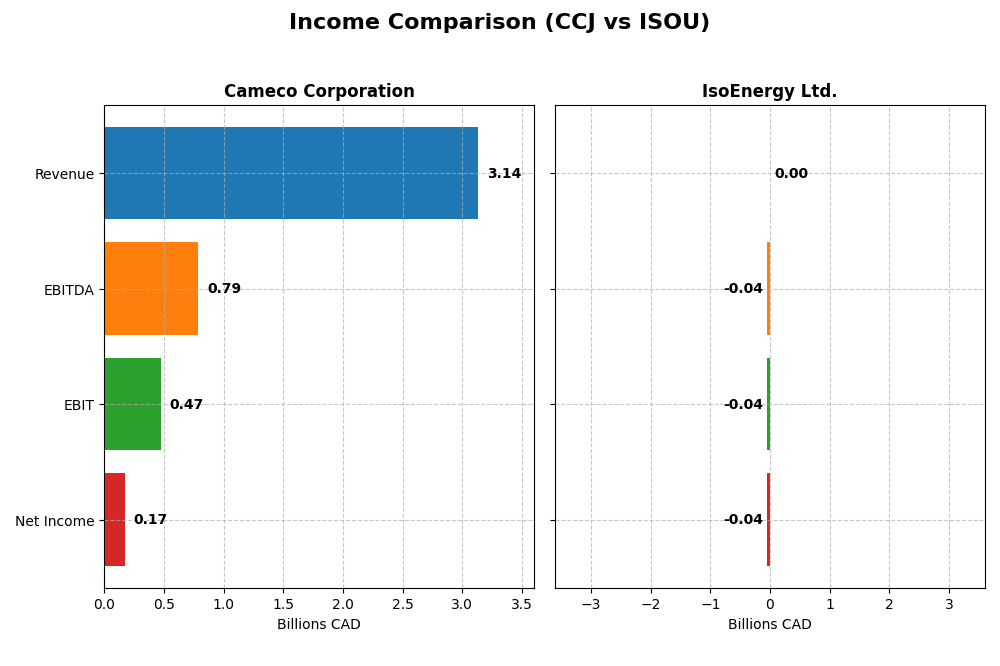
The table below compares the key income statement metrics of Cameco Corporation and IsoEnergy Ltd. for the fiscal year 2024.
| Metric | Cameco Corporation (CCJ) | IsoEnergy Ltd. (ISOU) |
|---|---|---|
| Market Cap | 46.8B CAD | 599M CAD |
| Revenue | 3.14B CAD | 0 CAD |
| EBITDA | 789M CAD | -42.5M CAD |
| EBIT | 475M CAD | -42.8M CAD |
| Net Income | 172M CAD | -42.1M CAD |
| EPS | 0.40 CAD | -1.38 CAD |
| Fiscal Year | 2024 | 2024 |
Income Statement Interpretations
Cameco Corporation
Cameco’s revenue steadily increased from CAD 1.47B in 2021 to CAD 3.14B in 2024, with net income recovering from a loss of CAD -103M in 2021 to CAD 172M in 2024. Margins improved overall, showing a favorable gross margin of 33.91% and net margin of 5.48%. However, net income and EPS declined in 2024 compared to 2023, indicating margin pressure despite revenue growth.
IsoEnergy Ltd.
IsoEnergy reported no revenue from 2020 to 2024, reflecting its exploration-stage status, with net losses widening from CAD -9.5M in 2020 to CAD -42.1M in 2024. Margins remain unfavorable as the company incurs ongoing operating expenses without sales. The latest year shows increased administrative and other costs, deepening net losses and negative EPS to -1.38 CAD.
Which one has the stronger fundamentals?
Cameco Corporation demonstrates stronger fundamentals with significant revenue growth, positive net income, and improving margins over the period, despite recent profit margin contractions. IsoEnergy’s financials reveal continued losses with no revenue, typical for an early-stage explorer. Overall, Cameco’s income statement reflects a more stable and favorable financial position compared to IsoEnergy’s ongoing operational deficits.
Financial Ratios Comparison
The table below presents the key financial ratios for Cameco Corporation (CCJ) and IsoEnergy Ltd. (ISOU) based on their most recent fiscal year data, providing a snapshot of their financial health and performance.
| Ratios | Cameco Corporation (CCJ) | IsoEnergy Ltd. (ISOU) |
|---|---|---|
| ROE | 2.70% | -13.90% |
| ROIC | 3.79% | -12.50% |
| P/E | 187.0 | -9.64 |
| P/B | 5.05 | 1.34 |
| Current Ratio | 1.62 | 1.70 |
| Quick Ratio | 0.80 | 1.70 |
| D/E (Debt-to-Equity) | 0.20 | 0.10 |
| Debt-to-Assets | 13.1% | 9.0% |
| Interest Coverage | 4.60 | -32.10 |
| Asset Turnover | 0.32 | 0.00 |
| Fixed Asset Turnover | 0.95 | 0.00 |
| Payout Ratio | 40.5% | 0.0% |
| Dividend Yield | 0.22% | 0.0% |
Interpretation of the Ratios
Cameco Corporation
Cameco shows a mixed ratio profile with a favorable current ratio of 1.62 and low debt-to-assets at 13.08%, indicating solid liquidity and manageable leverage. However, profitability ratios like ROE at 2.7% and ROIC at 3.79% are unfavorable, and valuation metrics such as PE at 187 and PB at 5.05 also raise concerns. The company pays dividends with a low yield of 0.22%, suggesting modest shareholder returns but potential risks due to its payout coverage and valuation.
IsoEnergy Ltd.
IsoEnergy displays several favorable financial ratios, including a strong current and quick ratio both at 1.7, low debt-to-assets at 9%, and reasonable valuation multiples with a PB of 1.34. Nevertheless, profitability metrics like ROE at -13.9% and net margin at 0% are unfavorable, reflecting operational challenges. The company does not pay dividends, consistent with its exploration and growth phase, likely prioritizing reinvestment over shareholder distributions.
Which one has the best ratios?
Both Cameco and IsoEnergy have slightly unfavorable overall ratio assessments with 50% unfavorable ratios each. Cameco benefits from stronger liquidity and dividend payments but struggles with profitability and valuation. IsoEnergy has better leverage and liquidity ratios but faces more significant operational losses and no dividend returns. Neither stands out decisively as having the best ratios.
Strategic Positioning
This section compares the strategic positioning of Cameco Corporation and IsoEnergy Ltd., focusing on market position, key segments, and exposure to technological disruption:
Cameco Corporation
- Established uranium producer with significant market cap and competitive pressure.
- Operates two segments: Uranium mining and Fuel Services supplying global nuclear utilities.
- No explicit mention of technological disruption exposure in provided data.
IsoEnergy Ltd.
- Smaller market cap focused on uranium exploration with lower competitive pressure.
- Focused on acquisition, development, and exploration of uranium properties primarily in Canada.
- No explicit mention of technological disruption exposure in provided data.
Cameco Corporation vs IsoEnergy Ltd. Positioning
Cameco has a diversified business model with mining and fuel services, offering broader market reach. IsoEnergy concentrates solely on uranium exploration, implying higher focus but narrower revenue streams and operational scale.
Which has the best competitive advantage?
Both companies are currently shedding value but show growing profitability trends. Cameco’s larger scale and diversified segments suggest a more established moat, while IsoEnergy’s smaller size limits its competitive economic advantage.
Stock Comparison
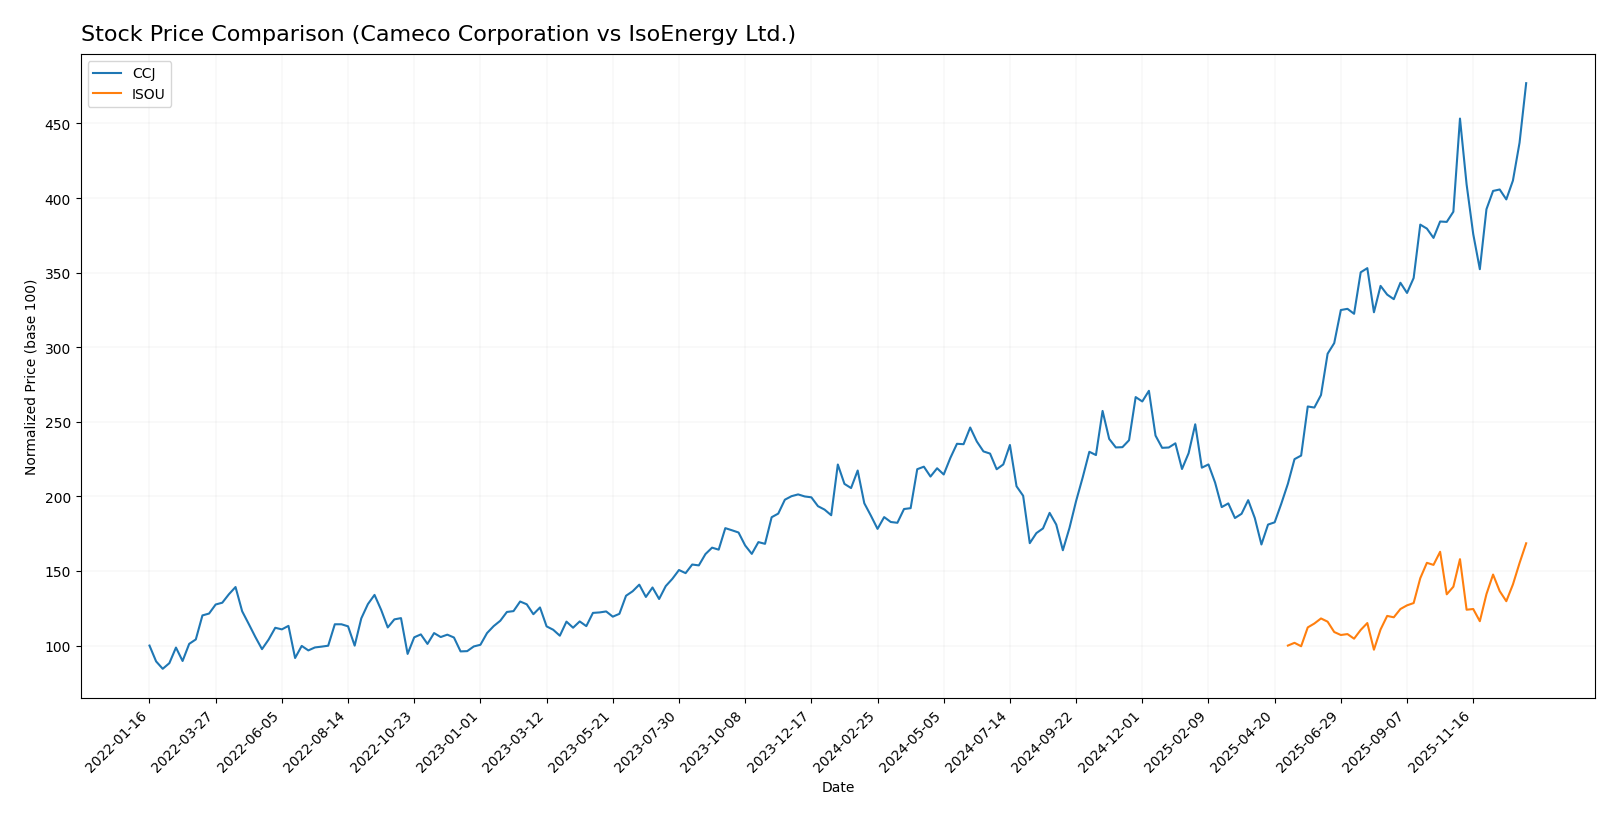
The stock prices of Cameco Corporation and IsoEnergy Ltd. have shown significant bullish momentum over the past 12 months, with Cameco exhibiting stronger acceleration and higher volatility compared to IsoEnergy.
Trend Analysis
Cameco Corporation’s stock increased by 155.0% over the past year, indicating a strong bullish trend with accelerating growth and a high price volatility of 17.73. The stock ranged from 36.96 to 107.56, showing robust upward momentum.
IsoEnergy Ltd. recorded a 68.57% price increase over the same period, confirming a bullish trend with moderate acceleration and low volatility at 1.25. The stock price fluctuated between 6.31 and 10.94, reflecting steadier gains.
Comparing both, Cameco Corporation delivered the highest market performance with a more pronounced price increase and greater volatility, while IsoEnergy showed solid but more moderate growth.
Target Prices
Analysts present a clear consensus on Cameco Corporation’s target price, reflecting moderate upside potential.
| Company | Target High | Target Low | Consensus |
|---|---|---|---|
| Cameco Corporation | 109 | 99.74 | 102.75 |
Cameco’s consensus target price of 102.75 is slightly below its current stock price of 107.56, suggesting limited upside or a possible overvaluation risk. No verified target price data is available for IsoEnergy Ltd.
Analyst Opinions Comparison
This section compares analysts’ ratings and grades for Cameco Corporation and IsoEnergy Ltd.:
Rating Comparison
Cameco Corporation Rating
- Rating: B, indicating a very favorable overall evaluation.
- Discounted Cash Flow Score: 3, considered moderate.
- ROE Score: 4, a favorable indicator of profit generation.
- ROA Score: 4, favorable use of assets to generate earnings.
- Debt To Equity Score: 3, moderate financial risk assessment.
- Overall Score: 3, moderate financial standing summary.
IsoEnergy Ltd. Rating
- Rating: C-, with a very unfavorable overall evaluation.
- Discounted Cash Flow Score: 1, very unfavorable.
- ROE Score: 1, very unfavorable for profit generation.
- ROA Score: 1, very unfavorable asset utilization.
- Debt To Equity Score: 3, moderate financial risk assessment.
- Overall Score: 1, very unfavorable financial standing.
Which one is the best rated?
Cameco Corporation is better rated with a B rating and generally favorable scores in ROE and ROA, while IsoEnergy Ltd. has a C- rating and very unfavorable scores except for a moderate debt to equity score.
Scores Comparison
The comparison of financial health scores for Cameco Corporation and IsoEnergy Ltd. is as follows:
CCJ Scores
- Altman Z-Score: 10.76, indicating a safe zone with low bankruptcy risk.
- Piotroski Score: 8, classified as very strong financial health.
ISOU Scores
- Altman Z-Score: 19.22, indicating a safe zone with very low bankruptcy risk.
- Piotroski Score: 2, classified as very weak financial health.
Which company has the best scores?
IsoEnergy Ltd. shows a higher Altman Z-Score, suggesting lower bankruptcy risk, while Cameco Corporation has a much stronger Piotroski Score, indicating better financial strength. The scores reflect different strengths for the two companies.
Grades Comparison
The grades comparison for Cameco Corporation and IsoEnergy Ltd. is detailed below:
Cameco Corporation Grades
This table summarizes recent grades assigned by reputable grading companies to Cameco Corporation’s stock:
| Grading Company | Action | New Grade | Date |
|---|---|---|---|
| RBC Capital | maintain | Outperform | 2025-11-13 |
| RBC Capital | maintain | Outperform | 2025-10-31 |
| Goldman Sachs | maintain | Buy | 2025-10-29 |
| RBC Capital | maintain | Outperform | 2025-08-01 |
| RBC Capital | maintain | Outperform | 2025-06-20 |
| GLJ Research | maintain | Buy | 2025-06-12 |
| Goldman Sachs | maintain | Buy | 2025-06-11 |
| GLJ Research | maintain | Buy | 2025-03-12 |
| RBC Capital | maintain | Outperform | 2025-03-04 |
| Scotiabank | maintain | Outperform | 2024-08-19 |
Overall, Cameco Corporation maintains a consistent positive outlook with multiple “Outperform” and “Buy” ratings from established financial institutions.
IsoEnergy Ltd. Grades
No reliable grades or ratings are available for IsoEnergy Ltd. from verified grading companies.
Which company has the best grades?
Cameco Corporation clearly has better grades with numerous positive ratings such as “Outperform” and “Buy” from reputable grading companies, while IsoEnergy Ltd. lacks any verified grading data. This disparity may affect investor confidence and perceived risk in portfolio decisions.
Strengths and Weaknesses
Below is a comparison of key strengths and weaknesses for Cameco Corporation (CCJ) and IsoEnergy Ltd. (ISOU) based on their latest financial and operational data.
| Criterion | Cameco Corporation (CCJ) | IsoEnergy Ltd. (ISOU) |
|---|---|---|
| Diversification | Moderate, focused on uranium mining | Limited, primarily uranium exploration |
| Profitability | Neutral net margin (5.48%), low ROE (2.7%) | Unfavorable profitability, negative ROE (-13.9%) |
| Innovation | Moderate innovation, improving ROIC trend (+450%) | Early-stage with growing ROIC, but overall negative returns |
| Global presence | Established international operations | Smaller scale, less global footprint |
| Market Share | Significant share in uranium market | Emerging player, limited market share |
Key takeaways: Both companies show slightly unfavorable financial ratios and are currently shedding value, though their ROIC trends are improving. Cameco benefits from greater diversification and global presence, while IsoEnergy is a smaller, riskier exploration-focused firm with potential growth. Investors should weigh stability versus growth potential carefully.
Risk Analysis
Below is a comparative risk table for Cameco Corporation (CCJ) and IsoEnergy Ltd. (ISOU) based on the most recent data from 2024.
| Metric | Cameco Corporation (CCJ) | IsoEnergy Ltd. (ISOU) |
|---|---|---|
| Market Risk | Moderate (Beta 1.22) | Moderate (Beta 0.96) |
| Debt level | Low (Debt/Equity 0.2) | Low (Debt/Equity 0.1) |
| Regulatory Risk | Medium (Energy sector) | Medium (Energy sector) |
| Operational Risk | Moderate (Mining & Fuel Services) | High (Exploration stage) |
| Environmental Risk | Significant (Uranium mining impact) | Significant (Uranium exploration) |
| Geopolitical Risk | Medium (Global uranium markets) | Medium (Global uranium markets) |
Cameco faces moderate market and operational risks, balanced by low debt and solid financial stability, but high P/E and P/B ratios suggest valuation concerns. IsoEnergy, as a newer explorer, carries higher operational risk and weak profitability, despite low debt. Environmental and geopolitical risks are material for both due to uranium’s nature and global market exposure. The most impactful risks are operational for IsoEnergy and valuation and market sensitivity for Cameco.
Which Stock to Choose?
Cameco Corporation (CCJ) shows a favorable income evolution with a 74.2% revenue growth over 2020-2024 and strong profitability metrics, despite some recent declines in EBIT and EPS. Its financial ratios reveal moderate leverage and liquidity with a slightly unfavorable overall rating of its ratios but a very favorable company rating. Debt levels are low, supporting financial stability.
IsoEnergy Ltd. (ISOU) exhibits an unfavorable income evolution marked by zero revenue growth and negative profitability indicators over the period. Its ratios show a mix of favorable leverage and liquidity but mostly unfavorable profitability and efficiency metrics, resulting in a slightly unfavorable global ratios opinion and a very favorable company rating despite weak operational scores. Debt remains low.
For investors, Cameco’s favorable income trends and moderate financial stability might appeal to those seeking growth with some risk tolerance, while IsoEnergy’s profile could appear more suitable for cautious investors focusing on low debt but facing profitability challenges. The ratings and income evaluations suggest different risk-reward considerations depending on investment objectives.
Disclaimer: Investment carries a risk of loss of initial capital. The past performance is not a reliable indicator of future results. Be sure to understand risks before making an investment decision.
Go Further
I encourage you to read the complete analyses of Cameco Corporation and IsoEnergy Ltd. to enhance your investment decisions: