In the evolving uranium sector, selecting the right company to invest in is crucial for capitalizing on energy transition trends. Cameco Corporation (CCJ) and Energy Fuels Inc. (UUUU) are key players, both deeply involved in uranium mining and production, yet differing in scale and geographic focus. This comparison highlights their market positions and innovation approaches to help you identify the most promising investment opportunity. Let’s explore which company stands out for your portfolio.
Table of contents
Companies Overview
I will begin the comparison between Cameco Corporation and Energy Fuels Inc. by providing an overview of these two companies and their main differences.
Cameco Corporation Overview
Cameco Corporation operates in the uranium industry, focusing on the exploration, mining, milling, and sale of uranium concentrate. It also provides fuel services including refining, conversion, and fabrication of uranium fuel bundles for nuclear reactors. The company serves nuclear utilities across the Americas, Europe, and Asia, positioning itself as a key global player headquartered in Saskatoon, Canada.
Energy Fuels Inc. Overview
Energy Fuels Inc. is a U.S.-based uranium company engaged in extraction, recovery, exploration, and sale of uranium through conventional and in situ methods. It owns multiple projects and a mill located in Wyoming, Texas, and Utah, with additional interests across several western states. The company focuses primarily on the North American market and is headquartered in Lakewood, Colorado.
Key similarities and differences
Both companies operate in the uranium sector within the energy industry, serving the nuclear fuel market. Cameco has a more diversified business model with segments covering uranium mining and fuel services globally. Energy Fuels concentrates on uranium mining and recovery in the U.S. with a larger employee base but a smaller market capitalization. Their geographic focus and scope of operations mark the main distinctions.
Income Statement Comparison
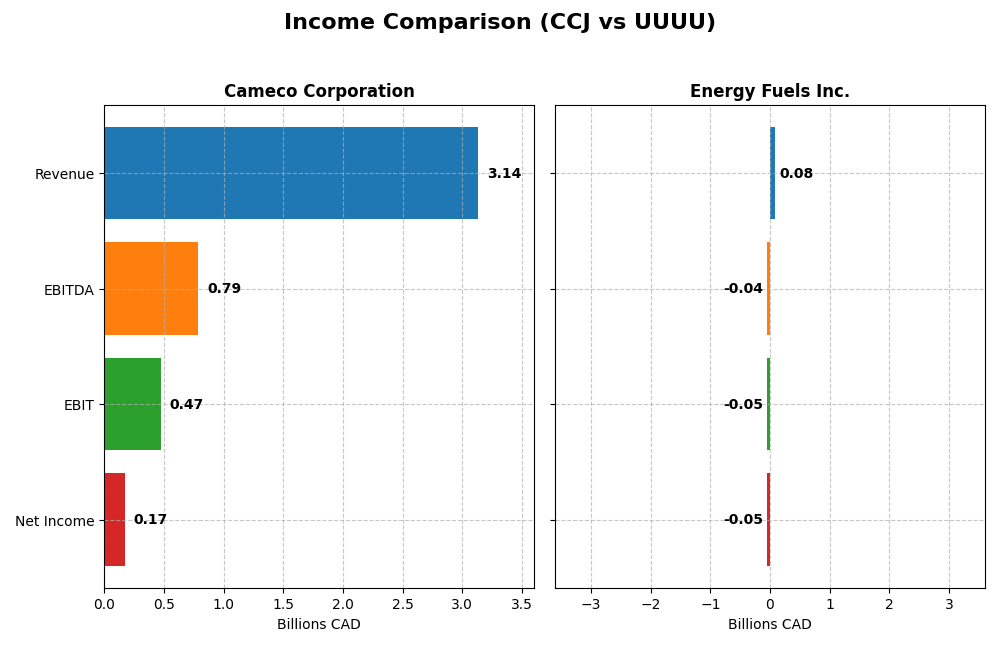
The table below compares key income statement metrics for Cameco Corporation and Energy Fuels Inc. for the fiscal year 2024, providing a snapshot of their financial performance.
| Metric | Cameco Corporation (CCJ) | Energy Fuels Inc. (UUUU) |
|---|---|---|
| Market Cap | 46.8B CAD | 4.3B USD |
| Revenue | 3.14B CAD | 78.1M USD |
| EBITDA | 789M CAD | -43.0M USD |
| EBIT | 475M CAD | -48.2M USD |
| Net Income | 172M CAD | -47.8M USD |
| EPS | 0.40 CAD | -0.28 USD |
| Fiscal Year | 2024 | 2024 |
Income Statement Interpretations
Cameco Corporation
Cameco’s revenue rose steadily from CAD 1.47B in 2021 to CAD 3.14B in 2024, reflecting a 74.2% growth over five years. Net income improved significantly overall but dropped to CAD 172M in 2024 from CAD 361M in 2023. Margins remain solid with a 33.91% gross margin and 5.48% net margin in 2024, although EBIT and net margins declined in the most recent year, signaling some pressure on profitability.
Energy Fuels Inc.
Energy Fuels’ revenue surged from USD 3.18M in 2021 to USD 78.1M in 2024, more than doubling year-over-year recently. However, net income swung from a modest profit in 2023 (USD 100M) to a loss of USD 48M in 2024. Gross margin stayed positive at 21.76%, but EBIT and net margins were negative in 2024, marking deteriorating profitability despite strong top-line growth.
Which one has the stronger fundamentals?
Cameco shows stronger fundamentals overall, with favorable trends in revenue growth, gross and net margins, and a majority of positive income statement metrics. Energy Fuels demonstrates impressive revenue gains but struggles with consistent profitability and negative margins. The balanced profile of Cameco contrasts with Energy Fuels’ mixed results, making Cameco’s financial health comparatively more stable.
Financial Ratios Comparison
The following table presents a side-by-side comparison of key financial ratios for Cameco Corporation (CCJ) and Energy Fuels Inc. (UUUU) based on their 2024 fiscal year data.
| Ratios | Cameco Corporation (CCJ) | Energy Fuels Inc. (UUUU) |
|---|---|---|
| ROE | 2.70% | -9.05% |
| ROIC | 3.79% | -6.67% |
| P/E | 187.0 | -18.5 |
| P/B | 5.05 | 1.67 |
| Current Ratio | 1.62 | 3.88 |
| Quick Ratio | 0.80 | 2.76 |
| D/E | 0.20 | 0.004 |
| Debt-to-Assets | 13.1% | 0.36% |
| Interest Coverage | 4.60 | 0 |
| Asset Turnover | 0.32 | 0.13 |
| Fixed Asset Turnover | 0.95 | 1.42 |
| Payout Ratio | 40.5% | 0% |
| Dividend Yield | 0.22% | 0% |
Interpretation of the Ratios
Cameco Corporation
Cameco exhibits a mix of strengths and weaknesses in its ratios. Its current ratio and debt-to-equity are favorable, indicating solid liquidity and manageable leverage. However, returns on equity and invested capital are low, with a high price-to-earnings ratio signaling overvaluation risks. The dividend yield is modest at 0.22%, reflecting a cautious payout approach, supported but limited by free cash flow.
Energy Fuels Inc.
Energy Fuels shows predominantly unfavorable ratios, with negative net margin, return on equity, and return on invested capital, suggesting operational and profitability challenges. It carries no dividend, consistent with its negative earnings and reinvestment focus. The company has no debt and a strong quick ratio, indicating liquidity strength despite weak profitability metrics and no shareholder distributions.
Which one has the best ratios?
Cameco Corporation holds a slightly unfavorable overall ratio profile but demonstrates better profitability and dividend distribution than Energy Fuels, whose financials are more challenged with negative returns and no dividends. While both have notable weaknesses, Cameco’s mix of favorable liquidity and modest returns positions it ahead in ratio quality compared to Energy Fuels’ broadly unfavorable metrics.
Strategic Positioning
This section compares the strategic positioning of Cameco Corporation and Energy Fuels Inc., including market position, key segments, and exposure to disruption:
Cameco Corporation
- Leading uranium producer with significant market cap and moderate competitive pressure.
- Operates in two segments: Uranium mining and Fuel Services, serving global nuclear utilities.
- Limited explicit exposure data to technological disruption, operates in traditional uranium sectors.
Energy Fuels Inc.
- Smaller uranium producer focused on U.S. operations, facing higher competitive pressure.
- Focuses on uranium extraction and recovery in multiple U.S. projects with exploration focus.
- No specific technological disruption exposure mentioned, relies on conventional and in situ recovery.
Cameco Corporation vs Energy Fuels Inc. Positioning
Cameco shows a diversified approach with two integrated segments serving global markets, while Energy Fuels concentrates on uranium extraction in the U.S. Cameco’s global footprint contrasts with Energy Fuels’ regional focus, implying different scale and market reach advantages.
Which has the best competitive advantage?
Both companies have a slightly unfavorable MOAT status, shedding value but showing growing ROIC trends. Neither currently demonstrates a strong competitive advantage based on their economic profitability metrics.
Stock Comparison
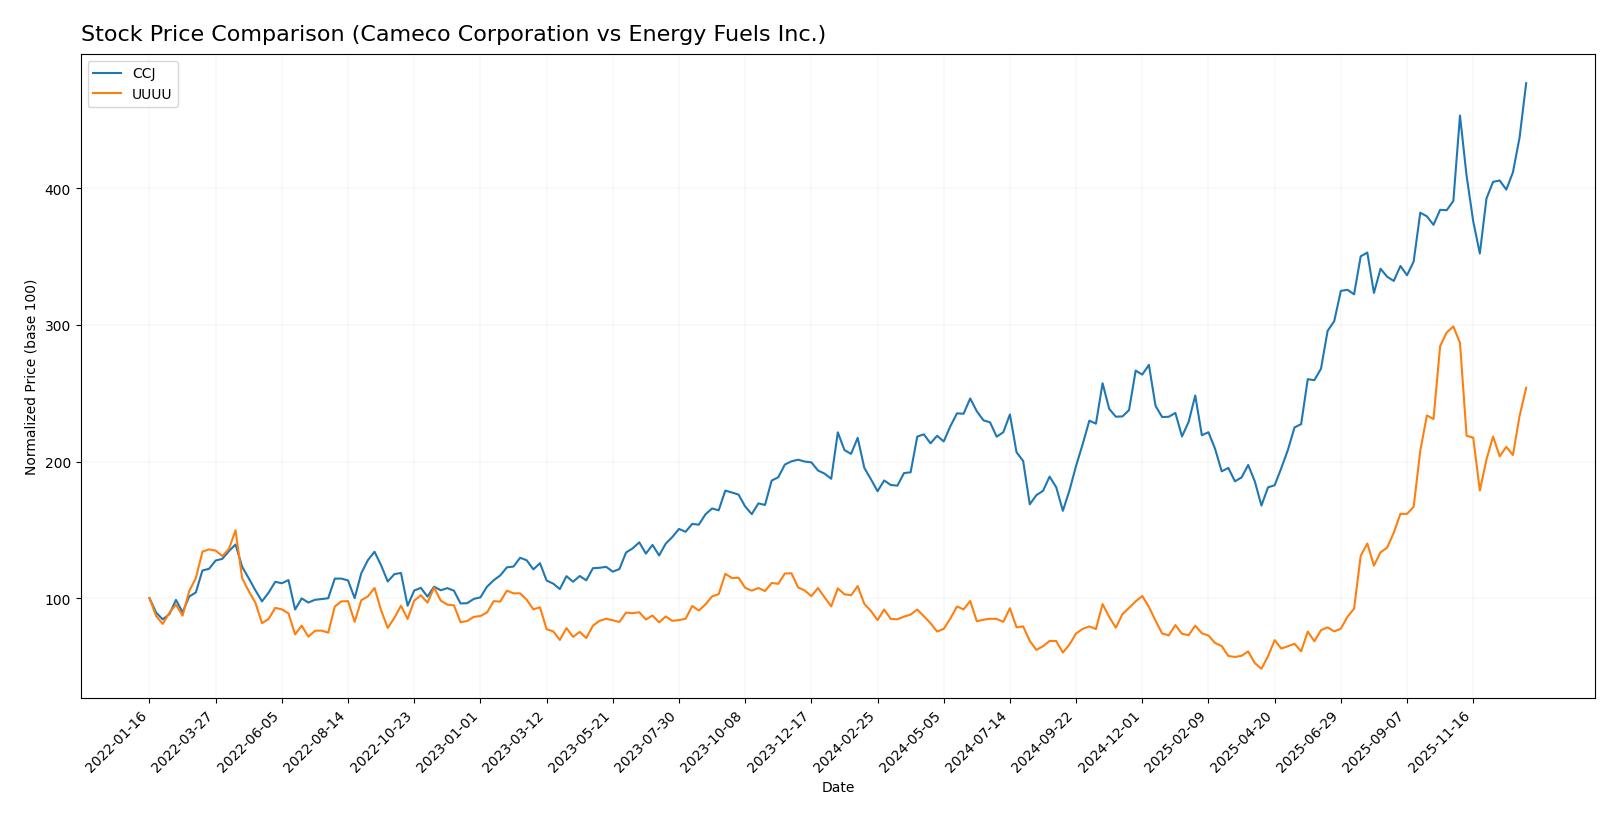
The past year reveals distinct price dynamics for Cameco Corporation and Energy Fuels Inc., with both stocks exhibiting strong overall gains but diverging recent trends reflecting differing momentum and volume patterns.
Trend Analysis
Cameco Corporation (CCJ) shows a bullish trend over the past 12 months with a 155.0% price increase and accelerating momentum, reaching a high of 107.56 and maintaining buyer dominance despite decreasing volume.
Energy Fuels Inc. (UUUU) also displays a bullish trend over the same period, with a 180.25% price rise but recent deceleration and a 15.02% price decline over the last quarter, accompanied by increasing volume and slight seller dominance recently.
Comparing trends, UUUU delivered the highest overall market performance with a 180.25% gain versus CCJ’s 155.0%, though CCJ’s acceleration contrasts with UUUU’s recent deceleration.
Target Prices
Analysts provide a clear consensus on target prices for both Cameco Corporation and Energy Fuels Inc.
| Company | Target High | Target Low | Consensus |
|---|---|---|---|
| Cameco Corporation | 109 | 99.74 | 102.75 |
| Energy Fuels Inc. | 26.75 | 11.5 | 19.13 |
The consensus target for Cameco is slightly below its current price of 107.56 USD, indicating moderate upside potential. Energy Fuels’ consensus target of 19.13 USD is just above its current 18.16 USD, suggesting modest expected gains.
Analyst Opinions Comparison
This section compares analysts’ ratings and grades for Cameco Corporation and Energy Fuels Inc.:
Rating Comparison
CCJ Rating
- Rating: B, classified as Very Favorable by analysts.
- Discounted Cash Flow Score: 3, a Moderate indicator of valuation based on future cash flows.
- ROE Score: 4, Favorable, showing efficient profit generation from equity.
- ROA Score: 4, Favorable, reflecting effective asset utilization to generate earnings.
- Debt To Equity Score: 3, Moderate score indicating balanced financial risk.
- Overall Score: 3, Moderate, summarizing the company’s financial standing.
UUUU Rating
- Rating: D+, despite the label Very Favorable, indicating a weaker rating.
- Discounted Cash Flow Score: 1, Very Unfavorable, signaling poor valuation prospects.
- ROE Score: 1, Very Unfavorable, indicating low profitability from equity.
- ROA Score: 1, Very Unfavorable, showing poor asset efficiency.
- Debt To Equity Score: 1, Very Unfavorable, suggesting high financial risk.
- Overall Score: 1, Very Unfavorable, reflecting weak overall financial health.
Which one is the best rated?
Based strictly on the provided data, Cameco Corporation holds a better rating across all key financial metrics compared to Energy Fuels Inc., which scores very poorly on every category. Cameco’s moderate to favorable scores contrast sharply with Energy Fuels’ very unfavorable ratings.
Scores Comparison
The comparison of the scores for Cameco Corporation (CCJ) and Energy Fuels Inc. (UUUU) is as follows:
CCJ Scores
- Altman Z-Score: 10.76, indicating a safe zone status
- Piotroski Score: 8, reflecting very strong financial health
UUUU Scores
- Altman Z-Score: 40.34, indicating a safe zone status
- Piotroski Score: 1, reflecting very weak financial health
Which company has the best scores?
Both companies have Altman Z-Scores placing them in the safe zone, but CCJ has a very strong Piotroski Score of 8, while UUUU’s Piotroski Score is very weak at 1. This indicates stronger overall financial health for CCJ based on the provided data.
Grades Comparison
The following is a comparison of recent grades assigned by reputable grading companies for the two companies:
Cameco Corporation Grades
This table summarizes recent grades and recommendations for Cameco Corporation by leading grading firms.
| Grading Company | Action | New Grade | Date |
|---|---|---|---|
| RBC Capital | Maintain | Outperform | 2025-11-13 |
| RBC Capital | Maintain | Outperform | 2025-10-31 |
| Goldman Sachs | Maintain | Buy | 2025-10-29 |
| RBC Capital | Maintain | Outperform | 2025-08-01 |
| RBC Capital | Maintain | Outperform | 2025-06-20 |
| GLJ Research | Maintain | Buy | 2025-06-12 |
| Goldman Sachs | Maintain | Buy | 2025-06-11 |
| GLJ Research | Maintain | Buy | 2025-03-12 |
| RBC Capital | Maintain | Outperform | 2025-03-04 |
| Scotiabank | Maintain | Outperform | 2024-08-19 |
Cameco Corporation’s grades consistently reflect a positive outlook, with repeated “Buy” and “Outperform” ratings from multiple respected firms.
Energy Fuels Inc. Grades
This table summarizes recent grades and recommendations for Energy Fuels Inc. by leading grading firms.
| Grading Company | Action | New Grade | Date |
|---|---|---|---|
| HC Wainwright & Co. | Maintain | Buy | 2026-01-09 |
| Roth Capital | Downgrade | Sell | 2025-11-05 |
| HC Wainwright & Co. | Maintain | Buy | 2025-11-04 |
| HC Wainwright & Co. | Maintain | Buy | 2025-10-21 |
| B. Riley Securities | Maintain | Buy | 2025-10-08 |
| HC Wainwright & Co. | Maintain | Buy | 2025-09-17 |
| HC Wainwright & Co. | Maintain | Buy | 2025-08-08 |
| Canaccord Genuity | Maintain | Buy | 2025-07-02 |
| HC Wainwright & Co. | Maintain | Buy | 2025-05-09 |
| HC Wainwright & Co. | Maintain | Buy | 2025-02-28 |
Energy Fuels Inc. shows predominantly “Buy” ratings, though a notable downgrade to “Sell” by Roth Capital indicates some divergent views.
Which company has the best grades?
Cameco Corporation has received more consistent and higher grades, mainly “Outperform” and “Buy,” compared to Energy Fuels Inc., which, despite many “Buy” ratings, faced a recent “Sell” downgrade. This difference may influence investors seeking steadier consensus signals.
Strengths and Weaknesses
The table below summarizes the key strengths and weaknesses of Cameco Corporation (CCJ) and Energy Fuels Inc. (UUUU) based on their recent financial and strategic performance.
| Criterion | Cameco Corporation (CCJ) | Energy Fuels Inc. (UUUU) |
|---|---|---|
| Diversification | Moderate, focused on uranium mining | Limited, primarily uranium and related products |
| Profitability | Slightly unfavorable (ROIC below WACC but rising) | Unfavorable (ROIC well below WACC, losses) |
| Innovation | Moderate innovation pace, improving ROIC trend | Improving ROIC trend but still value-destroying |
| Global presence | Strong global footprint in uranium market | Smaller, more regional presence |
| Market Share | Significant player in uranium sector | Smaller market share, niche focus |
Key takeaways: Both companies are currently shedding value with ROIC below WACC, but show improving profitability trends. Cameco offers stronger global presence and market share, while Energy Fuels has a smaller, more focused operation with ongoing challenges in profitability. Investors should weigh growth potential against current value destruction.
Risk Analysis
Below is a comparative table highlighting key risks for Cameco Corporation (CCJ) and Energy Fuels Inc. (UUUU) based on the most recent data from 2024-2026.
| Metric | Cameco Corporation (CCJ) | Energy Fuels Inc. (UUUU) |
|---|---|---|
| Market Risk | Moderate (Beta 1.22), sensitive to uranium price fluctuations | High (Beta 1.85), volatile with uranium and energy markets |
| Debt Level | Low (Debt/Equity 0.2, favorable) | Very low debt (Debt/Equity 0.0, favorable) |
| Regulatory Risk | Moderate, operates in multiple regulated countries | High, US-focused with significant permitting challenges |
| Operational Risk | Moderate, diversified operations and segments | High, reliant on mining projects and mill operations |
| Environmental Risk | Moderate, uranium mining with environmental oversight | High, active uranium and vanadium extraction with environmental scrutiny |
| Geopolitical Risk | Medium, global sales with exposure to Americas, Europe, Asia | Medium-high, US-centric with regional political factors |
In synthesis, Energy Fuels Inc. faces higher overall risks, especially regulatory and operational, due to its concentrated US operations and project reliance. Cameco has a more diversified global footprint and stronger financial stability but remains exposed to market volatility in uranium prices and geopolitical shifts. Investors should closely monitor regulatory developments and uranium market trends as these pose the most impactful risks for both companies.
Which Stock to Choose?
Cameco Corporation (CCJ) shows a favorable income evolution with 74% revenue growth over five years and a positive net margin of 5.48%. Its financial ratios are slightly unfavorable overall, despite low debt levels and a solid current ratio. Profitability is modest, with ROE and ROIC below ideal levels, and the company is rated “B” with a very favorable overall rating.
Energy Fuels Inc. (UUUU) experiences mixed income results: strong revenue growth but negative net margins and returns. Its financial ratios are mostly unfavorable, though it benefits from very low debt and a favorable quick ratio. Profitability remains weak, with negative ROE and ROIC. The company holds a “D+” rating with a very favorable rating status but poor underlying scores.
Investors focused on stability and quality might find Cameco’s improving profitability and moderate risk profile more appealing, while those with a tolerance for volatility and seeking high growth potential could view Energy Fuels’ rapid revenue expansion and low debt as opportunities. The choice could depend on whether the investor prioritizes consistent returns or speculative growth potential.
Disclaimer: Investment carries a risk of loss of initial capital. The past performance is not a reliable indicator of future results. Be sure to understand risks before making an investment decision.
Go Further
I encourage you to read the complete analyses of Cameco Corporation and Energy Fuels Inc. to enhance your investment decisions: