In the dynamic uranium industry, Cameco Corporation (CCJ) and enCore Energy Corp. (EU) stand out as key players with distinct approaches. Cameco, a global uranium producer with integrated fuel services, contrasts with enCore, a focused uranium exploration and development company in the U.S. Their overlap in energy resource markets and innovation strategies makes this comparison compelling. Join me as we explore which company presents the most attractive opportunity for your investment portfolio.
Table of contents
Companies Overview
I will begin the comparison between Cameco Corporation and enCore Energy Corp. by providing an overview of these two companies and their main differences.
Cameco Corporation Overview
Cameco Corporation is a leading uranium producer operating through two segments: Uranium and Fuel Services. Its mission includes exploration, mining, refining, and sale of uranium concentrate and related fuel services, targeting nuclear utilities across the Americas, Europe, and Asia. Headquartered in Saskatoon, Canada, Cameco holds a significant market position with a market cap of 46.8B USD and 730 full-time employees.
enCore Energy Corp. Overview
enCore Energy Corp. focuses on acquiring, exploring, and developing uranium resource properties primarily in the United States. It holds extensive land positions across New Mexico, Utah, South Dakota, and Wyoming, emphasizing uranium resource development. With a market cap of 519M USD, enCore operates out of Corpus Christi, Texas, and targets growth through resource expansion rather than downstream fuel services.
Key similarities and differences
Both Cameco and enCore operate in the uranium industry within the energy sector, aiming to supply nuclear utilities. Cameco’s business model integrates mining and fuel services globally, while enCore concentrates on uranium resource acquisition and exploration in the U.S. Cameco’s larger scale and diversification contrast with enCore’s focused, land-based development approach, reflected in their market caps and operational scope.
Income Statement Comparison
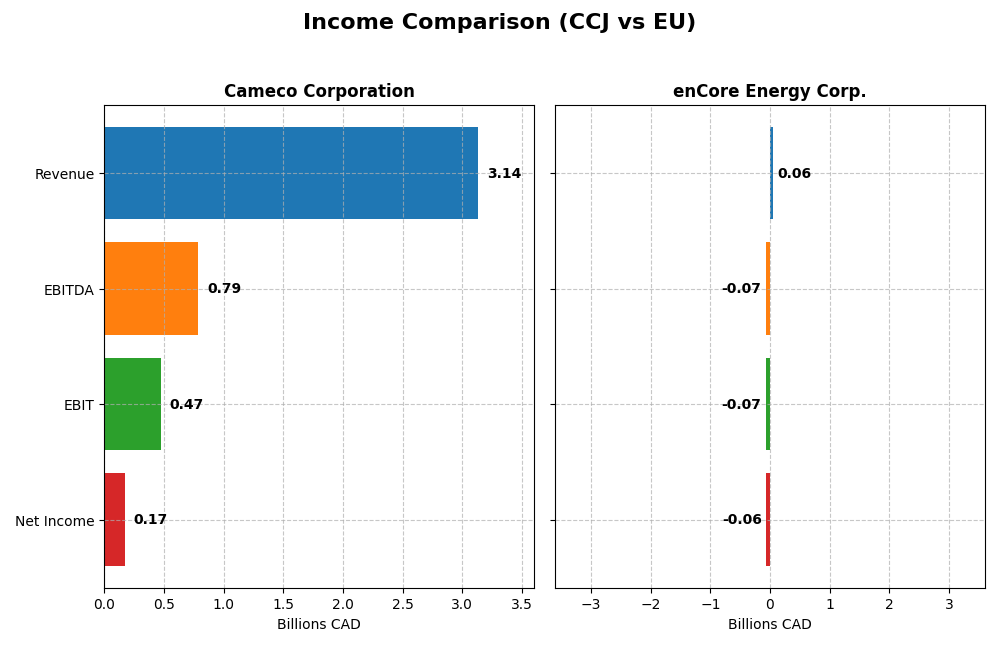
The following table presents a side-by-side comparison of key income statement metrics for Cameco Corporation and enCore Energy Corp. for the fiscal year 2024.
| Metric | Cameco Corporation (CCJ) | enCore Energy Corp. (EU) |
|---|---|---|
| Market Cap | 46.8B CAD | 519M USD |
| Revenue | 3.14B CAD | 58.3M USD |
| EBITDA | 789M CAD | -67.6M USD |
| EBIT | 475M CAD | -72.2M USD |
| Net Income | 172M CAD | -61.4M USD |
| EPS | 0.40 CAD | -0.34 USD |
| Fiscal Year | 2024 | 2024 |
Income Statement Interpretations
Cameco Corporation
Cameco has shown a strong upward trend in revenue, growing 74.2% from 2020 to 2024, with net income increasing by 423.22% over the same period. Margins remain generally favorable, with a 33.91% gross margin and a 5.48% net margin in 2024. However, the latest year saw a 21.18% revenue growth but a decline in EBIT and net margin, reflecting margin pressure despite top-line gains.
enCore Energy Corp.
enCore Energy exhibits mixed trends with revenue growing 163.38% year-over-year in 2024 but overall stagnation since 2020. The company posted negative gross and EBIT margins (-12.35% and -123.75%) in 2024, indicating persistent operational losses. Despite a slight improvement in net margin growth recently, net income remains deeply negative, reflecting ongoing challenges in profitability.
Which one has the stronger fundamentals?
Cameco Corporation displays stronger fundamentals with consistent revenue and net income growth, healthy margins, and a favorable overall income statement evaluation. In contrast, enCore Energy struggles with negative margins and declining net income over the period, leading to an unfavorable income statement assessment. Thus, Cameco’s financials suggest more robust operational performance compared to enCore.
Financial Ratios Comparison
The table below presents key financial ratios for Cameco Corporation (CCJ) and enCore Energy Corp. (EU) based on their most recent fiscal year data, providing a clear basis for comparative analysis.
| Ratios | Cameco Corporation (CCJ) | enCore Energy Corp. (EU) |
|---|---|---|
| ROE | 2.7% | -21.5% |
| ROIC | 3.8% | -17.3% |
| P/E | 187.0 | -10.1 |
| P/B | 5.05 | 2.17 |
| Current Ratio | 1.62 | 2.91 |
| Quick Ratio | 0.80 | 2.21 |
| D/E | 0.20 | 0.07 |
| Debt-to-Assets | 13.1% | 5.2% |
| Interest Coverage | 4.60 | -41.60 |
| Asset Turnover | 0.32 | 0.15 |
| Fixed Asset Turnover | 0.95 | 0.20 |
| Payout ratio | 40.5% | 0% |
| Dividend yield | 0.22% | 0% |
Interpretation of the Ratios
Cameco Corporation
Cameco shows a mixed ratio profile with favorable liquidity (current ratio 1.62) and low leverage (debt-to-equity 0.2), yet its profitability ratios like ROE (2.7%) and ROIC (3.79%) are weak and rated unfavorable. The company pays a dividend with a low yield (0.22%) and payout, which appears sustainable but limits shareholder returns given the modest earnings and high valuation multiples.
enCore Energy Corp.
enCore Energy displays generally unfavorable profitability metrics, including a negative net margin (-105.24%) and ROE (-21.49%), reflecting ongoing losses typical of exploration firms. Liquidity ratios are strong (current ratio 2.91, quick ratio 2.21), and leverage is low (debt-to-assets 5.2%). The company does not pay dividends, likely due to its reinvestment focus and negative earnings.
Which one has the best ratios?
Comparing both, Cameco’s ratios are slightly unfavorable overall but benefit from positive profitability and dividend payments, whereas enCore shows more pronounced unfavorable profitability and no dividend, reflecting higher risk. Liquidity and leverage favor enCore, but its losses and valuation suggest greater caution. The choice depends on investor risk tolerance and investment horizon.
Strategic Positioning
This section compares the strategic positioning of Cameco Corporation and enCore Energy Corp. across Market position, Key segments, and Exposure to technological disruption:
Cameco Corporation
- Leading uranium producer with established global sales and strong competitive pressure.
- Operates two segments: Uranium mining and Fuel Services, serving utilities in Americas, Europe, Asia.
- Limited exposure noted; operates in traditional uranium mining and fuel fabrication sectors.
enCore Energy Corp.
- Smaller uranium exploration company focused on U.S. resource acquisition, facing niche competition.
- Focused exclusively on uranium exploration and development in U.S. mining districts.
- Primarily engaged in exploration, with potential vulnerability to industry technological changes.
Cameco vs enCore Positioning
Cameco’s diversified operations span uranium production and fuel services globally, offering broader market reach but also facing complex competitive pressures. enCore concentrates on U.S. uranium exploration, with a focused but less diversified asset base, which may limit scale and geographical risk mitigation.
Which has the best competitive advantage?
Cameco shows a slightly unfavorable moat due to value destruction but an improving ROIC trend, indicating potential profitability growth. enCore exhibits a very unfavorable moat with declining profitability, suggesting weaker competitive advantage based on MOAT evaluation.
Stock Comparison
The stock price movements over the past year reveal a marked divergence in performance, with Cameco Corporation exhibiting strong upward momentum, while enCore Energy Corp. faced a significant decline amid shifting trading volumes.
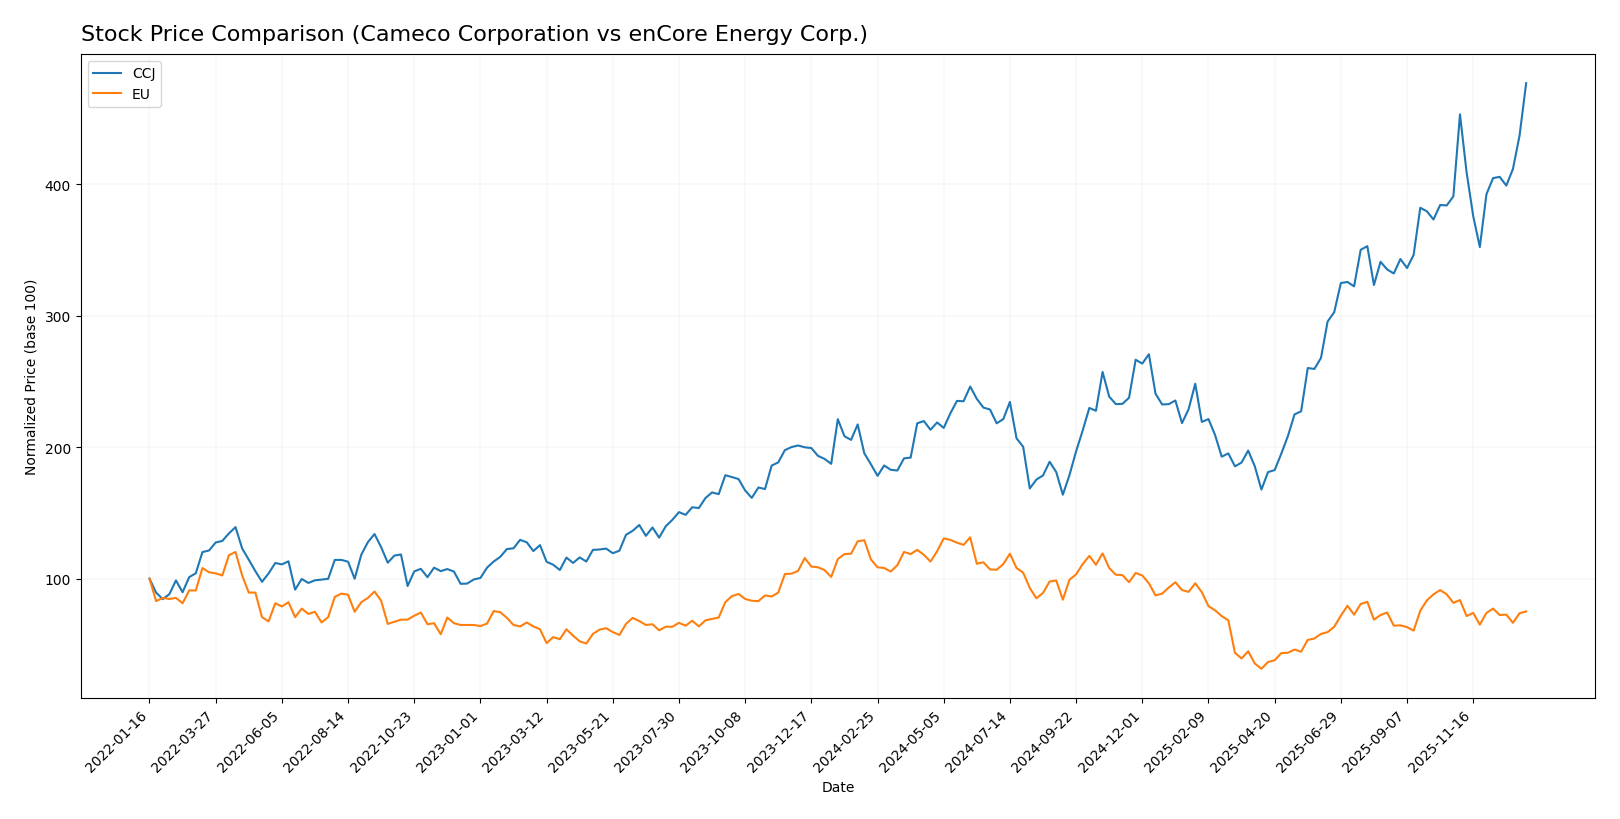
Trend Analysis
Cameco Corporation’s stock showed a bullish trend over the past 12 months, with a 155.0% price increase and accelerating momentum. The price ranged between 36.96 and 107.56, supported by notable volatility (std dev 17.73).
enCore Energy Corp. experienced a bearish trend over the same period, with a 34.52% price decrease and deceleration in decline. The price fluctuated between 1.16 and 4.85, with low volatility (std dev 0.92).
Comparing the two, Cameco Corporation delivered the highest market performance, outperforming enCore Energy Corp. by a substantial margin in price appreciation and trading strength.
Target Prices
Here is the current consensus on target prices from verified analysts for these uranium sector companies:
| Company | Target High | Target Low | Consensus |
|---|---|---|---|
| Cameco Corporation | 109 | 99.74 | 102.75 |
| enCore Energy Corp. | 3.5 | 3.5 | 3.5 |
Analysts expect Cameco’s price to hover slightly below its current 107.56 USD, indicating limited upside. enCore Energy’s consensus target of 3.5 USD significantly exceeds its current 2.77 USD, suggesting potential growth.
Analyst Opinions Comparison
This section compares analysts’ ratings and grades for Cameco Corporation and enCore Energy Corp.:
Rating Comparison
Cameco Corporation Rating
- Rating: B, considered Very Favorable by analysts
- Discounted Cash Flow Score: 3, Moderate status
- ROE Score: 4, Favorable
- ROA Score: 4, Favorable
- Debt To Equity Score: 3, Moderate
- Overall Score: 3, Moderate
enCore Energy Corp. Rating
- Rating: C-, also classified as Very Favorable
- Discounted Cash Flow Score: 1, Very Unfavorable
- ROE Score: 1, Very Unfavorable
- ROA Score: 1, Very Unfavorable
- Debt To Equity Score: 2, Moderate
- Overall Score: 1, Very Unfavorable
Which one is the best rated?
Based strictly on the data, Cameco Corporation holds a higher overall rating of B with stronger scores in ROE, ROA, and discounted cash flow compared to enCore Energy Corp., which has a lower C- rating and weaker financial scores.
Scores Comparison
The scores comparison for Cameco Corporation (CCJ) and enCore Energy Corp. (EU) is as follows:
CCJ Scores
- Altman Z-Score: 10.76, indicating a safe zone.
- Piotroski Score: 8, reflecting a very strong financial health.
EU Scores
- Altman Z-Score: 1.17, indicating a distress zone.
- Piotroski Score: 4, reflecting average financial health.
Which company has the best scores?
Based on the provided data, CCJ has significantly better scores than EU, showing strong financial health and a low bankruptcy risk, unlike EU, which is in financial distress with average strength.
Grades Comparison
The grades for Cameco Corporation and enCore Energy Corp. from reputable grading companies are as follows:
Cameco Corporation Grades
This table shows recent grades and actions from reliable grading companies for Cameco Corporation:
| Grading Company | Action | New Grade | Date |
|---|---|---|---|
| RBC Capital | Maintain | Outperform | 2025-11-13 |
| RBC Capital | Maintain | Outperform | 2025-10-31 |
| Goldman Sachs | Maintain | Buy | 2025-10-29 |
| RBC Capital | Maintain | Outperform | 2025-08-01 |
| RBC Capital | Maintain | Outperform | 2025-06-20 |
| GLJ Research | Maintain | Buy | 2025-06-12 |
| Goldman Sachs | Maintain | Buy | 2025-06-11 |
| GLJ Research | Maintain | Buy | 2025-03-12 |
| RBC Capital | Maintain | Outperform | 2025-03-04 |
| Scotiabank | Maintain | Outperform | 2024-08-19 |
Cameco’s grades consistently indicate a positive outlook with repeated “Outperform” and “Buy” ratings.
enCore Energy Corp. Grades
This table shows recent grades and actions from reliable grading companies for enCore Energy Corp.:
| Grading Company | Action | New Grade | Date |
|---|---|---|---|
| HC Wainwright & Co. | Maintain | Buy | 2025-08-12 |
| HC Wainwright & Co. | Maintain | Buy | 2025-05-13 |
| HC Wainwright & Co. | Maintain | Buy | 2025-03-18 |
| HC Wainwright & Co. | Maintain | Buy | 2024-11-19 |
| HC Wainwright & Co. | Maintain | Buy | 2024-10-07 |
| HC Wainwright & Co. | Maintain | Buy | 2024-08-15 |
| HC Wainwright & Co. | Maintain | Buy | 2024-06-14 |
| B. Riley Securities | Maintain | Buy | 2024-05-15 |
enCore Energy Corp. has maintained a consistent “Buy” rating across all recent grades from its grading companies.
Which company has the best grades?
Both companies have consistent positive grades, but Cameco Corporation’s mix of “Outperform” and “Buy” ratings from multiple well-known firms suggests a stronger and more diverse analyst endorsement than enCore Energy Corp.’s uniform “Buy” ratings from fewer firms. This could imply a more robust market confidence in Cameco’s prospects, potentially influencing investor sentiment accordingly.
Strengths and Weaknesses
Below is a comparison table summarizing the key strengths and weaknesses of Cameco Corporation (CCJ) and enCore Energy Corp. (EU) based on recent financial and strategic data.
| Criterion | Cameco Corporation (CCJ) | enCore Energy Corp. (EU) |
|---|---|---|
| Diversification | Moderate; focused on uranium mining | Limited; primarily uranium exploration |
| Profitability | Slightly profitable; neutral net margin (5.48%), unfavorable ROE (2.7%) and ROIC (3.79%) | Unprofitable; negative net margin (-105.24%), ROE (-21.49%), and ROIC (-17.34%) |
| Innovation | Moderate; stable operations but limited breakthrough innovation | Low; struggling with declining profitability and no clear innovation driver |
| Global presence | Established global footprint in uranium markets | Small, regional presence with limited market reach |
| Market Share | Significant in uranium supply market | Minor player in the uranium sector |
Key takeaways: Cameco shows modest profitability and a growing ROIC trend, indicating improving operational efficiency despite some value destruction. enCore Energy struggles with declining profitability and value destruction, reflecting higher risk and weaker competitive positioning. Investors should weigh Cameco’s more stable profile against enCore’s higher risk-reward potential.
Risk Analysis
Below is a comparative table highlighting key risks for Cameco Corporation (CCJ) and enCore Energy Corp. (EU) based on the latest available data from 2024 and market conditions in 2026.
| Metric | Cameco Corporation (CCJ) | enCore Energy Corp. (EU) |
|---|---|---|
| Market Risk | Moderate beta at 1.22, exposed to uranium price volatility | Higher beta at 1.44, more volatile, small market cap 519M USD |
| Debt level | Low debt-to-equity 0.2, favorable leverage | Very low debt-to-equity 0.07, low financial risk |
| Regulatory Risk | High, due to nuclear industry regulations in multiple regions | High, uranium mining and US-specific environmental regulations |
| Operational Risk | Moderate, large-scale mining and fuel services operations | High, exploration and development phase with operational uncertainties |
| Environmental Risk | Elevated, uranium mining impacts and nuclear fuel production | Elevated, mining projects with potential environmental liabilities |
| Geopolitical Risk | Significant, operations across Americas, Europe, Asia | Moderate, focused on US projects but uranium market sensitive to global policies |
In synthesis, Cameco faces moderate market and operational risks but benefits from strong financial stability and a safe Altman Z-score, indicating low bankruptcy risk. enCore Energy carries higher market and operational risks due to its smaller size, exploration stage, and financial distress signals from its Altman Z-score in the distress zone. Regulatory and environmental risks are significant for both, reflecting the uranium sector’s sensitivity. Investors should carefully weigh enCore’s growth potential against its higher risk profile, while Cameco offers more stability but at a higher valuation.
Which Stock to Choose?
Cameco Corporation (CCJ) shows a favorable income evolution with 74.2% revenue growth over five years and a 5.48% net margin, despite some recent declines in profitability. Its financial ratios are slightly unfavorable overall, but it maintains low debt levels and a solid current ratio, supported by a very favorable B rating.
enCore Energy Corp. (EU) presents an unfavorable income statement profile, with negative margins and shrinking profitability over the period. While some liquidity ratios and debt metrics appear favorable, its global financial ratios and ratings are largely unfavorable, reflecting operational challenges and a very unfavorable C- rating.
For investors, CCJ might appear more suitable for those prioritizing stability and improving profitability, given its stronger income statement and moderate rating. EU could be seen as fitting for risk-tolerant profiles seeking potential turnaround opportunities, despite its unfavorable financial health and bearish price trend.
Disclaimer: Investment carries a risk of loss of initial capital. The past performance is not a reliable indicator of future results. Be sure to understand risks before making an investment decision.
Go Further
I encourage you to read the complete analyses of Cameco Corporation and enCore Energy Corp. to enhance your investment decisions: