Investors seeking exposure to the uranium sector often consider Cameco Corporation and Denison Mines Corp., two prominent Canadian energy companies. Both operate in uranium exploration and production, yet differ in scale, innovation focus, and market positioning. This comparison highlights their strategic strengths and risks, helping you identify which company aligns best with your investment goals. Let’s explore which uranium player stands out as the more compelling investment opportunity.
Table of contents
Companies Overview
I will begin the comparison between Cameco Corporation and Denison Mines Corp. by providing an overview of these two companies and their main differences.
Cameco Overview
Cameco Corporation is a major player in the uranium industry, focusing on producing and selling uranium and fuel services. The company operates through two segments: Uranium, which covers exploration, mining, and milling, and Fuel Services, involving refining, conversion, and fabrication of uranium products. Headquartered in Saskatoon, Canada, Cameco serves nuclear utilities across the Americas, Europe, and Asia, positioning itself as a global energy sector contributor.
Denison Mines Overview
Denison Mines Corp. is engaged primarily in the acquisition, exploration, development, and processing of uranium properties in Canada. Its key asset is the Wheeler River uranium project, where it holds a 95% interest. Founded in 1997 and based in Toronto, Canada, Denison focuses on advancing its uranium mining operations within the Athabasca Basin region, emphasizing growth and development in the Canadian uranium market.
Key similarities and differences
Both Cameco and Denison operate in the uranium industry within the energy sector and are headquartered in Canada. Cameco has a more diversified business model, including uranium production and fuel services globally, whereas Denison is more concentrated on exploration and development of uranium properties in Canada. Additionally, Cameco employs significantly more staff and holds a larger market capitalization, reflecting its broader operational scale and market reach.
Income Statement Comparison
The following table presents a side-by-side comparison of key income statement metrics for Cameco Corporation and Denison Mines Corp. for the fiscal year 2024.
| Metric | Cameco Corporation (CCJ) | Denison Mines Corp. (DNN) |
|---|---|---|
| Market Cap | 46.8B CAD | 3.0B CAD |
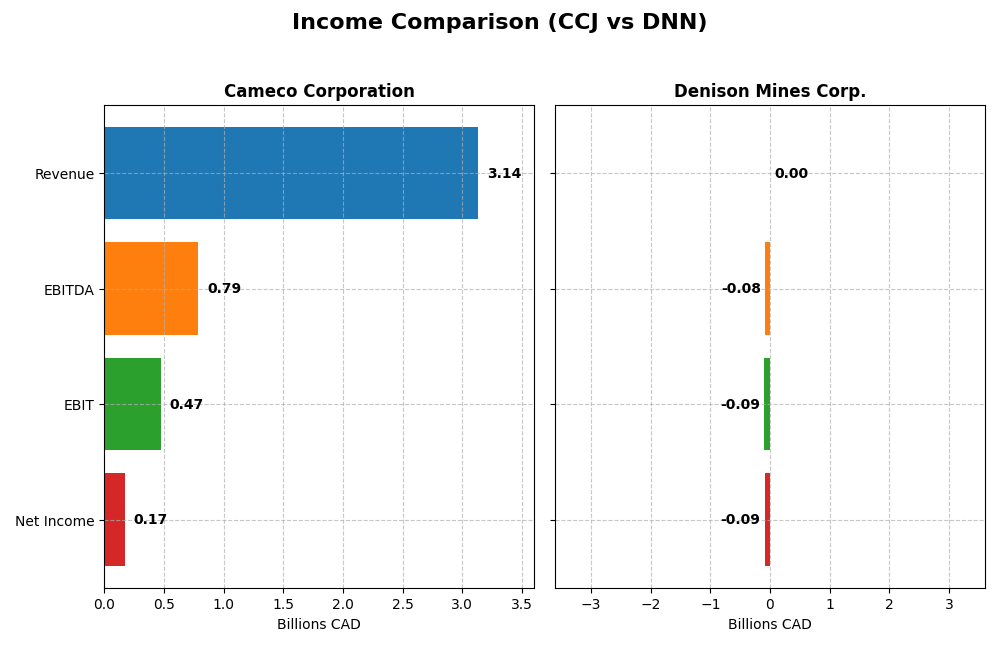
| Revenue | 3.14B CAD | 4.0M CAD |
| EBITDA | 789M CAD | -81.8M CAD |
| EBIT | 475M CAD | -91.7M CAD |
| Net Income | 172M CAD | -91.1M CAD |
| EPS | 0.40 CAD | -0.10 CAD |
| Fiscal Year | 2024 | 2024 |
Income Statement Interpretations
Cameco Corporation
Cameco’s revenue grew steadily from CAD 1.47B in 2021 to CAD 3.14B in 2024, with net income recovering from a loss of CAD -103M in 2021 to a gain of CAD 172M in 2024. Gross and net margins improved markedly over the period, reaching 33.91% and 5.48% in 2024 respectively. The latest year showed strong revenue growth (+21.18%) but a decline in EBIT and net margin, signaling margin pressure despite higher top-line gains.
Denison Mines Corp.
Denison Mines experienced volatile revenue, peaking at CAD 20M in 2021 before dropping to CAD 4M in 2024, with net income swinging from CAD 19M profit in 2021 to a loss of CAD -91M in 2024. Margins deteriorated significantly, with negative gross and EBIT margins in 2024 reflecting operational challenges. Although revenue grew sharply year-over-year (+116.87%), profitability metrics worsened, indicating cost and expense issues impacting bottom-line results.
Which one has the stronger fundamentals?
Cameco demonstrates stronger fundamentals with consistent revenue growth, improving margins, and overall positive income trends despite recent margin contraction. In contrast, Denison shows declining revenue over the longer term, persistent losses, and unfavorable margin profiles. The favorable evaluations for Cameco’s income statement contrast sharply with Denison’s predominantly unfavorable metrics, underscoring Cameco’s more stable financial position.
Financial Ratios Comparison
The table below presents a side-by-side comparison of key financial ratios for Cameco Corporation (CCJ) and Denison Mines Corp. (DNN) based on their latest fiscal year data for 2024.
| Ratios | Cameco Corporation (CCJ) | Denison Mines Corp. (DNN) |
|---|---|---|
| ROE | 2.7% | -16.1% |
| ROIC | 3.8% | -10.0% |
| P/E | 187.0 | -25.3 |
| P/B | 5.05 | 4.09 |
| Current Ratio | 1.62 | 3.65 |
| Quick Ratio | 0.80 | 3.54 |
| D/E (Debt-to-Equity Ratio) | 0.20 | 0 |
| Debt-to-Assets | 13.1% | 0% |
| Interest Coverage | 4.60 | -586.3 |
| Asset Turnover | 0.32 | 0.006 |
| Fixed Asset Turnover | 0.95 | 0.015 |
| Payout Ratio | 40.5% | 0% |
| Dividend Yield | 0.22% | 0% |
Interpretation of the Ratios
Cameco Corporation
Cameco’s ratios present a mixed picture with a strong current ratio of 1.62 and low debt-to-equity at 0.2, indicating solid liquidity and conservative leverage. However, profitability metrics like ROE (2.7%) and ROIC (3.79%) are unfavorable, alongside a high P/E of 187.01, suggesting expensive valuation. Dividend yield is low at 0.22%, implying modest shareholder returns.
Denison Mines Corp.
Denison Mines shows predominantly weak ratios with negative net margin (-2264.95%) and ROE (-16.15%), reflecting operational challenges. Its zero debt level and favorable quick ratio of 3.54 indicate financial stability, but poor asset turnover and negative interest coverage raise concerns. The company pays no dividends, likely focusing on reinvestment and growth.
Which one has the best ratios?
Cameco Corporation exhibits more favorable liquidity and leverage metrics, though profitability and valuation remain concerns. Denison Mines faces significant profitability and operational weaknesses despite strong liquidity and zero debt. Overall, Cameco’s ratios appear slightly less unfavorable compared to Denison Mines’ predominantly adverse ratio profile.
Strategic Positioning
This section compares the strategic positioning of Cameco Corporation and Denison Mines Corp., including market position, key segments, and exposure to disruption:
Cameco Corporation
- Leading uranium producer with diversified operations in mining and fuel services facing moderate competitive pressure.
- Operates two segments: Uranium mining and Fuel Services including refining and fuel fabrication for CANDU reactors.
- Limited exposure to technological disruption; operates in traditional uranium mining and fuel fabrication sectors.
Denison Mines Corp.
- Smaller uranium exploration and development firm focused on Canadian properties, facing higher competition pressure.
- Concentrated on uranium acquisition, exploration, and development with flagship Wheeler River project in Athabasca Basin.
- Limited exposure to technological disruption; focused on traditional uranium property development and mining.
Cameco Corporation vs Denison Mines Corp. Positioning
Cameco maintains a diversified business model spanning uranium mining and fuel services, offering multiple revenue streams. Denison concentrates solely on uranium exploration and development in Canada, which narrows its business scope but focuses on a key growth project. Each approach presents distinct operational scopes and risk profiles.
Which has the best competitive advantage?
Cameco shows slightly unfavorable MOAT status with growing profitability despite value destruction, indicating some competitive resilience. Denison’s unfavorable MOAT and stable but value-destroying profitability suggest a weaker competitive advantage.
Stock Comparison
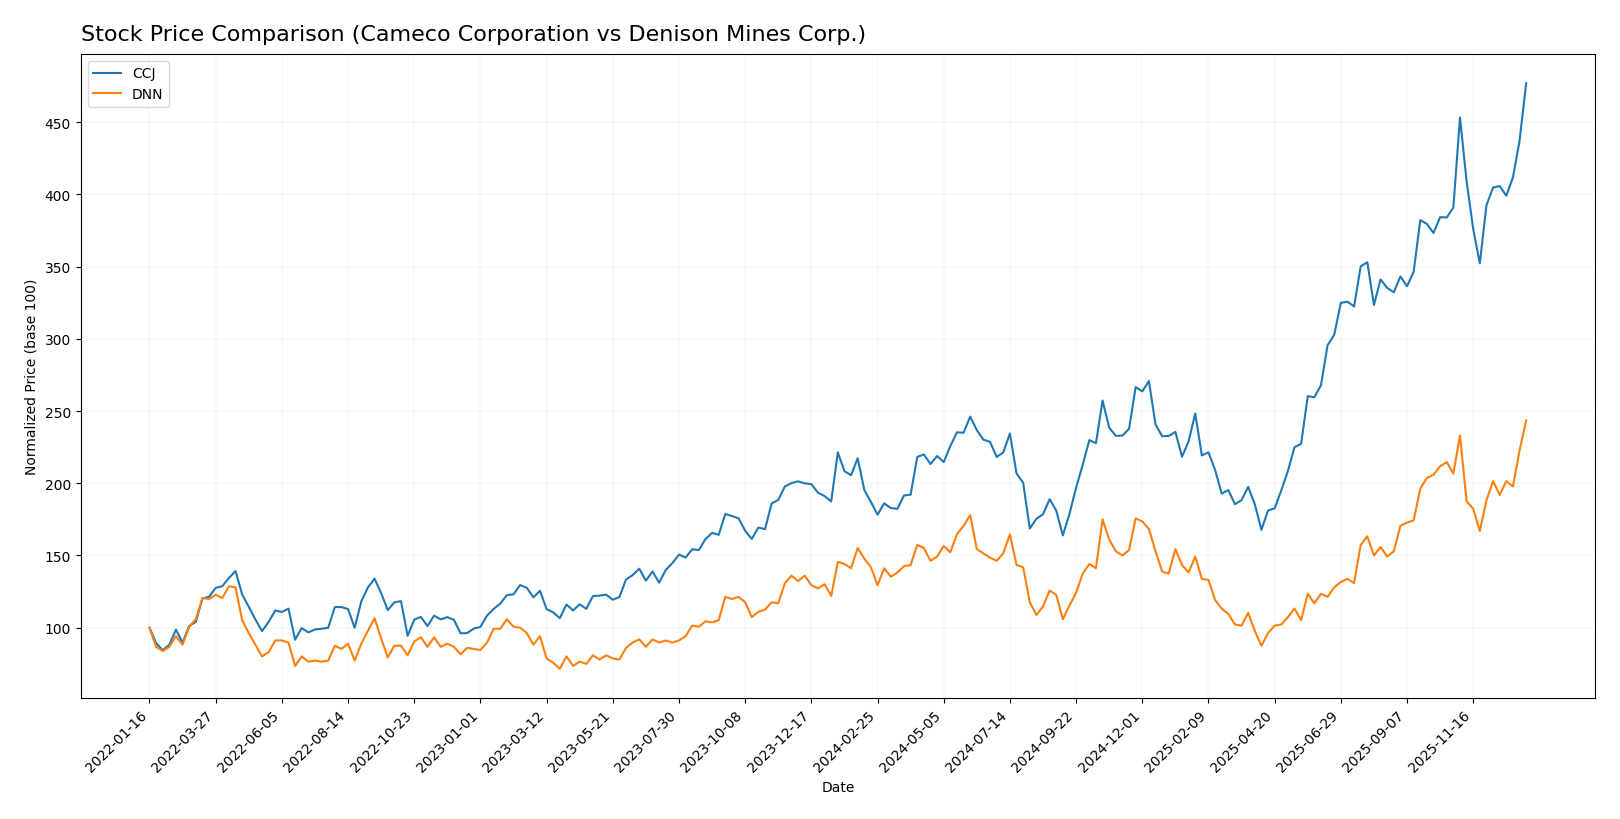
The stock price movements of Cameco Corporation (CCJ) and Denison Mines Corp. (DNN) over the past year reveal significant bullish trends with notable acceleration phases and varying trading dynamics.
Trend Analysis
Cameco Corporation’s stock gained 155.0% over the past year, showing a strong bullish trend with acceleration and high volatility (std deviation 17.73). Prices ranged from 36.96 to 107.56, with recent gains of 22.05%.
Denison Mines Corp.’s stock rose 71.5% over the same period, also bullish with acceleration but much lower volatility (std deviation 0.44). The price moved between 1.19 and 3.31, with recent gains of 17.79%.
Comparing trends, Cameco delivered higher market performance with stronger price appreciation and volatility, while Denison showed steadier but smaller gains.
Target Prices
The current analyst consensus presents clear target prices for Cameco Corporation and Denison Mines Corp.
| Company | Target High | Target Low | Consensus |
|---|---|---|---|
| Cameco Corporation | 109 | 99.74 | 102.75 |
| Denison Mines Corp. | 2.6 | 2.6 | 2.6 |
Analysts expect Cameco’s price to stay near its current level of $107.56, with moderate upside potential. Denison Mines’ consensus target of $2.6 is significantly below its current price of $3.31, indicating potential downside risks.
Analyst Opinions Comparison
This section compares analysts’ ratings and grades for Cameco Corporation and Denison Mines Corp.:
Rating Comparison
CCJ Rating
- Rating: B, considered very favorable by analysts.
- Discounted Cash Flow Score: Moderate at 3, indicating fair valuation.
- ROE Score: Favorable at 4, showing efficient profit generation.
- ROA Score: Favorable at 4, reflects effective asset utilization.
- Debt To Equity Score: Moderate at 3, balanced financial risk.
- Overall Score: Moderate at 3, reflecting solid but not top-tier performance.
DNN Rating
- Rating: C-, also noted as very favorable despite lower grade.
- Discounted Cash Flow Score: Moderate at 3, similar valuation level.
- ROE Score: Very unfavorable at 1, indicating weak equity returns.
- ROA Score: Very unfavorable at 1, showing poor asset use.
- Debt To Equity Score: Very unfavorable at 1, higher financial risk.
- Overall Score: Very unfavorable at 1, indicating weaker overall standing.
Which one is the best rated?
Based strictly on the provided data, Cameco Corporation (CCJ) is better rated overall, with higher scores in ROE, ROA, debt management, and overall performance compared to Denison Mines Corp. (DNN), which shows very unfavorable scores in most categories.
Scores Comparison
Here is a comparison of the scores for Cameco Corporation (CCJ) and Denison Mines Corp. (DNN):
CCJ Scores
- Altman Z-Score: 10.76, indicating a safe zone with low bankruptcy risk.
- Piotroski Score: 8, classified as very strong financial health.
DNN Scores
- Altman Z-Score: 0.73, indicating distress zone with high bankruptcy risk.
- Piotroski Score: 4, classified as average financial health.
Which company has the best scores?
Based strictly on the provided data, CCJ has significantly stronger scores than DNN, with a very safe Altman Z-Score and a very strong Piotroski Score compared to DNN’s distress zone and average Piotroski results.
Grades Comparison
Here is a detailed comparison of the recent stock grades from recognized financial institutions for both companies:
Cameco Corporation Grades
The table below summarizes the latest grades and recommendations from reliable grading companies for Cameco Corporation:
| Grading Company | Action | New Grade | Date |
|---|---|---|---|
| RBC Capital | Maintain | Outperform | 2025-11-13 |
| RBC Capital | Maintain | Outperform | 2025-10-31 |
| Goldman Sachs | Maintain | Buy | 2025-10-29 |
| RBC Capital | Maintain | Outperform | 2025-08-01 |
| RBC Capital | Maintain | Outperform | 2025-06-20 |
| GLJ Research | Maintain | Buy | 2025-06-12 |
| Goldman Sachs | Maintain | Buy | 2025-06-11 |
| GLJ Research | Maintain | Buy | 2025-03-12 |
| RBC Capital | Maintain | Outperform | 2025-03-04 |
| Scotiabank | Maintain | Outperform | 2024-08-19 |
Cameco Corporation consistently receives “Outperform” and “Buy” grades, indicating a positive and stable outlook from top-tier firms.
Denison Mines Corp. Grades
The table below presents the recent grades and recommendations from recognized grading companies for Denison Mines Corp.:
| Grading Company | Action | New Grade | Date |
|---|---|---|---|
| Roth MKM | Maintain | Buy | 2024-10-23 |
| TD Securities | Maintain | Speculative Buy | 2023-06-27 |
| Raymond James | Maintain | Outperform | 2023-06-27 |
| TD Securities | Maintain | Speculative Buy | 2023-06-26 |
| Raymond James | Maintain | Outperform | 2023-06-26 |
| Credit Suisse | Downgrade | Underperform | 2017-07-18 |
| Credit Suisse | Downgrade | Underperform | 2017-07-17 |
| Roth Capital | Maintain | Buy | 2016-02-10 |
| Credit Suisse | Upgrade | Neutral | 2014-04-01 |
| Credit Suisse | Upgrade | Neutral | 2014-03-31 |
Denison Mines exhibits a more mixed history with recent “Buy,” “Speculative Buy,” and “Outperform” grades, but older downgrades reflect past volatility.
Which company has the best grades?
Cameco Corporation has consistently received stronger and more recent grades, predominantly “Outperform” and “Buy,” compared to Denison Mines Corp., which has a mixed record including speculative and underperform ratings. This suggests a more stable analyst confidence in Cameco, which could influence investor perception and portfolio risk management.
Strengths and Weaknesses
The table below compares Cameco Corporation (CCJ) and Denison Mines Corp. (DNN) across key investment criteria based on the latest financial data and moat evaluation.
| Criterion | Cameco Corporation (CCJ) | Denison Mines Corp. (DNN) |
|---|---|---|
| Diversification | Moderate, focused on uranium mining | Narrow, primarily uranium exploration |
| Profitability | Slightly unfavorable; ROIC 3.79% below WACC 9.46% | Unfavorable; negative ROIC and net margin |
| Innovation | Moderate investment in operational improvements | Limited innovation; focused on resource development |
| Global presence | Strong presence, serving multiple international markets | Limited global footprint, mainly North America |
| Market Share | Significant uranium market share | Small market share, emerging player |
Key takeaways: Cameco shows improving profitability with a growing ROIC trend despite current value shedding, supported by a strong global presence and market share. Denison struggles with profitability and value creation, reflecting its smaller scale and limited diversification. Investors should weigh the growth potential against current financial challenges and risk exposure.
Risk Analysis
Below is a comparative overview of key risks for Cameco Corporation (CCJ) and Denison Mines Corp. (DNN) based on the most recent 2024 data.
| Metric | Cameco Corporation (CCJ) | Denison Mines Corp. (DNN) |
|---|---|---|
| Market Risk | Beta 1.22; moderate volatility | Beta 1.89; higher volatility |
| Debt level | Low debt-to-equity 0.2; favorable | No debt; very favorable |
| Regulatory Risk | Moderate; uranium industry regulation | High; exploration stage regulatory uncertainties |
| Operational Risk | Established operations; moderate asset turnover | Early-stage project; low asset turnover |
| Environmental Risk | Uranium mining impact; managed compliance | Exploration impacts; risk from project development |
| Geopolitical Risk | Exposure to North America, Europe, Asia | Primarily Canadian operations; lower geopolitical risk |
The most impactful risks lie in market volatility and regulatory environment. DNN’s high beta and distress zone Altman Z-score (0.73) signal significant financial instability, while CCJ’s moderate beta and safe zone Z-score (10.76) reflect stronger stability. Regulatory and operational risks remain key for uranium miners due to industry sensitivity and project stages.
Which Stock to Choose?
Cameco Corporation (CCJ) shows a favorable income statement with strong revenue and net income growth over 2020-2024, despite some recent margin declines. Its financial ratios are slightly unfavorable overall, with low ROE and ROIC but solid liquidity and moderate debt. The company’s rating is very favorable (B), supported by strong Altman Z and Piotroski scores, indicating financial stability.
Denison Mines Corp. (DNN) displays an unfavorable income statement, with negative margins and declining net income over the period, despite recent revenue growth. Its financial ratios are mostly unfavorable, including negative returns and weak asset turnover, though it carries no debt. The rating is very favorable (C-), but its Altman Z score signals distress and a moderate Piotroski score reflects average financial health.
Investors focused on stability and financial strength might find Cameco’s profile more favorable given its stronger income trends and solid credit metrics, while those with higher risk tolerance seeking potential turnaround plays could see Denison as a speculative option due to its current challenges and valuation. The ultimate choice could depend on the investor’s risk appetite and investment strategy.
Disclaimer: Investment carries a risk of loss of initial capital. The past performance is not a reliable indicator of future results. Be sure to understand risks before making an investment decision.
Go Further
I encourage you to read the complete analyses of Cameco Corporation and Denison Mines Corp. to enhance your investment decisions: