Home > Comparison > Real Estate > UDR vs CPT
The strategic rivalry between UDR, Inc. and Camden Property Trust shapes the U.S. multifamily residential REIT landscape. UDR operates as a focused, large-scale residential REIT emphasizing targeted market development, while Camden blends expansive property management with steady portfolio growth. Their contest centers on balancing operational scale against portfolio diversification. This analysis aims to uncover which company’s strategy delivers superior risk-adjusted returns for a diversified real estate portfolio.

Table of contents
Companies Overview
UDR and Camden Property Trust both command significant presence in the U.S. residential REIT market, shaping multifamily housing trends.
UDR, Inc.: Multifamily REIT Pioneer
UDR stands as a leading multifamily real estate investment trust focused on managing, buying, selling, and developing apartment communities. Its core revenue stems from rental income generated by 51,649 apartment homes, including 1,031 under development. In 2026, UDR emphasizes portfolio optimization and redevelopment in targeted U.S. markets to deliver consistent shareholder returns.
Camden Property Trust: Growth-Oriented Residential REIT
Camden Property Trust operates as a major multifamily real estate owner and manager with 167 properties and 56,850 apartment homes under management. Its revenue engine is rental income supplemented by development and acquisition activities. In 2026, Camden concentrates on expanding its footprint via seven properties in development, aiming to reach 59,104 homes, while maintaining a strong workplace culture.
Strategic Collision: Similarities & Divergences
Both companies compete fiercely in the residential REIT space, relying on multifamily rental income and development as growth drivers. UDR prioritizes selective redevelopment and portfolio efficiency, while Camden pursues aggressive expansion and employee-centric branding. Their distinct strategies create divergent risk-return profiles: UDR offers steady, optimized cash flows; Camden presents growth potential balanced by development execution risk.
Income Statement Comparison
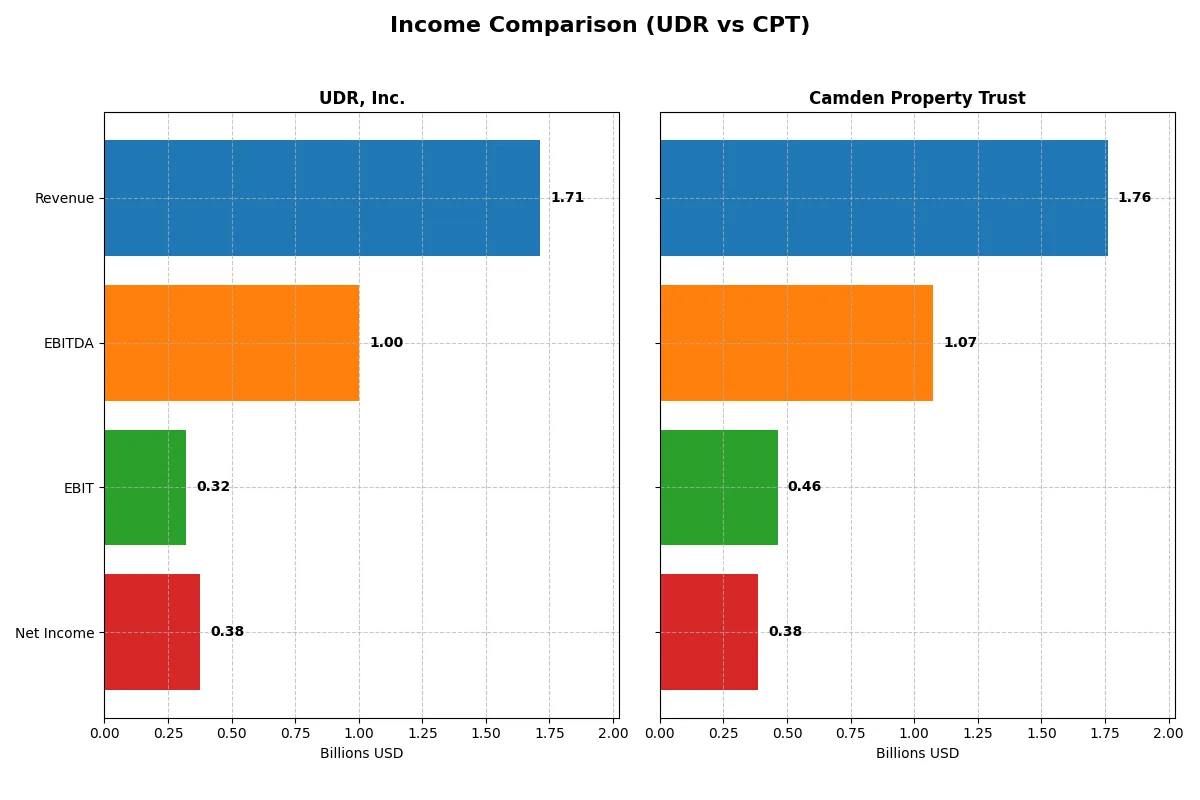
The following data dissects the core profitability and scalability of both corporate engines to reveal who dominates the bottom line:
| Metric | UDR, Inc. (UDR) | Camden Property Trust (CPT) |
|---|---|---|
| Revenue | 1.71B | 1.76B |
| Cost of Revenue | 1.27B | 1.22B |
| Operating Expenses | 116M | 79M |
| Gross Profit | 438M | 542M |
| EBITDA | 1.00B | 1.07B |
| EBIT | 322M | 463M |
| Interest Expense | 0 | 0 |
| Net Income | 378M | 384M |
| EPS | 1.13 | 3.54 |
| Fiscal Year | 2025 | 2025 |
Income Statement Analysis: The Bottom-Line Duel
This income statement comparison reveals which company operates with greater efficiency and profitability in their core business.
UDR, Inc. Analysis
UDR grew revenue steadily from 1.29B in 2021 to 1.71B in 2025, with net income surging from 150M to 378M. Gross and net margins remain healthy at 25.6% and 22.1%, respectively. In 2025, UDR improved net margin sharply, reflecting superior cost control and operational momentum amid stable revenue growth.
Camden Property Trust Analysis
Camden Property Trust’s revenue climbed robustly from 1.14B in 2021 to 1.76B in 2025, with net income rising more modestly from 304M to 384M. Its gross margin of 30.8% and EBIT margin of 26.3% indicate strong profitability. The 2025 jump in EBIT and net margin shows effective operating leverage despite a recent dip in gross profit growth.
Margin Efficiency vs. Revenue Expansion
UDR and Camden both deliver solid profitability, but UDR leads in net income growth (152% vs. 27%) and margin improvement over five years. Camden’s higher revenue growth (54% vs. 33%) contrasts with its less consistent margin expansion. Investors seeking margin resilience may favor UDR’s efficient earnings profile, while those prioritizing top-line scale might lean toward Camden.
Financial Ratios Comparison
These vital ratios act as a diagnostic tool to expose the underlying fiscal health, valuation premiums, and capital efficiency for each company:
| Ratios | UDR, Inc. (UDR) | Camden Property Trust (CPT) |
|---|---|---|
| ROE | 11.49% | 8.81% |
| ROIC | 29.38% | 4.54% |
| P/E | 32.08 | 31.03 |
| P/B | 3.68 | 2.73 |
| Current Ratio | 3.31 | 55.52 |
| Quick Ratio | 3.31 | 55.52 |
| D/E | 1.88 | 0.89 |
| Debt-to-Assets | 58.34% | 43.14% |
| Interest Coverage | 0 | 0 |
| Asset Turnover | 0.16 | 0.19 |
| Fixed Asset Turnover | 9.13 | 0 |
| Payout ratio | 149.99% | 118.39% |
| Dividend yield | 4.68% | 3.82% |
| Fiscal Year | 2025 | 2025 |
Efficiency & Valuation Duel: The Vital Signs
Ratios form a company’s financial DNA, exposing hidden risks and revealing operational excellence critical for investor insight.
UDR, Inc.
UDR posts a solid 11.5% ROE and a strong 22.1% net margin, signaling efficient profitability. However, its P/E of 32.1 suggests a stretched valuation compared to peers. The company supports shareholders with a healthy 4.7% dividend yield, reflecting disciplined capital allocation despite some leverage and liquidity concerns.
Camden Property Trust
Camden Property Trust shows a lower 8.8% ROE and a similar 21.8% net margin, but its 31.0 P/E also appears stretched. Debt metrics remain moderate with a debt-to-equity of 0.89. Camden returns value via a 3.8% dividend yield, balancing modest profitability with stable cash generation and manageable leverage.
Valuation Stretch vs. Profitability Efficiency
UDR offers higher profitability and a superior return on invested capital, but trades at a premium with elevated leverage. Camden provides a safer leverage profile and steady dividends, though with weaker operational returns. Investors seeking yield with moderate risk may prefer Camden’s profile, while those targeting profitability might lean toward UDR.
Which one offers the Superior Shareholder Reward?
I compare UDR, Inc. and Camden Property Trust’s shareholder rewards by examining dividends, payout ratios, and buybacks. UDR’s 4.7% yield comes with a high 150% payout ratio, signaling risk. Camden yields 3.8% with a 118% payout ratio, supported by robust free cash flow and consistent buybacks. Camden’s distribution strikes a better balance between income and sustainability. I conclude Camden Property Trust offers a more attractive total return profile for 2026 investors, with stronger margin stability and disciplined capital allocation enhancing long-term value.
Comparative Score Analysis: The Strategic Profile
The radar chart reveals the fundamental DNA and trade-offs of UDR, Inc. and Camden Property Trust, highlighting their strategic strengths and vulnerabilities:
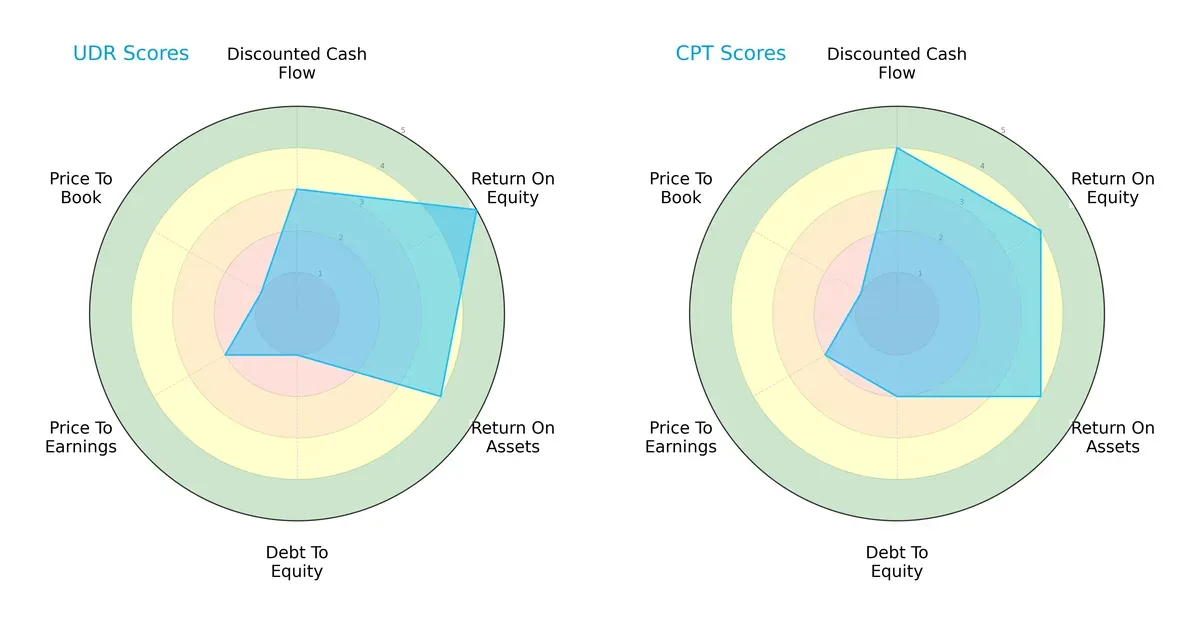
UDR excels in return on equity (5) and return on assets (4), showing strong operational efficiency. Camden edges ahead in discounted cash flow (4) and maintains a slightly better debt-to-equity score (2) than UDR’s weak 1. Both share moderate overall scores (3) and unfavorable valuation metrics (PE at 2, PB at 1). Camden offers a more balanced profile, while UDR relies heavily on superior profitability but carries higher leverage risk.
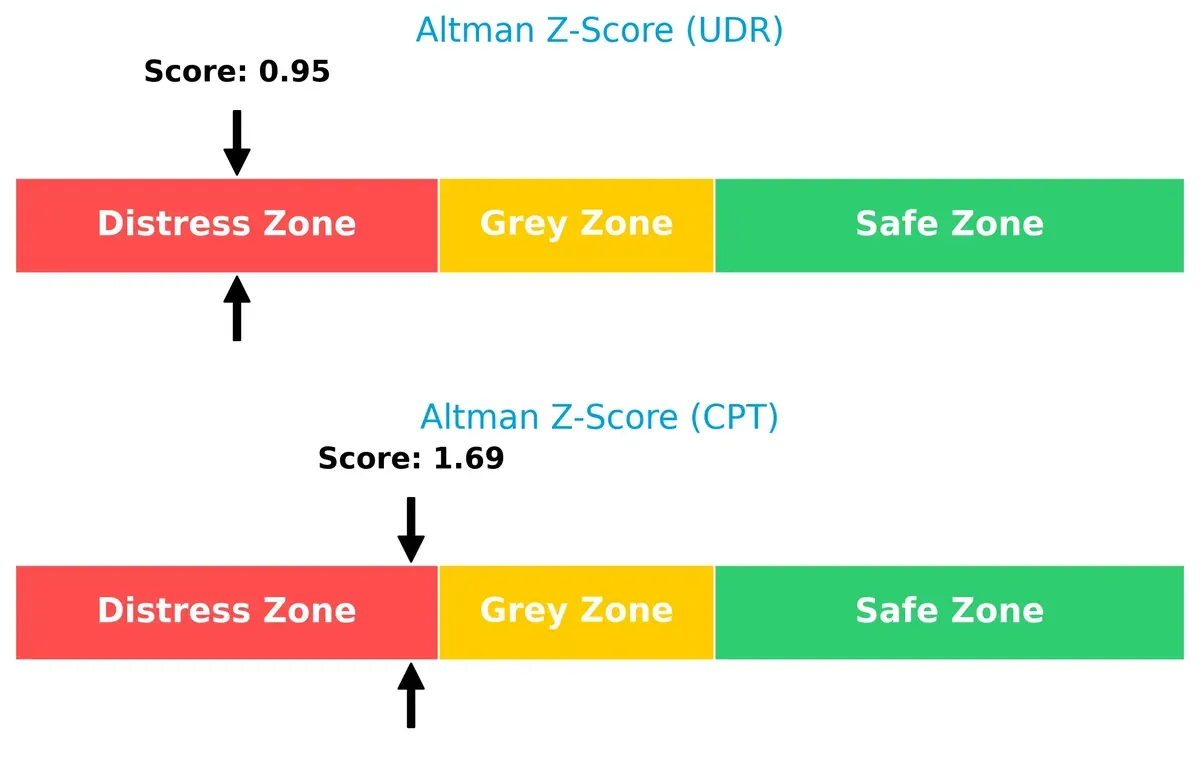
Bankruptcy Risk: Solvency Showdown
The Altman Z-Score gap between UDR (0.95) and Camden (1.69) signals critical distress risks for both, with UDR facing a notably greater threat of insolvency in this cycle:
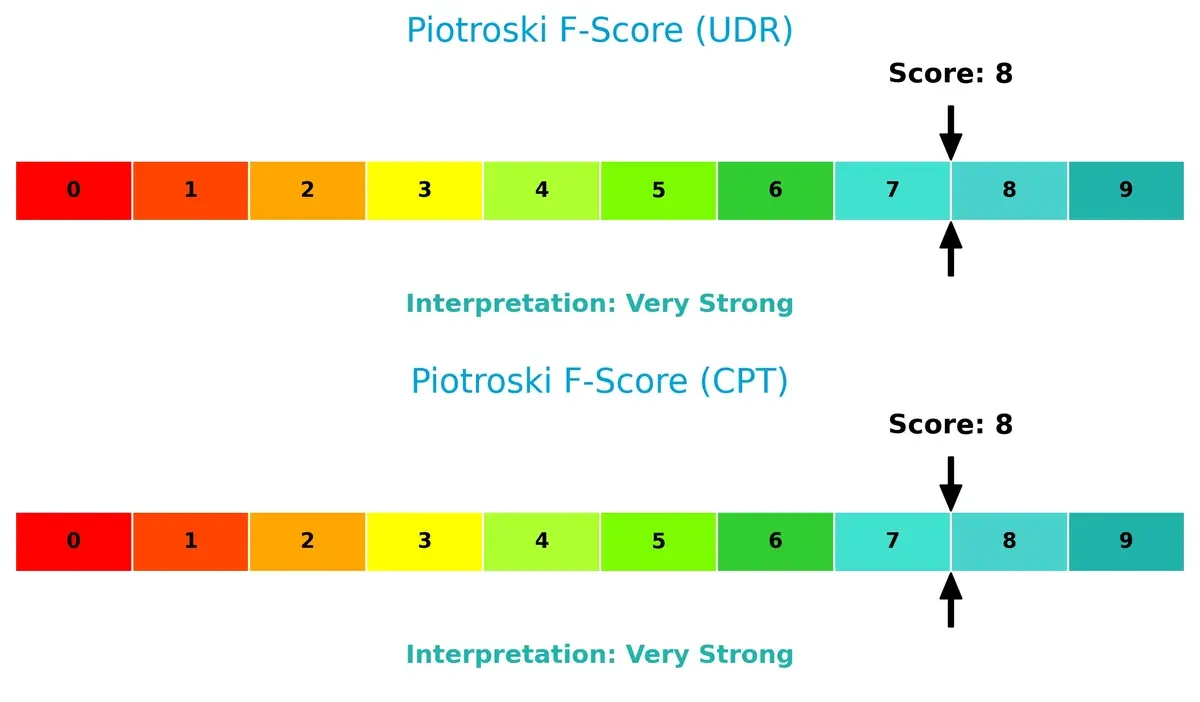
Financial Health: Quality of Operations
Both companies score an impressive 8 on the Piotroski F-Score, indicating robust financial health and operational quality. Neither shows red flags internally, confirming strong fundamentals amid market pressures:
How are the two companies positioned?
This section dissects UDR and Camden’s operational DNA by comparing their revenue distribution and internal dynamics. The goal is to confront their economic moats and identify which model delivers the most resilient competitive advantage today.
Revenue Segmentation: The Strategic Mix
This comparison dissects how UDR, Inc. and Camden Property Trust diversify income streams and reveals their primary sector bets:
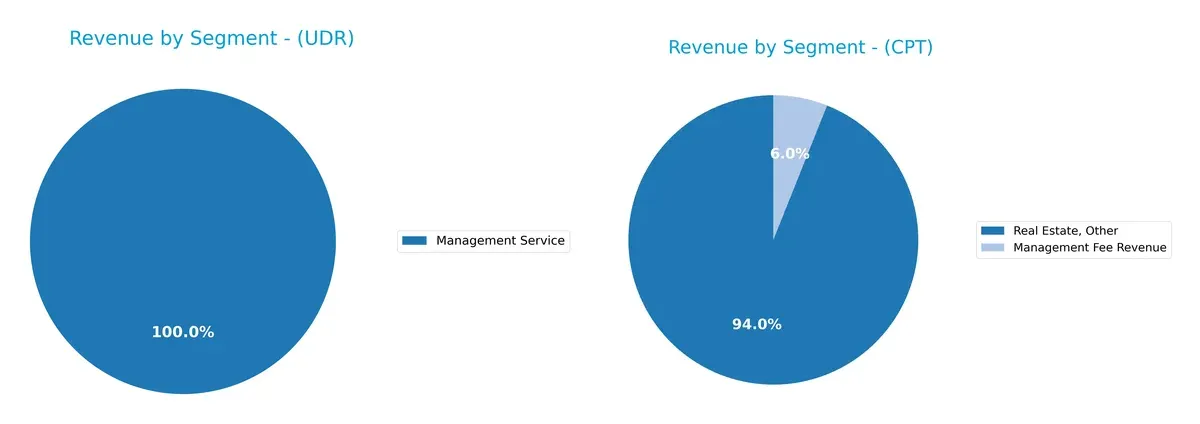
UDR’s revenue pivots mainly on “Non Mature Communities” and “Total Communities,” anchoring its income in property operations. Camden Property Trust shows a leaner mix, with “Real Estate, Other” dwarfing its “Management Fee Revenue.” UDR’s broader community focus suggests ecosystem lock-in, while Camden’s concentration on real estate signals exposure to market cycles and concentration risk. UDR’s diversification offers more resilience versus Camden’s narrow segment reliance.
Strengths and Weaknesses Comparison
This table compares the strengths and weaknesses of UDR and Camden Property Trust based on diversification, profitability, financials, innovation, global presence, and market share:
UDR Strengths
- Favorable net margin at 22.06%
- High ROIC of 29.38% well above WACC
- Strong interest coverage with infinite ratio
- Favorable quick ratio at 3.31
- High dividend yield at 4.68%
Camden Property Trust Strengths
- Favorable net margin at 21.84%
- Favorable WACC at 6.52%
- Favorable quick ratio at 55.52
- Infinite interest coverage
- Dividend yield at 3.82%
UDR Weaknesses
- Unfavorable P/E of 32.08 and P/B of 3.68
- High debt-to-equity at 1.88 and debt-to-assets 58.34%
- Low asset turnover at 0.16
- Unfavorable current ratio at 3.31
- Neutral ROE at 11.49%
Camden Property Trust Weaknesses
- Unfavorable ROE at 8.81% and ROIC at 4.54%
- Unfavorable P/E at 31.03
- Extremely high current ratio at 55.52
- Unfavorable fixed asset turnover at 0
- Neutral debt-to-equity at 0.89 and debt-to-assets 43.14%
UDR shows strengths in profitability and capital efficiency but carries higher leverage risks. Camden Property Trust has solid margins and liquidity but weaker returns and asset utilization. Both face valuation concerns that may impact capital allocation strategies.
The Moat Duel: Analyzing Competitive Defensibility
A structural moat alone protects long-term profits from relentless competition erosion. Let’s dissect these two REITs’ moats in detail:
UDR, Inc.: Efficient Capital Allocation Powerhouse
UDR’s moat stems from its superior capital efficiency, reflected in a ROIC exceeding WACC by 23.6%. This drives margin stability and significant net income growth. In 2026, expansion into new markets could strengthen this moat further.
Camden Property Trust: Growth Ambition Meets Value Challenges
Camden’s moat relies on scale and geographic diversification but struggles with ROIC below WACC, signaling value erosion despite revenue growth. Its rising profitability hints at potential moat recovery via property development in 2026.
ROIC Supremacy vs. Growth Ambition in REITs
UDR’s wider moat, evidenced by strong ROIC and value creation, outmatches Camden’s current value destruction despite growth. UDR stands better poised to defend market share amid competitive pressures.
Which stock offers better returns?
The past year reveals distinct bullish trends for both stocks, with Camden Property Trust showing stronger gains and accelerating momentum compared to UDR, Inc.
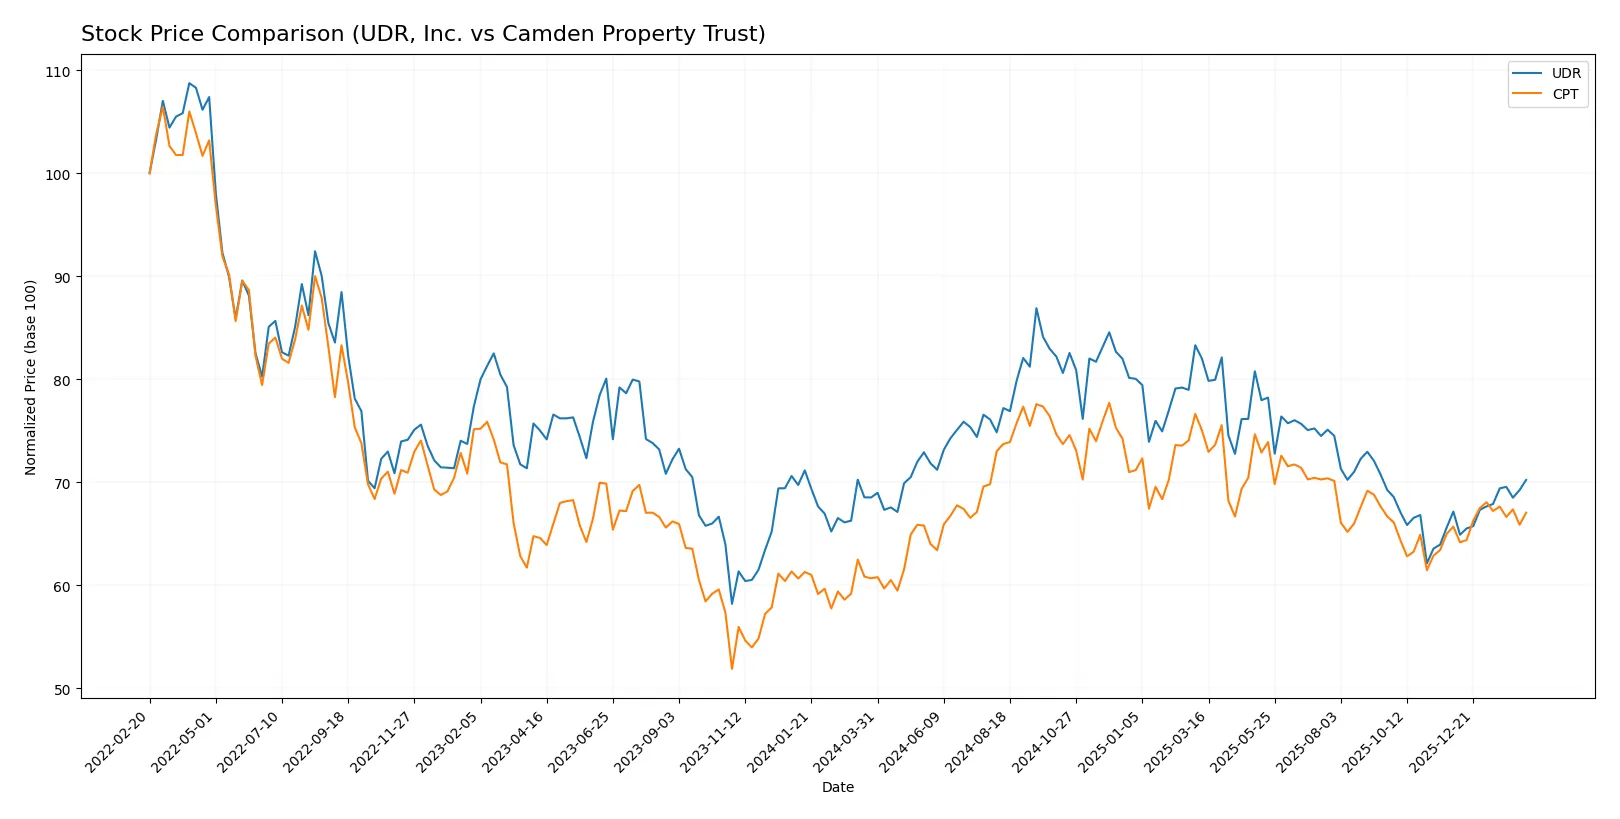
Trend Comparison
UDR, Inc. posted a 2.5% price increase over 12 months, signaling a bullish trend with accelerating momentum. The stock ranged from 33.69 to 47.13, showing moderate volatility (std dev 3.11).
Camden Property Trust gained 10.5% over the same period, marking a stronger bullish trend with acceleration. It traded between 96.29 and 125.8, with higher volatility (std dev 7.45).
Camden Property Trust outperformed UDR, Inc. in market performance, delivering more than four times the price appreciation over the last year.
Target Prices
Analysts present a clear consensus on target prices for UDR, Inc. and Camden Property Trust, reflecting moderate upside potential.
| Company | Target Low | Target High | Consensus |
|---|---|---|---|
| UDR, Inc. | 38 | 44 | 41.18 |
| Camden Property Trust | 106 | 133 | 113.71 |
The target consensus for UDR, Inc. sits about 8% above its current price of 38.09, indicating modest upside. Camden Property Trust’s consensus of 113.71 suggests roughly a 5% gain from its 108.53 price, signaling cautious optimism among analysts.

Don’t Let Luck Decide Your Entry Point
Optimize your entry points with our advanced ProRealTime indicators. You’ll get efficient buy signals with precise price targets for maximum performance. Start outperforming now!
How do institutions grade them?
Here is a summary of the most recent institutional grades for UDR, Inc. and Camden Property Trust:
UDR, Inc. Grades
The following table shows recent ratings and grade changes from key grading companies for UDR, Inc.:
| Grading Company | Action | New Grade | Date |
|---|---|---|---|
| RBC Capital | Maintain | Sector Perform | 2026-02-11 |
| Evercore ISI Group | Maintain | Outperform | 2026-02-11 |
| Cantor Fitzgerald | Maintain | Neutral | 2026-02-11 |
| Truist Securities | Upgrade | Buy | 2026-01-20 |
| Goldman Sachs | Maintain | Sell | 2026-01-20 |
| UBS | Maintain | Buy | 2026-01-08 |
| JP Morgan | Downgrade | Underweight | 2025-12-18 |
| Truist Securities | Maintain | Hold | 2025-12-01 |
| Barclays | Maintain | Overweight | 2025-11-25 |
| Mizuho | Maintain | Neutral | 2025-11-24 |
Camden Property Trust Grades
Below are recent institutional ratings and grade adjustments for Camden Property Trust:
| Grading Company | Action | New Grade | Date |
|---|---|---|---|
| RBC Capital | Maintain | Sector Perform | 2026-02-10 |
| Cantor Fitzgerald | Maintain | Neutral | 2026-02-09 |
| Truist Securities | Maintain | Buy | 2026-01-20 |
| Barclays | Maintain | Equal Weight | 2026-01-13 |
| Mizuho | Maintain | Outperform | 2026-01-12 |
| UBS | Maintain | Neutral | 2026-01-08 |
| JP Morgan | Upgrade | Neutral | 2025-12-18 |
| Truist Securities | Maintain | Buy | 2025-12-15 |
| Barclays | Downgrade | Equal Weight | 2025-11-25 |
| Wells Fargo | Maintain | Equal Weight | 2025-11-25 |
Which company has the best grades?
UDR, Inc. shows a wider range of ratings, from Sell to Outperform, with recent upgrades to Buy. Camden Property Trust maintains mostly Neutral to Buy grades, including an Outperform from Mizuho. Investors may interpret UDR’s mixed grades as signaling more divergent views, while Camden’s steadier ratings suggest more consensus on moderate performance.
Risks specific to each company
The following categories identify the critical pressure points and systemic threats facing both firms in the 2026 market environment:
1. Market & Competition
UDR, Inc.
- Operates in targeted U.S. multifamily markets with steady demand but faces intense competition among REITs.
Camden Property Trust
- Larger portfolio with greater geographic diversification but competes fiercely with national and regional players.
2. Capital Structure & Debt
UDR, Inc.
- High debt-to-assets at 58.3% signals leverage risk; debt-to-equity 1.88 is unfavorable.
Camden Property Trust
- Moderate leverage with 43.1% debt-to-assets and debt-to-equity of 0.89, indicating more balanced capital structure.
3. Stock Volatility
UDR, Inc.
- Beta of 0.71 shows lower volatility than market, indicating defensive characteristics.
Camden Property Trust
- Beta of 0.83 indicates moderately higher volatility but still below broader indices.
4. Regulatory & Legal
UDR, Inc.
- Subject to U.S. residential housing regulations and zoning laws; no specific legal red flags.
Camden Property Trust
- Similar regulatory environment; recognized employer which may mitigate labor-related legal risks.
5. Supply Chain & Operations
UDR, Inc.
- Manages over 51K apartment homes, with development pipeline; operational efficiency challenged by asset turnover ratio 0.16.
Camden Property Trust
- Operates 56.8K units plus developments; slightly better asset turnover at 0.19 but fixed asset turnover flagged unfavorable.
6. ESG & Climate Transition
UDR, Inc.
- Long-standing reputation with focus on resident service; ESG risks include energy efficiency in aging portfolio.
Camden Property Trust
- Award-winning workplace culture suggests strong social governance; climate transition risks typical for multifamily REITs.
7. Geopolitical Exposure
UDR, Inc.
- Concentrated in U.S. markets; minimal direct geopolitical risk but sensitive to domestic economic cycles.
Camden Property Trust
- Also U.S.-focused; exposure to regional economic shifts in Texas and other key states.
Which company shows a better risk-adjusted profile?
UDR’s highest risk is its elevated leverage, pushing it into financial distress territory per Altman Z-Score. Camden’s main concern is weaker returns on invested capital, limiting profitability in a competitive market. Camden’s more balanced capital structure and stronger DCF score indicate a better risk-adjusted profile. UDR’s leverage stands out amid a tough rate environment, while Camden’s operational scale and moderate debt provide resilience.
Final Verdict: Which stock to choose?
UDR, Inc. stands out as a cash machine with a robust ability to generate returns well above its cost of capital. Its rising profitability signals a durable competitive edge. A point of vigilance is its elevated leverage, which could amplify risks in a rising interest rate environment. UDR suits portfolios targeting aggressive growth with an appetite for some financial risk.
Camden Property Trust offers a strategic moat rooted in operational efficiency and a strong cash conversion cycle. It presents a safer profile than UDR, thanks to lower leverage and steadier cash flows. While its returns on invested capital lag, its stability appeals to investors seeking GARP—growth at a reasonable price—within real estate assets.
If you prioritize value creation powered by a strong moat and are comfortable with financial leverage, UDR outshines as the compelling choice due to its superior ROIC and accelerating earnings growth. However, if you seek better stability with a conservative balance sheet, Camden Property Trust offers a more prudent scenario with less financial risk and consistent cash generation. Both warrant close monitoring of market cycles and interest rate trends.
Disclaimer: Investment carries a risk of loss of initial capital. The past performance is not a reliable indicator of future results. Be sure to understand risks before making an investment decision.
Go Further
I encourage you to read the complete analyses of UDR, Inc. and Camden Property Trust to enhance your investment decisions: