Home > Comparison > Real Estate > ESS vs CPT
The strategic rivalry between Essex Property Trust and Camden Property Trust shapes the competitive landscape of the residential REIT sector. Essex operates as a West Coast-focused, fully integrated multifamily property owner and developer, while Camden maintains a broader U.S. footprint with a strong emphasis on employee culture and operational scale. This analysis will weigh their differing growth strategies and risk profiles to identify which offers superior risk-adjusted returns for a diversified portfolio.

Table of contents
Companies Overview
Essex Property Trust and Camden Property Trust stand as key players in the U.S. residential REIT sector, each commanding substantial market influence.
Essex Property Trust: West Coast Multifamily Specialist
Essex Property Trust is a fully integrated REIT specializing in West Coast multifamily residential properties. Its core revenue comes from acquiring, developing, and managing 246 apartment communities totaling roughly 60,000 homes. In 2026, Essex focuses on expanding its footprint through active development of 6 additional properties, reinforcing its competitive advantage in prime coastal markets.
Camden Property Trust: National Multifamily Operator
Camden Property Trust operates as a prominent multifamily residential real estate company with a national footprint. Camden generates income by owning, managing, and developing 167 apartment communities with 56,850 homes, aiming to increase to 59,104 units through seven developments underway. The company’s strategic priority in 2026 emphasizes portfolio growth paired with maintaining a strong workplace culture recognized by industry accolades.
Strategic Collision: Similarities & Divergences
Both companies pursue growth via multifamily residential development and management, but Essex zeroes in on West Coast exclusivity while Camden adopts a broader U.S. presence. Their primary battleground is market share in high-demand apartment communities. Essex’s focused regional moat contrasts Camden’s diversified portfolio approach, shaping distinct risk-return profiles for investors seeking either concentrated or broader exposure in residential REITs.
Income Statement Comparison
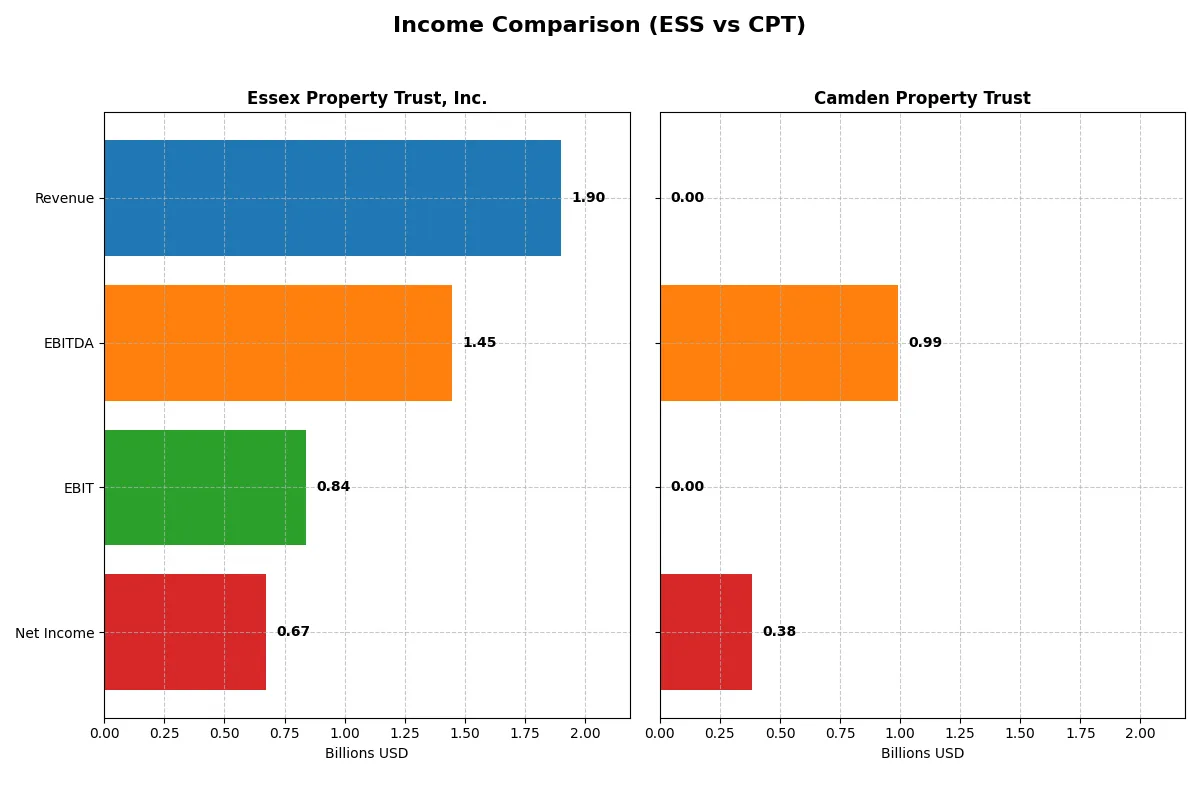
This data dissects the core profitability and scalability of both corporate engines to reveal who dominates the bottom line:
| Metric | Essex Property Trust, Inc. (ESS) | Camden Property Trust (CPT) |
|---|---|---|
| Revenue | 1.90B | 0 |
| Cost of Revenue | 593M | 0 |
| Operating Expenses | 474M | 79M |
| Gross Profit | 1.31B | 0 |
| EBITDA | 1.45B | 991M |
| EBIT | 838M | 0 |
| Interest Expense | 257M | 0 |
| Net Income | 672M | 384M |
| EPS | 10.41 | 3.54 |
| Fiscal Year | 2025 | 2025 |
Income Statement Analysis: The Bottom-Line Duel
The upcoming comparison reveals which company operates with greater financial efficiency and delivers superior shareholder value.
Essex Property Trust, Inc. Analysis
Essex’s revenue climbed steadily from 1.44B in 2021 to 1.90B in 2025, with net income increasing from 489M to 672M. The company maintains robust gross margins above 68% and net margins near 35%, reflecting strong operational leverage. Despite a recent dip in EBIT and net margin growth, Essex shows healthy momentum and margin resilience.
Camden Property Trust Analysis
Camden’s revenue peaked at 1.54B in 2023 but plunged to zero in 2025 due to discontinued operations. Net income grew overall to 384M in 2025, supported by non-operating factors and a large D&A charge. Margins collapsed to zero in the latest year, signaling operational distress and loss of core business profitability.
Margin Strength vs. Revenue Collapse
Essex demonstrates superior margin control and consistent revenue growth, while Camden suffers a revenue wipeout and margin erosion. Essex’s stable cash-generating ability and profit margins mark it as the fundamental winner. Investors prioritizing operational strength will find Essex’s profile more attractive.
Financial Ratios Comparison
These vital ratios act as a diagnostic tool to expose the underlying fiscal health, valuation premiums, and capital efficiency of the companies analyzed:
| Ratios | Essex Property Trust (ESS) | Camden Property Trust (CPT) |
|---|---|---|
| ROE | 13.4% (2024) | 3.5% (2024) |
| ROIC | 5.6% (2024) | 3.5% (2024) |
| P/E | 24.7 (2024) | 77.1 (2024) |
| P/B | 3.31 (2024) | 2.69 (2024) |
| Current Ratio | 0.66 (2024) | 0.10 (2024) |
| Quick Ratio | 0.66 (2024) | 0.10 (2024) |
| D/E | 1.20 (2024) | 0.75 (2024) |
| Debt-to-Assets | 51.5% (2024) | 39.4% (2024) |
| Interest Coverage | 3.0 (2024) | 2.3 (2024) |
| Asset Turnover | 0.14 (2024) | 0.17 (2024) |
| Fixed Asset Turnover | 34.4 (2024) | 0 (2024) |
| Payout Ratio | 84% (2024) | 276% (2024) |
| Dividend Yield | 3.38% (2024) | 3.58% (2024) |
| Fiscal Year | 2024 | 2024 |
Efficiency & Valuation Duel: The Vital Signs
Financial ratios act as a company’s DNA, unveiling hidden risks and operational strengths that drive shareholder value.
Essex Property Trust, Inc.
Essex shows a strong net margin of 35.38%, reflecting operational efficiency. However, its ROE is 0%, indicating weak profitability for shareholders. The P/E ratio of 25.08 suggests a stretched valuation. Essex supports returns through a solid 3.88% dividend yield, balancing its reinvestment priorities.
Camden Property Trust
Camden posts a modest net margin of 10.58% and a low ROE of 3.49%, signaling limited profitability. Its P/E ratio of 77.1 marks the stock as very expensive. Dividend yield of 3.58% offers some income, but the high valuation raises concerns about growth sustainability.
Valuation Stretch vs. Profitability Gaps
Essex balances operational efficiency with a reasonable valuation and attractive dividend, despite weak ROE. Camden trades at a steep premium with lower profitability and higher risk. Investors seeking income with moderate risk might lean towards Essex, while growth-focused profiles face a more speculative Camden.
Which one offers the Superior Shareholder Reward?
Essex Property Trust (ESS) and Camden Property Trust (CPT) both prioritize shareholder returns but differ markedly in their approaches. ESS delivers a 3.88% dividend yield with an 83.7% payout ratio, nearly fully covering dividends with free cash flow. Its robust buyback program further amplifies returns, reflecting disciplined capital allocation. CPT yields 3.58% but carries a riskier 276% payout ratio, signaling dividend sustainability concerns. CPT’s weaker free cash flow coverage and a less aggressive buyback profile raise caution. Historically, ESS’s balanced dividends and buybacks create more sustainable, long-term shareholder value. I conclude ESS offers a superior total return profile in 2026.
Comparative Score Analysis: The Strategic Profile
The radar chart reveals the fundamental DNA and trade-offs of Essex Property Trust and Camden Property Trust, highlighting their financial strengths and weaknesses:
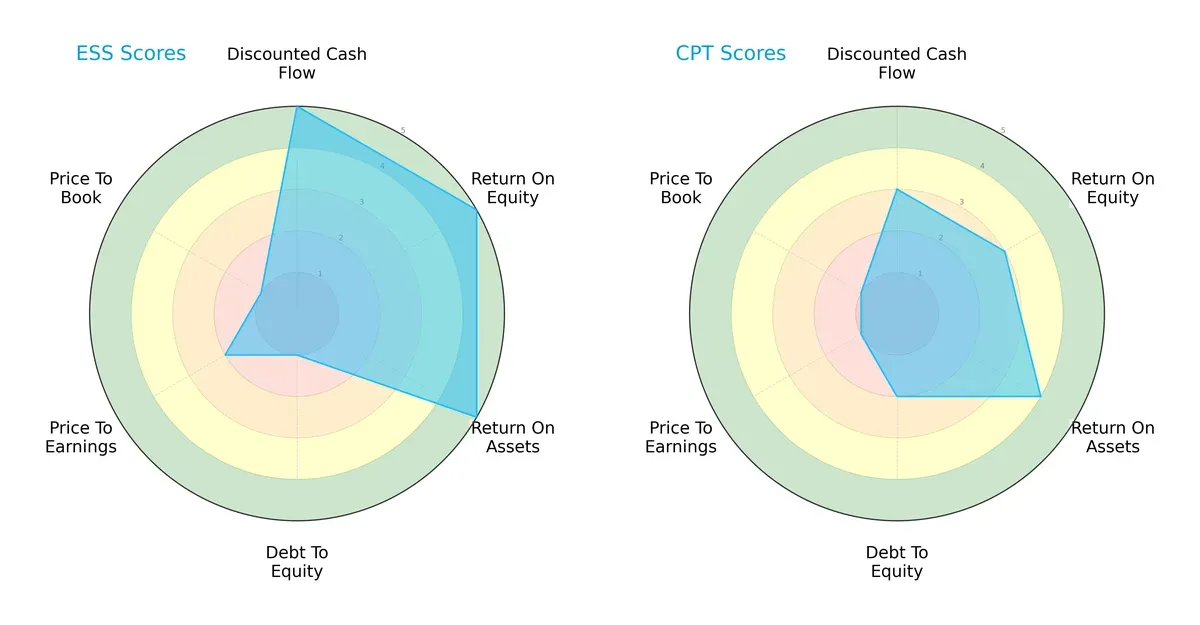
Essex dominates in DCF, ROE, and ROA, showing superior cash flow generation and asset efficiency. However, its debt-to-equity and valuation scores signal higher financial risk and potential overvaluation. Camden offers a more balanced debt profile but lags in profitability metrics. Essex relies heavily on operational excellence, while Camden maintains steadier leverage control.
Bankruptcy Risk: Solvency Showdown
Both firms fall in the distress zone per Altman Z-Scores, signaling elevated bankruptcy risk amid the current cycle:
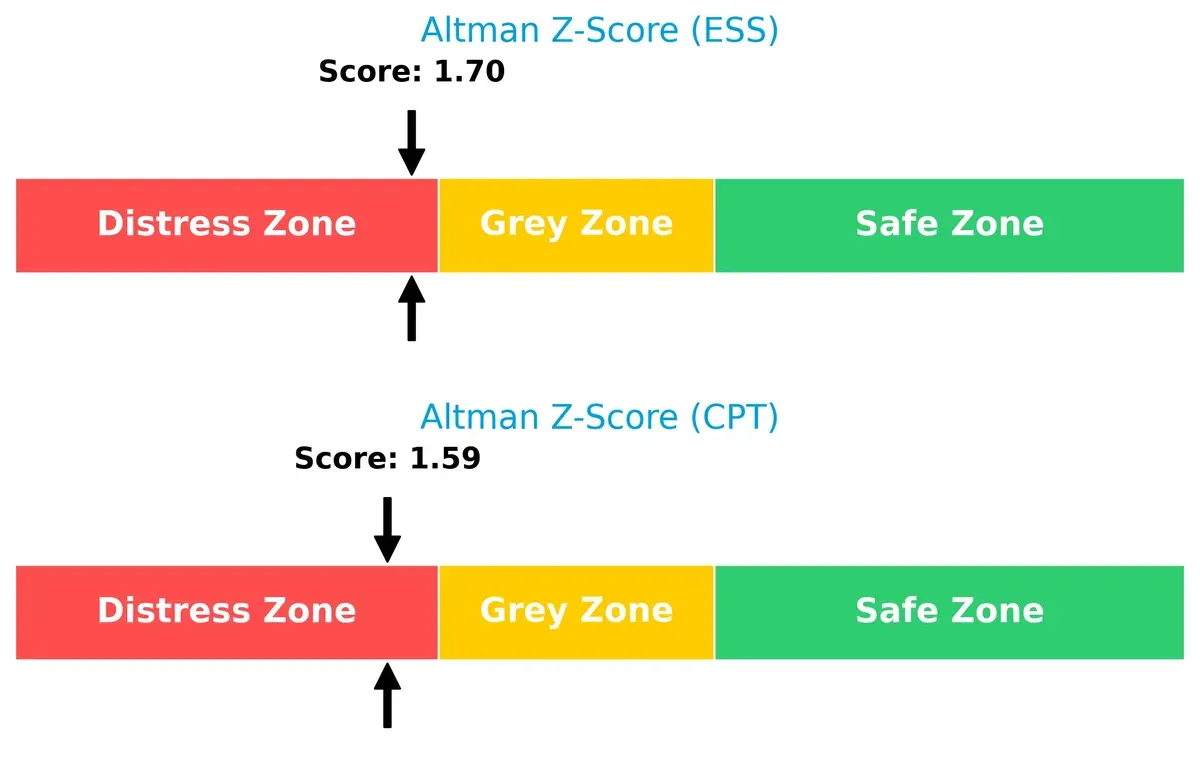
Essex’s score of 1.70 slightly edges Camden’s 1.59, but both reflect fragile solvency. Investors must approach with caution, prioritizing risk management given these red flags.
Financial Health: Quality of Operations
Essex and Camden both score a robust 7 on the Piotroski scale, indicating strong financial health and operational quality:
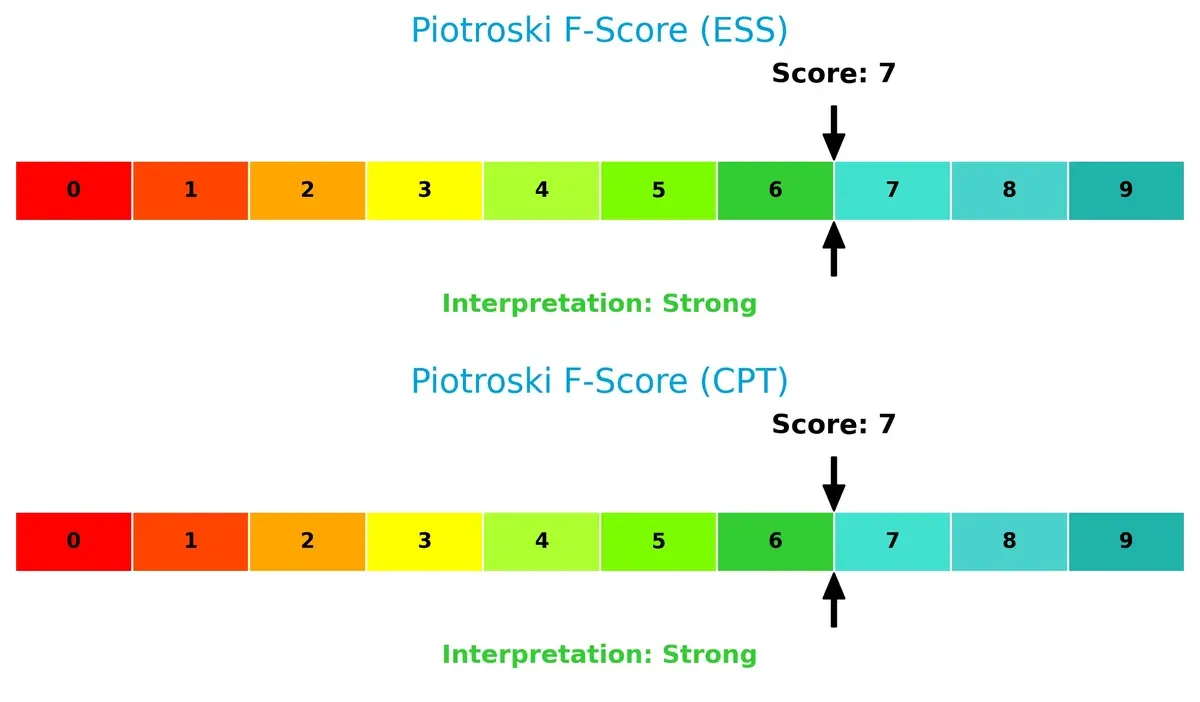
Neither company shows internal red flags. Their solid Piotroski scores suggest disciplined capital allocation and profitability despite external risks. This underscores operational resilience in a challenging environment.
How are the two companies positioned?
This section dissects Essex and Camden’s operational DNA by comparing revenue distribution and internal strengths and weaknesses. The goal is to confront their economic moats to identify the more resilient, sustainable competitive advantage today.
Revenue Segmentation: The Strategic Mix
This comparison visually dissects how Essex Property Trust and Camden Property Trust diversify their income streams and highlights their primary sector bets:
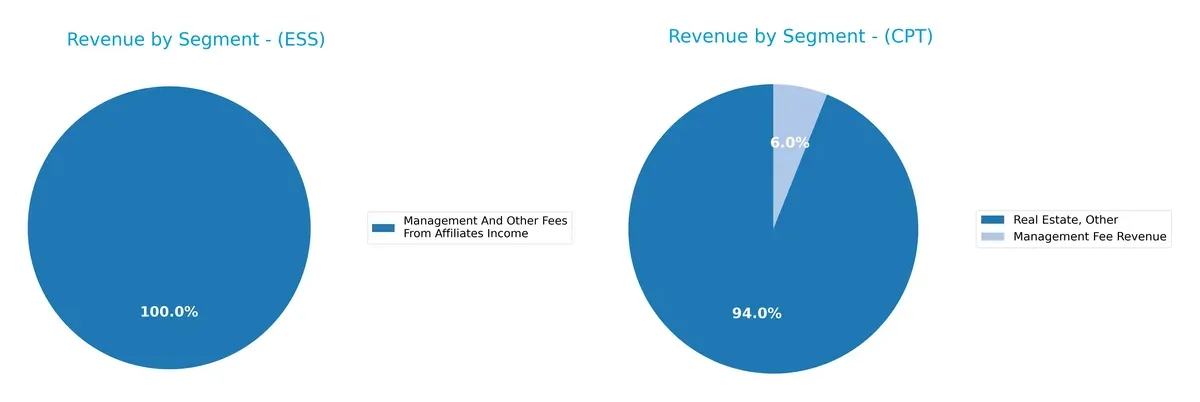
Essex Property Trust anchors its revenue in Rental And Other Property Revenues with $1.28B, dwarfing its $11M management fees. Camden Property Trust shows a more balanced mix, with $112M from Real Estate, Other, and $7.2M from management fees. Essex’s heavy rental focus signals infrastructure dominance but carries concentration risk. Camden’s blend suggests cautious diversification, reducing vulnerability to market shifts.
Strengths and Weaknesses Comparison
This table compares the Strengths and Weaknesses of Essex Property Trust, Inc. (ESS) and Camden Property Trust (CPT):
ESS Strengths
- High net margin at 35.38%
- Favorable debt-to-equity and debt-to-assets ratios
- Solid dividend yield of 3.88%
- Strong rental revenues in Northern and Southern California markets
CPT Strengths
- Positive net margin at 10.58%
- Favorable dividend yield of 3.58%
- Neutral debt-to-equity ratio at 0.75
- Presence of management fee revenue diversifies income
ESS Weaknesses
- Unfavorable ROE and ROIC at 0%
- Poor liquidity ratios (current and quick ratio at 0)
- Unfavorable asset turnover metrics
- Unavailable WACC data limits cost of capital insight
- Slightly unfavorable overall ratios
CPT Weaknesses
- Low ROE and ROIC around 3.5%, below ideal returns
- Unfavorable current and quick ratios at 0.1
- High P/E at 77.1 suggests overvaluation
- Unfavorable interest coverage ratio at 0
- Unfavorable asset turnover metrics
- Unfavorable overall financial ratios
Both companies show strengths in profitability and dividend yield but face liquidity and efficiency challenges. ESS benefits from geographic concentration in California, while CPT shows some income diversification. Both must address weak returns on invested capital and asset utilization to strengthen their financial positions.
The Moat Duel: Analyzing Competitive Defensibility
A structural moat protects long-term profits from relentless competition erosion. Without it, market share and pricing power vanish quickly:
Essex Property Trust, Inc.: Regional Scale & Operational Efficiency Moat
Essex’s moat stems from concentrated West Coast market expertise and scale economies. It sustains high gross margins near 69% and stable net margins above 35%. However, a declining ROIC trend signals looming efficiency risks. Expansion through new developments could bolster or strain its moat in 2026.
Camden Property Trust: Talent & Portfolio Diversification Moat
Camden’s moat lies in workforce reputation and national property diversification. Unlike Essex, Camden shows a growing ROIC trend, suggesting improved capital efficiency. Yet recent revenue disruptions cloud its margin stability. Continued geographic expansion and employee engagement could deepen Camden’s moat by 2026.
Operational Scale vs. Human Capital: The Moat Showdown
Essex’s focused regional dominance delivers superior margins but faces efficiency erosion. Camden’s broad portfolio and talent-driven culture improve returns despite recent volatility. I see Camden developing a deeper moat, better poised to defend market share long term.
Which stock offers better returns?
The past year reveals strong upward moves for both stocks, with Essex showing decelerating gains and Camden accelerating its price appreciation.
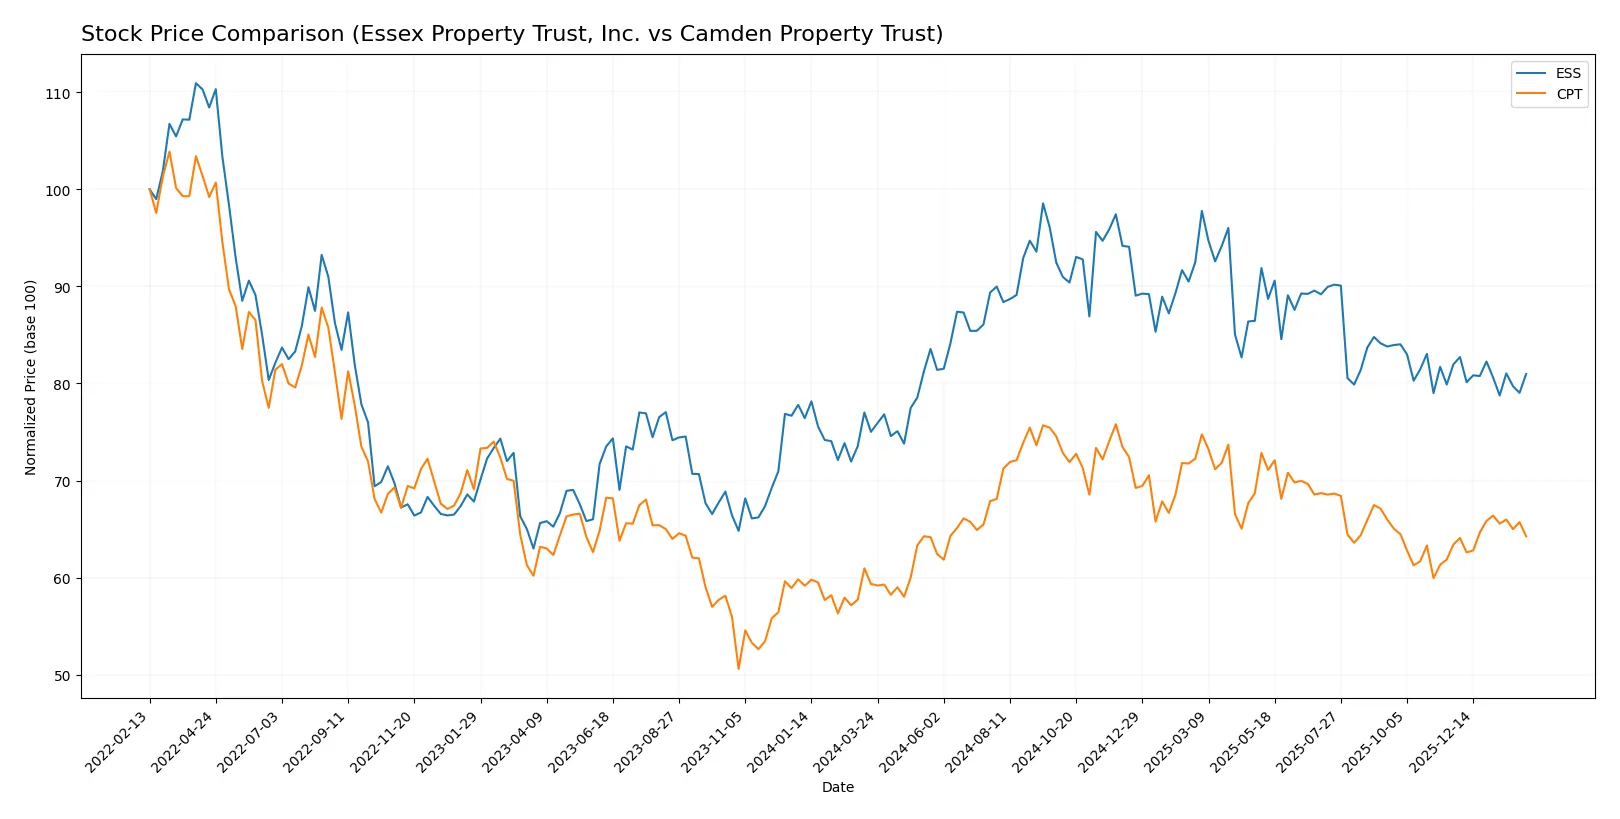
Trend Comparison
Essex Property Trust, Inc. posted a 7.94% price increase over 12 months, confirming a bullish trend with decelerating momentum and notable volatility (18.8 std deviation). The stock peaked at 314.05 and bottomed at 235.17.
Camden Property Trust gained 8.26% over the same period, sustaining a bullish trend with accelerating momentum and lower volatility (7.56 std deviation). Its price ranged between 96.29 and 125.8.
Camden outperformed Essex slightly, delivering the highest market return and showing stronger recent trend acceleration.
Target Prices
Analysts present a clear consensus with moderately optimistic targets for Essex Property Trust and Camden Property Trust.
| Company | Target Low | Target High | Consensus |
|---|---|---|---|
| Essex Property Trust, Inc. | 271 | 292 | 280.4 |
| Camden Property Trust | 105 | 133 | 113.95 |
The target consensus for Essex is about 8.6% above its current price of 258.06, signaling moderate upside potential. Camden’s consensus target exceeds its current 106.63 price by roughly 6.8%, reflecting cautious optimism among analysts.

Don’t Let Luck Decide Your Entry Point
Optimize your entry points with our advanced ProRealTime indicators. You’ll get efficient buy signals with precise price targets for maximum performance. Start outperforming now!
How do institutions grade them?
Here is a summary of recent institutional grades for Essex Property Trust, Inc. and Camden Property Trust:
Essex Property Trust, Inc. Grades
This table lists recent grades and rating actions by key institutions for Essex Property Trust, Inc.
| Grading Company | Action | New Grade | Date |
|---|---|---|---|
| BMO Capital | Downgrade | Market Perform | 2026-01-09 |
| UBS | Maintain | Neutral | 2026-01-08 |
| Jefferies | Downgrade | Hold | 2025-12-16 |
| Truist Securities | Maintain | Hold | 2025-12-16 |
| Barclays | Maintain | Equal Weight | 2025-11-25 |
| Mizuho | Maintain | Outperform | 2025-11-24 |
| UBS | Maintain | Neutral | 2025-11-10 |
| Wells Fargo | Maintain | Equal Weight | 2025-11-10 |
| Scotiabank | Maintain | Sector Outperform | 2025-11-04 |
| Evercore ISI Group | Maintain | In Line | 2025-11-03 |
Camden Property Trust Grades
This table shows recent institutional grades and rating actions for Camden Property Trust.
| Grading Company | Action | New Grade | Date |
|---|---|---|---|
| Truist Securities | Maintain | Buy | 2026-01-20 |
| Barclays | Maintain | Equal Weight | 2026-01-13 |
| Mizuho | Maintain | Outperform | 2026-01-12 |
| UBS | Maintain | Neutral | 2026-01-08 |
| JP Morgan | Upgrade | Neutral | 2025-12-18 |
| Truist Securities | Maintain | Buy | 2025-12-15 |
| Wells Fargo | Maintain | Equal Weight | 2025-11-25 |
| Barclays | Downgrade | Equal Weight | 2025-11-25 |
| Mizuho | Maintain | Outperform | 2025-11-24 |
| Morgan Stanley | Maintain | Equal Weight | 2025-11-13 |
Which company has the best grades?
Camden Property Trust generally holds stronger ratings, including multiple Buy and Outperform grades. Essex Property Trust displays a mix of Hold and Neutral ratings with some recent downgrades. Investors may view Camden’s higher grades as a signal of greater institutional confidence.
Risks specific to each company
The following categories identify the critical pressure points and systemic threats facing both firms in the 2026 market environment:
1. Market & Competition
Essex Property Trust, Inc.
- Strong West Coast presence with 246 communities; faces regional market saturation risks.
Camden Property Trust
- National footprint with 167 properties; competition varies widely by geography and local demand.
2. Capital Structure & Debt
Essex Property Trust, Inc.
- Low debt-to-equity ratio signals conservative leverage; interest coverage is moderate at 3.26x.
Camden Property Trust
- Higher debt-to-equity (0.75) and weak interest coverage raise financial risk concerns.
3. Stock Volatility
Essex Property Trust, Inc.
- Beta of 0.74 indicates lower volatility than market average; more stable for risk-averse investors.
Camden Property Trust
- Beta of 0.83 suggests higher sensitivity to market swings; potentially higher risk and reward.
4. Regulatory & Legal
Essex Property Trust, Inc.
- Operates mainly in California, a state with stringent housing regulations and rent control pressures.
Camden Property Trust
- Broad US presence exposes it to diverse regulatory regimes, increasing compliance complexity.
5. Supply Chain & Operations
Essex Property Trust, Inc.
- Development pipeline includes 6 active projects; West Coast construction costs may constrain margins.
Camden Property Trust
- 7 properties underway; construction delays or cost inflation in multiple regions pose risk.
6. ESG & Climate Transition
Essex Property Trust, Inc.
- West Coast focus increases exposure to climate regulations and sustainability demands.
Camden Property Trust
- Recognized for workplace culture but faces challenges adapting portfolio for climate resilience.
7. Geopolitical Exposure
Essex Property Trust, Inc.
- Concentrated in US West Coast; geopolitical risks limited but local economic shifts impactful.
Camden Property Trust
- National footprint dilutes regional geopolitical risks but increases exposure to varied economic policies.
Which company shows a better risk-adjusted profile?
Essex Property Trust’s strongest pressure point is regulatory risk in California’s restrictive housing market. Camden’s principal concern lies in its elevated leverage and poor interest coverage, increasing financial vulnerability. Essex’s lower beta and conservative capital structure offer a more favorable risk-adjusted profile. Notably, Essex’s Altman Z-score places it marginally less distressed than Camden, despite both being in the distress zone. This data underscores Essex’s relative stability amid sector headwinds.
Final Verdict: Which stock to choose?
Essex Property Trust’s superpower lies in its operational efficiency and strong income quality, driving solid net margins and cash flow generation. Its main point of vigilance is a stretched balance sheet, which could pressure liquidity in volatile markets. It suits portfolios seeking aggressive growth with tolerance for leverage risk.
Camden Property Trust benefits from a strategic moat built on stable recurring revenue and improving ROIC trends, signaling a strengthening competitive position. Compared to Essex, it offers a more conservative risk profile but trades at a higher valuation premium. It fits well in GARP portfolios aiming for steady income with moderate growth.
If you prioritize operational efficiency and cash flow strength, Essex appears the compelling choice due to its superior income quality and margin profile. However, if you seek stability and a growing moat, Camden offers better financial resilience and strategic positioning despite its expensive multiples. Both present analytical scenarios depending on risk appetite and return expectations.
Disclaimer: Investment carries a risk of loss of initial capital. The past performance is not a reliable indicator of future results. Be sure to understand risks before making an investment decision.
Go Further
I encourage you to read the complete analyses of Essex Property Trust, Inc. and Camden Property Trust to enhance your investment decisions: