Home > Comparison > Real Estate > EQR vs CPT
The competitive dynamic between Equity Residential and Camden Property Trust shapes the U.S. residential REIT landscape. Equity Residential operates as a large-cap, urban-focused landlord with a diversified portfolio in major cities. Camden Property Trust emphasizes development and redevelopment of multifamily communities, blending growth with operational efficiency. This analysis will assess which company’s strategic approach delivers superior risk-adjusted returns, guiding investors in optimizing real estate exposure within a diversified portfolio.

Table of contents
Companies Overview
Equity Residential and Camden Property Trust are key players in the US residential REIT market.
Equity Residential: Urban Residential Leader
Equity Residential dominates the acquisition, development, and management of residential properties in dynamic urban markets. Its core revenue comes from leasing 78,568 apartment units across major cities like New York and San Francisco. In 2026, the company strategically focuses on expanding its footprint in high-demand, long-term renter communities to sustain stable cash flow.
Camden Property Trust: Multifamily Development Specialist
Camden Property Trust excels in owning and developing multifamily apartment communities nationwide. Its revenue engine relies on managing 167 properties with 56,850 apartment homes, plus ongoing development projects boosting capacity. The firm prioritizes portfolio growth and redevelopment to enhance asset value and tenant experience in 2026.
Strategic Collision: Similarities & Divergences
Both companies thrive in residential real estate but differ in scale and growth approach. Equity Residential targets premium urban centers emphasizing stability. Camden invests heavily in multifamily development and redevelopment with a growth mindset. Their primary battleground is market share in high-demand rental housing. Equity Residential offers a robust, stable profile; Camden provides growth-driven exposure.
Income Statement Comparison
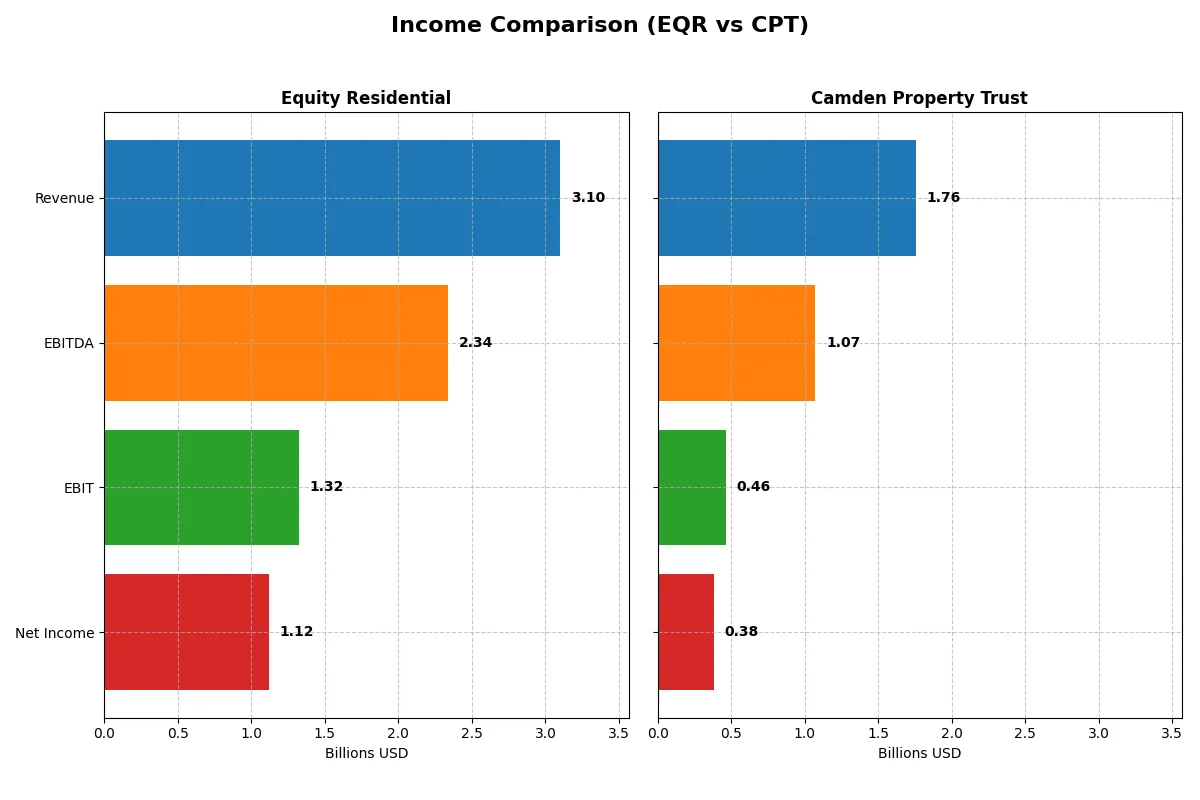
This data dissects the core profitability and scalability of both corporate engines to reveal who dominates the bottom line:
| Metric | Equity Residential (EQR) | Camden Property Trust (CPT) |
|---|---|---|
| Revenue | 3.1B | 1.76B |
| Cost of Revenue | 1.66B | 1.22B |
| Operating Expenses | 310.0M | 79.3M |
| Gross Profit | 1.44B | 542.1M |
| EBITDA | 2.34B | 1.07B |
| EBIT | 1.32B | 463.0M |
| Interest Expense | 237.4M | 0 |
| Net Income | 1.12B | 384.5M |
| EPS | 2.97 | 3.54 |
| Fiscal Year | 2025 | 2025 |
Income Statement Analysis: The Bottom-Line Duel
This income statement comparison reveals the true efficiency and profitability trends of two major real estate investment trusts over recent years.
Equity Residential Analysis
Equity Residential’s revenue rose steadily from 2.46B in 2021 to 3.10B in 2025, showing a 25.9% growth over five years. Net income, however, declined over the same period, falling from 1.33B to 1.12B. The company maintains strong gross and net margins at 46.3% and 36.1%, respectively, with EBIT margin at 42.7%. In 2025, EBIT surged 52%, signaling improved operational efficiency despite a 23.8% gross profit drop from the prior year.
Camden Property Trust Analysis
Camden Property Trust posted robust revenue growth of 53.9% from 1.14B in 2021 to 1.76B in 2025. Net income also climbed significantly by 26.5%, reaching 384M in 2025. Gross margin stands at a healthy 30.8%, with net margin at 21.8%. The 2025 fiscal year showed a strong 14% revenue increase and more than doubled net margin growth, reflecting accelerating profitability and operational leverage.
Margin Power vs. Revenue Scale
Equity Residential leads in margin strength with superior gross and EBIT margins, indicating better cost control and operational efficiency. Camden shines with faster revenue and net income growth, demonstrating stronger top-line momentum and expanding earnings. For investors, Equity Residential offers a profile of consistent margin power, while Camden presents a growth-oriented opportunity reflecting scaling benefits in a competitive market.
Financial Ratios Comparison
These vital ratios act as a diagnostic tool to expose the underlying fiscal health, valuation premiums, and capital efficiency of the companies analyzed:
| Ratios | Equity Residential (EQR) | Camden Property Trust (CPT) |
|---|---|---|
| ROE | 10.14% | 8.81% |
| ROIC | 2.19% | 4.54% |
| P/E | 21.34 | 31.03 |
| P/B | 2.16 | 2.73 |
| Current Ratio | 0.05 | 55.52 |
| Quick Ratio | 0.05 | 55.52 |
| D/E | 0.80 | 0.89 |
| Debt-to-Assets | 42.34% | 43.14% |
| Interest Coverage | 4.75 | 0 (not reported) |
| Asset Turnover | 0.15 | 0.19 |
| Fixed Asset Turnover | 6.82 | 0 (not reported) |
| Payout Ratio | 93.16% | 118.39% |
| Dividend Yield | 4.37% | 3.82% |
| Fiscal Year | 2025 | 2025 |
Efficiency & Valuation Duel: The Vital Signs
Financial ratios serve as a company’s DNA, revealing hidden risks and operational strengths essential for investment analysis.
Equity Residential
Equity Residential shows a solid 10.14% ROE and a high 36.12% net margin, reflecting strong profitability. With a moderate P/E of 21.34 and P/B of 2.16, the stock appears fairly valued, not stretched. The 4.37% dividend yield rewards shareholders, balancing growth with income.
Camden Property Trust
Camden Property Trust posts a lower 8.81% ROE and a 21.84% net margin, indicating more modest profitability. Its P/E ratio of 31.03 signals a stretched valuation. The 3.82% dividend yield provides income, but weaker ROIC at 4.54% reflects limited capital efficiency compared to peers.
Balanced Profitability vs. Valuation Stretch
Equity Residential offers a better balance of profitability and valuation, with favorable returns and a reasonable share price. Camden’s higher valuation and weaker core returns suggest higher risk. Investors seeking a blend of income and operational strength may prefer Equity Residential’s profile.
Which one offers the Superior Shareholder Reward?
I compare Equity Residential (EQR) and Camden Property Trust (CPT) on dividends, payout ratios, and buybacks. EQR yields 4.37% with a high payout ratio near 93%, signaling strong dividend commitment but limited reinvestment. CPT yields 3.82% with a payout above 118%, suggesting aggressive returns but potential sustainability concerns. EQR’s free cash flow per share stands at 4.35, fully covering dividends, supporting sustainable payouts. CPT’s free cash flow is 7.63 per share, also fully funding dividends, but its payout ratio above 100% and weak coverage ratios hint at risk. Buybacks are more intense at EQR, enhancing total shareholder return through capital return and share price support. CPT’s lower buyback activity limits total return upside. I see EQR’s balanced distribution and buyback strategy as more sustainable for long-term value. For 2026, EQR offers the superior total shareholder reward with prudent capital allocation and reliable dividend coverage.
Comparative Score Analysis: The Strategic Profile
The radar chart reveals the fundamental DNA and trade-offs of Equity Residential and Camden Property Trust, highlighting their financial strengths and weaknesses:
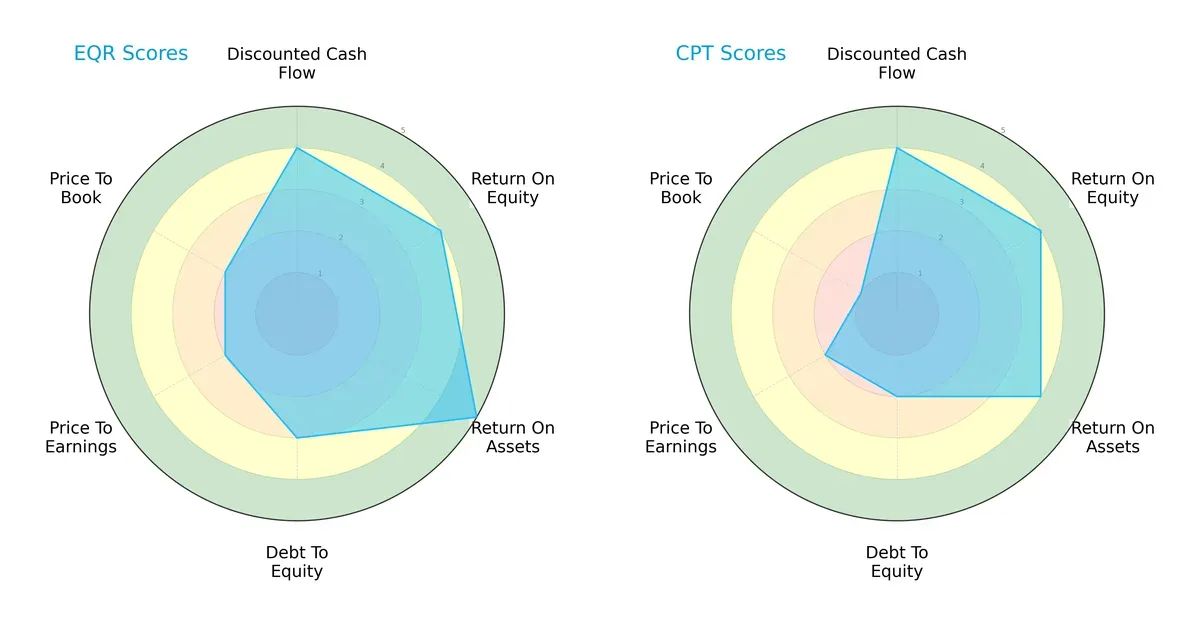
Equity Residential exhibits a more balanced profile with strong ROA (5) and moderate debt-to-equity (3), indicating efficient asset use and controlled leverage. Camden Property Trust matches on ROE and DCF (both 4) but lags in debt-to-equity (2) and valuation metrics, suggesting higher financial risk and potential overvaluation. Overall, Equity Residential relies on operational efficiency, while Camden leans on profitability metrics.
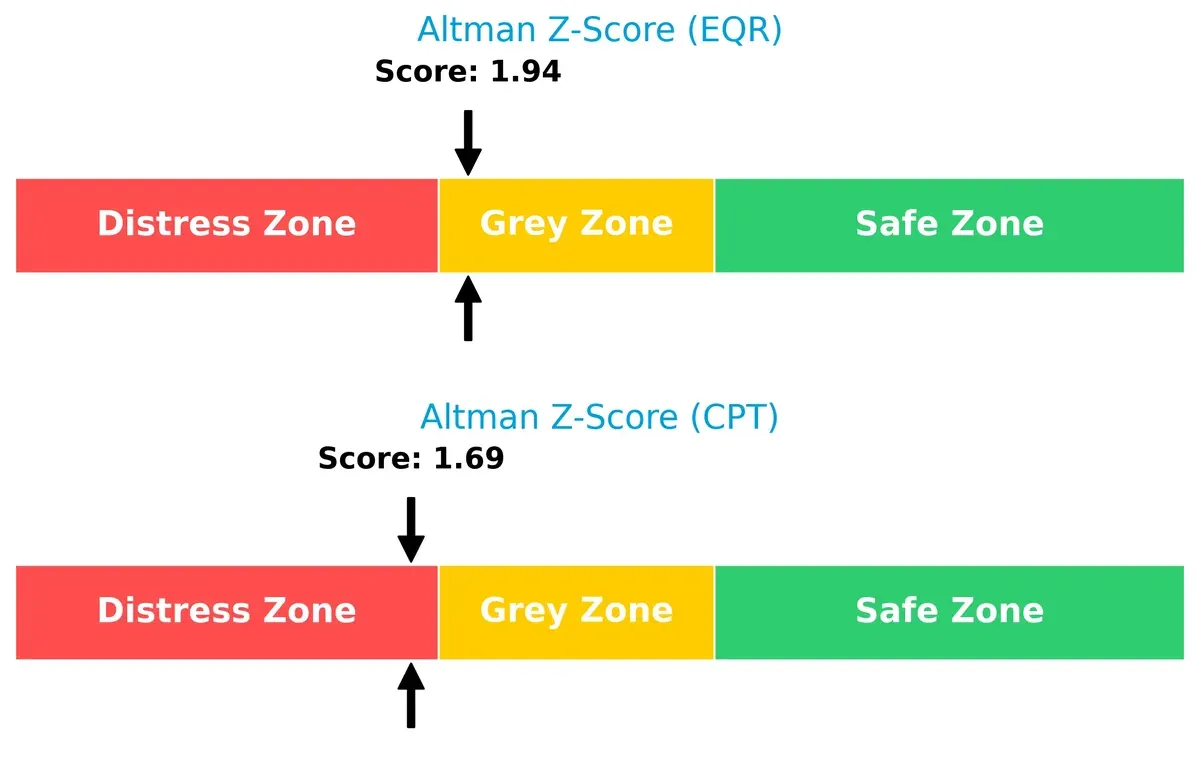
Bankruptcy Risk: Solvency Showdown
Equity Residential’s Altman Z-Score (1.94) places it marginally safer in the grey zone compared to Camden Property Trust’s distress zone score (1.69), signaling a relative edge in long-term survival potential:
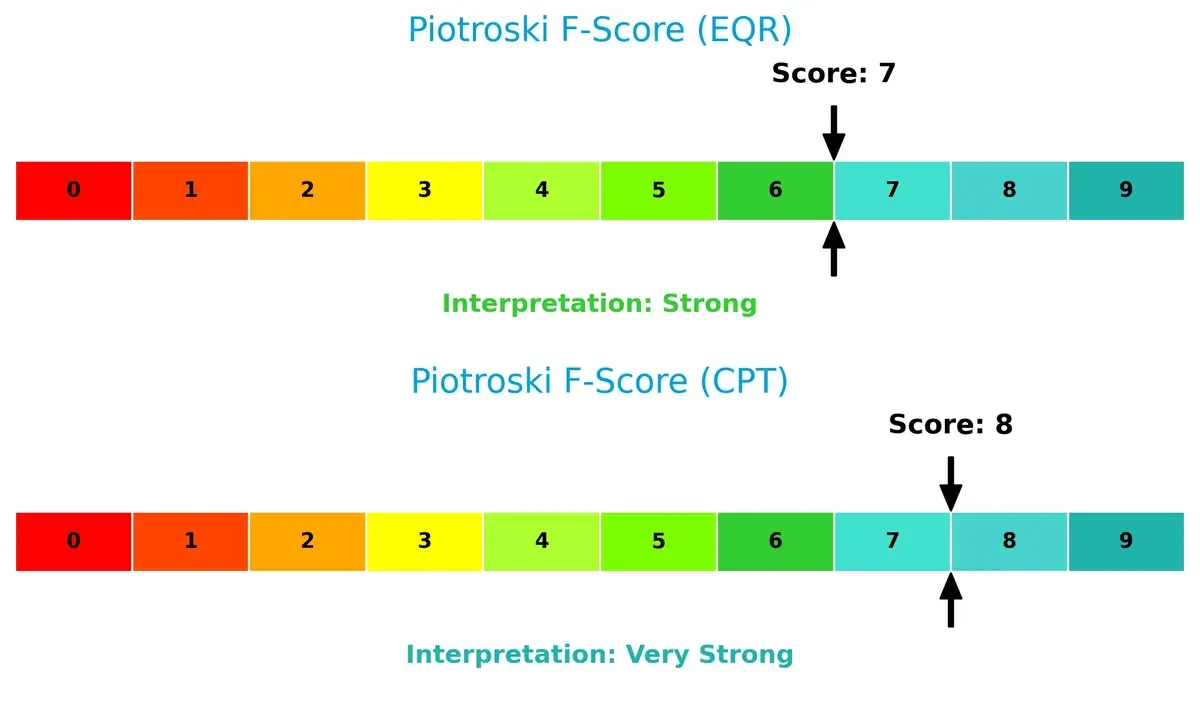
Financial Health: Quality of Operations
Camden Property Trust scores 8 on the Piotroski F-Score, indicating very strong financial health, slightly outperforming Equity Residential’s strong 7. Camden’s internal metrics suggest fewer red flags and higher operational quality:
How are the two companies positioned?
This section dissects the operational DNA of Equity Residential and Camden Property Trust by comparing their revenue distribution and internal strengths and weaknesses. The goal is to confront their economic moats to reveal which business model offers the most resilient and sustainable competitive advantage today.
Revenue Segmentation: The Strategic Mix
This visual comparison dissects how Equity Residential and Camden Property Trust diversify their income streams and where their primary sector bets lie:
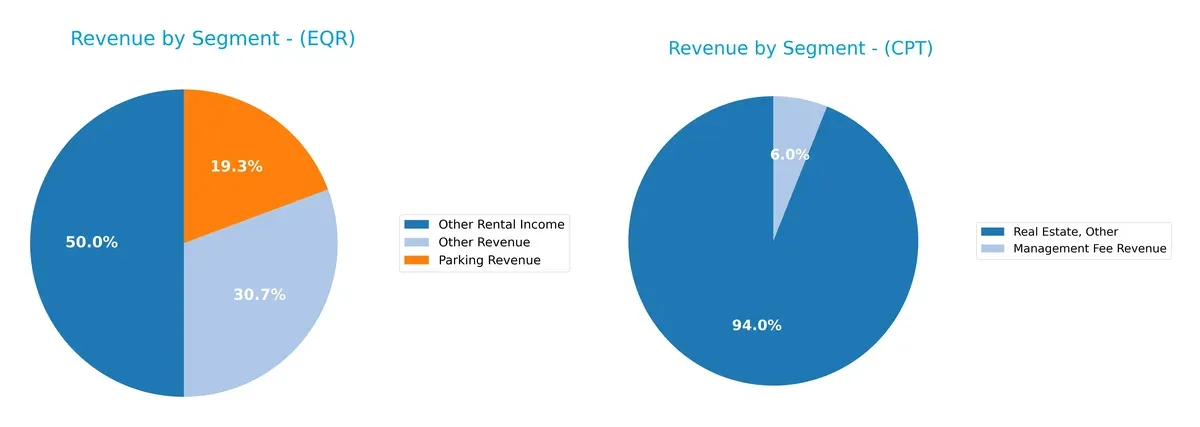
Equity Residential shows a diversified revenue base with solid contributions from Northeast ($686.9M), Southeast ($392.7M), Southwest ($451.0M), and Northwest ($371.2M) segments. Camden Property Trust relies heavily on Real Estate, Other ($112.5M), with a minor Management Fee Revenue ($7.2M) slice. Equity Residential’s multi-regional footprint reduces concentration risk. Camden’s focus on a single dominant segment suggests higher exposure but potential specialization advantages in its niche.
Strengths and Weaknesses Comparison
This table compares the Strengths and Weaknesses of Equity Residential (EQR) and Camden Property Trust (CPT):
EQR Strengths
- High net margin at 36.12%
- ROIC significantly above WACC at 219.27% vs 6.22%
- Favorable interest coverage at 5.58
- Strong fixed asset turnover at 6.82
- Dividend yield at 4.37% supports income
CPT Strengths
- Favorable net margin at 21.84%
- Infinite interest coverage indicates strong debt service
- Quick ratio favorable at 55.52
- Dividend yield at 3.82%
- Neutral price-to-book at 2.73
EQR Weaknesses
- Very low current and quick ratios at 0.05 signal liquidity risks
- Low asset turnover at 0.15 limits efficiency
- Neutral debt-to-assets at 42.34%
- Price-to-earnings neutral at 21.34
CPT Weaknesses
- Unfavorable ROIC at 4.54% below WACC of 6.52%
- High current ratio at 55.52 suggests unusual working capital structure
- Price-to-earnings at 31.03 is elevated
- Fixed asset turnover at zero shows asset utilization issues
Both companies show solid profitability but diverge sharply on capital efficiency and liquidity metrics. EQR excels in return on invested capital and asset turnover but faces liquidity concerns. CPT presents stronger liquidity signals but suffers from low capital returns and asset utilization. These contrasts reflect differing operational focuses and risk profiles in their strategies.
The Moat Duel: Analyzing Competitive Defensibility
A structural moat is the only thing protecting long-term profits from the erosion of competition. Here’s how these two REITs defend their turf:
Equity Residential: Premium Urban Footprint
Equity Residential leverages location-based intangible assets in top-tier cities, sustaining a very favorable moat with ROIC 213% above WACC. Its growing profitability signals robust pricing power and margin resilience in 2026.
Camden Property Trust: Growth-Focused Expansion
Camden’s moat hinges on operational scale and development pipeline, yet its ROIC lags WACC, indicating value erosion. However, expanding apartment units and improving margins suggest a strengthening competitive position.
Urban Intangibles vs. Expansion Scale: Who Holds the Moat?
Equity Residential possesses the deeper economic moat with substantial capital efficiency and margin stability. Camden shows promise but remains vulnerable to competitive pressures. EQR is better positioned to protect market share amid increasing sector competition.
Which stock offers better returns?
The stock price chart highlights notable upward momentum in both companies over the past year, with Camden Property Trust showing stronger gains and buyer dominance.
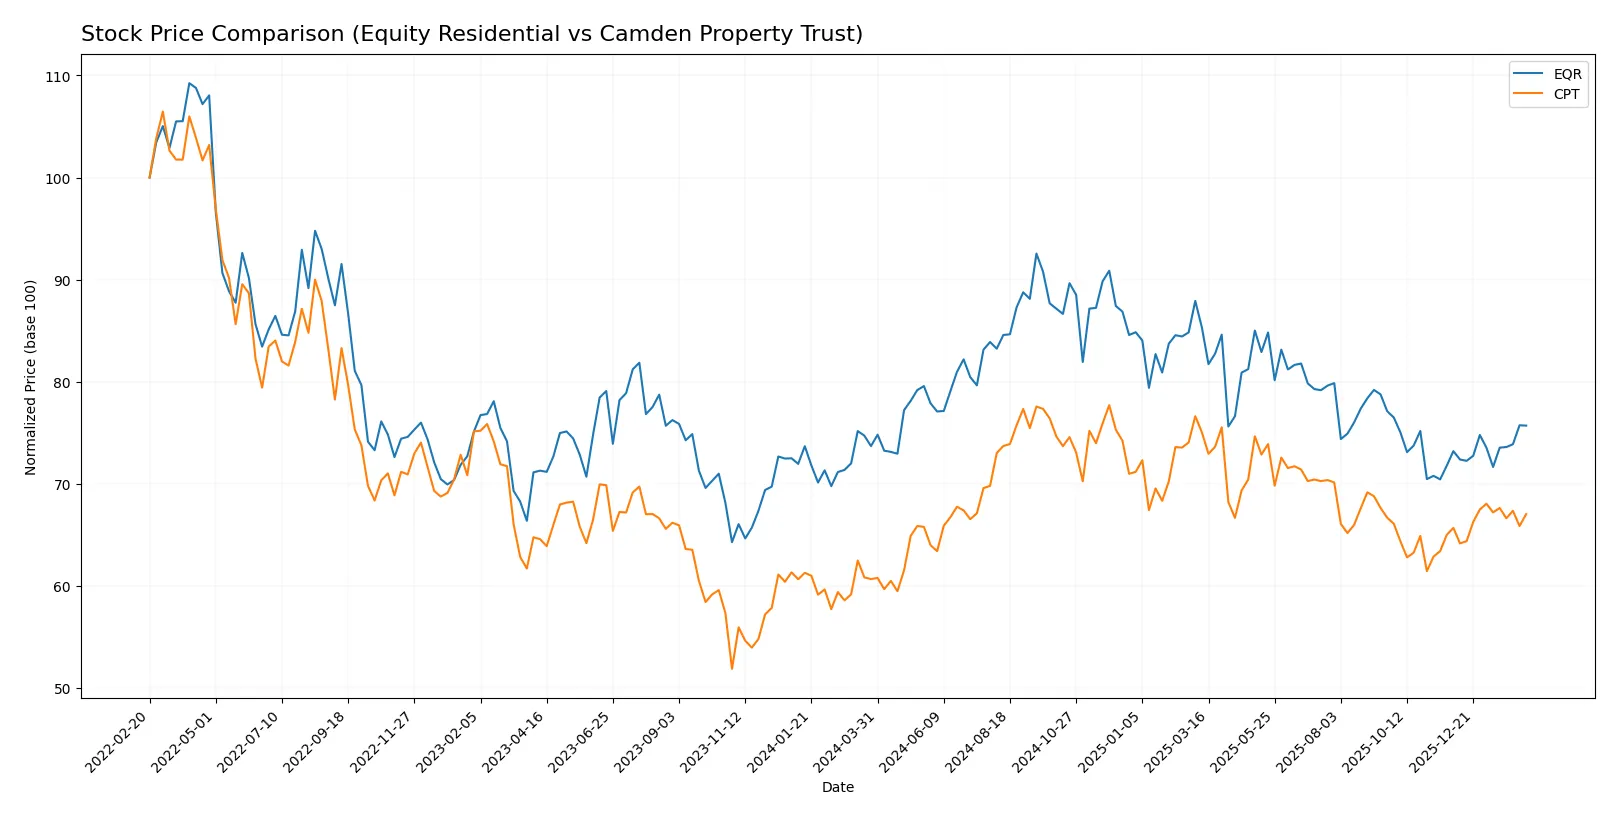
Trend Comparison
Equity Residential’s stock rose 2.72% over the past year, marking a bullish trend with accelerating momentum and moderate volatility (4.62 std deviation). The price ranged between 59.42 and 78.08.
Camden Property Trust gained 10.5% during the same period, reflecting a stronger bullish trend with acceleration and higher volatility (7.45 std deviation). The price fluctuated from 96.29 to 125.8.
Camden Property Trust outperformed Equity Residential, delivering higher total returns and more pronounced acceleration in price gains over the past year.
Target Prices
Analysts show a positive outlook for both Equity Residential and Camden Property Trust with solid target price ranges.
| Company | Target Low | Target High | Consensus |
|---|---|---|---|
| Equity Residential | 63 | 78.5 | 71.41 |
| Camden Property Trust | 106 | 133 | 113.71 |
The target consensus for Equity Residential sits about 12% above its current price of 63.86, suggesting moderate upside potential. Camden Property Trust’s consensus target exceeds its 108.53 price by roughly 5%, indicating cautious optimism among analysts.

Don’t Let Luck Decide Your Entry Point
Optimize your entry points with our advanced ProRealTime indicators. You’ll get efficient buy signals with precise price targets for maximum performance. Start outperforming now!
How do institutions grade them?
The following tables summarize recent institutional grades for both companies:
Equity Residential Grades
Below are the most recent grades assigned by major institutions to Equity Residential:
| Grading Company | Action | New Grade | Date |
|---|---|---|---|
| Cantor Fitzgerald | Maintain | Neutral | 2026-02-09 |
| BMO Capital | Downgrade | Market Perform | 2026-01-09 |
| UBS | Maintain | Buy | 2026-01-08 |
| Barclays | Maintain | Overweight | 2025-11-25 |
| Mizuho | Maintain | Neutral | 2025-11-24 |
| Truist Securities | Maintain | Buy | 2025-11-17 |
| Morgan Stanley | Maintain | Equal Weight | 2025-11-13 |
| Wells Fargo | Maintain | Equal Weight | 2025-11-10 |
| UBS | Maintain | Buy | 2025-11-10 |
| Scotiabank | Maintain | Sector Perform | 2025-11-04 |
Camden Property Trust Grades
The table below shows recent institutional grades published for Camden Property Trust:
| Grading Company | Action | New Grade | Date |
|---|---|---|---|
| RBC Capital | Maintain | Sector Perform | 2026-02-10 |
| Cantor Fitzgerald | Maintain | Neutral | 2026-02-09 |
| Truist Securities | Maintain | Buy | 2026-01-20 |
| Barclays | Maintain | Equal Weight | 2026-01-13 |
| Mizuho | Maintain | Outperform | 2026-01-12 |
| UBS | Maintain | Neutral | 2026-01-08 |
| JP Morgan | Upgrade | Neutral | 2025-12-18 |
| Truist Securities | Maintain | Buy | 2025-12-15 |
| Barclays | Downgrade | Equal Weight | 2025-11-25 |
| Wells Fargo | Maintain | Equal Weight | 2025-11-25 |
Which company has the best grades?
Camden Property Trust generally holds stronger grades, including Outperform and Buy ratings. Equity Residential’s grades cluster around Neutral, Market Perform, and Buy. Investors might view Camden’s higher ratings as a signal of relatively greater confidence from analysts, potentially influencing portfolio preferences.
Risks specific to each company
The following categories identify the critical pressure points and systemic threats facing both firms in the 2026 market environment:
1. Market & Competition
Equity Residential
- Larger scale with 78,568 units, strong presence in high-demand urban markets.
Camden Property Trust
- Smaller portfolio of 56,850 units, growing with 7 properties under development.
2. Capital Structure & Debt
Equity Residential
- Debt-to-equity ratio moderate at 0.8, interest coverage ratio favorable at 5.58x.
Camden Property Trust
- Slightly higher debt-to-equity ratio of 0.89, infinite interest coverage reflects strong earnings.
3. Stock Volatility
Equity Residential
- Beta of 0.76 indicates lower volatility than the market.
Camden Property Trust
- Beta of 0.83 shows slightly higher sensitivity to market swings.
4. Regulatory & Legal
Equity Residential
- Operates in multiple states with complex residential regulations, no major legal flags reported.
Camden Property Trust
- Similar multi-state operations, recognized for workplace compliance and positive employee culture.
5. Supply Chain & Operations
Equity Residential
- Asset turnover low at 0.15, but fixed asset turnover strong at 6.82.
Camden Property Trust
- Asset turnover slightly higher at 0.19, fixed asset turnover weak at 0, indicating operational inefficiencies.
6. ESG & Climate Transition
Equity Residential
- Focus on community building, sustainability efforts implied but not quantified in data.
Camden Property Trust
- Recognized by Fortune for employee satisfaction, ESG efforts likely strong but less transparent.
7. Geopolitical Exposure
Equity Residential
- Concentrated in U.S. urban hubs, exposure to domestic economic cycles and policy changes.
Camden Property Trust
- Also U.S.-focused, with portfolio growth suggesting some geographic diversification within the country.
Which company shows a better risk-adjusted profile?
Equity Residential faces its largest risk from an extremely low liquidity position, with current and quick ratios at 0.05, a red flag for short-term financial flexibility. Camden Property Trust’s main risk lies in operational inefficiency, shown by its zero fixed asset turnover, signaling underutilized assets. Equity Residential’s stronger ROIC (219% vs. 4.5%) and favorable Altman Z-Score in the grey zone versus Camden’s distress zone suggest it manages its risks better despite liquidity concerns. However, Camden’s very strong Piotroski score and infinite interest coverage indicate solid earnings resilience. Overall, Equity Residential shows a better risk-adjusted profile, but investors must monitor its liquidity constraints closely.
Final Verdict: Which stock to choose?
Equity Residential’s superpower lies in its robust capital efficiency and value creation, evidenced by a very favorable moat with ROIC far exceeding WACC. Its main point of vigilance is a precariously low liquidity ratio, suggesting potential short-term stress. This stock suits portfolios focused on aggressive growth with a tolerance for operational risks.
Camden Property Trust’s strategic moat centers on recurring revenue stability and improving profitability, despite its weaker capital efficiency and value destruction signals. It offers a comparatively safer liquidity position but trades at a premium with less attractive valuation metrics. It fits well in GARP portfolios seeking steady growth with moderate risk.
If you prioritize capital efficiency and long-term value creation, Equity Residential outshines as the compelling choice due to its sustainable competitive advantage. However, if you seek income stability with less immediate operational risk, Camden Property Trust offers better stability and a more conservative growth profile. Both present distinct analytical scenarios for different investor risk appetites.
Disclaimer: Investment carries a risk of loss of initial capital. The past performance is not a reliable indicator of future results. Be sure to understand risks before making an investment decision.
Go Further
I encourage you to read the complete analyses of Equity Residential and Camden Property Trust to enhance your investment decisions: