Investors seeking promising opportunities in the technology sector often face tough choices between innovative software leaders. Cadence Design Systems, Inc. (CDNS) excels in electronic design automation, providing critical tools for chip design and verification. Workday, Inc. (WDAY), on the other hand, specializes in cloud-based enterprise applications, transforming financial and human capital management. This article will explore both companies’ strengths and market positions to help you identify the most compelling investment for your portfolio.
Table of contents
Companies Overview
I will begin the comparison between Cadence Design Systems, Inc. and Workday, Inc. by providing an overview of these two companies and their main differences.
Cadence Design Systems, Inc. Overview
Cadence Design Systems, Inc. specializes in software, hardware, and services for integrated circuit design and verification. The company offers platforms for functional verification, digital IC design, and custom IC simulation, serving markets such as 5G communications, aerospace, automotive, and healthcare. Based in San Jose, California, Cadence positions itself as a key player in semiconductor design tools and system analysis.
Workday, Inc. Overview
Workday, Inc. provides enterprise cloud applications focused on financial management, human capital management, and analytics. Its suite enables organizations to manage accounting, spend, workforce lifecycle, and reporting with machine learning enhancements. Headquartered in Pleasanton, California, Workday targets professional services, financial sectors, healthcare, education, and government industries with cloud-based business operation solutions.
Key similarities and differences
Both Cadence and Workday operate in the technology sector with a focus on software applications, but their business models differ significantly. Cadence centers on electronic design automation tools and hardware platforms for chip design, whereas Workday offers cloud-based enterprise applications for finance and human resources management. While Cadence serves hardware-centric markets, Workday targets diverse service industries with SaaS solutions.
Income Statement Comparison
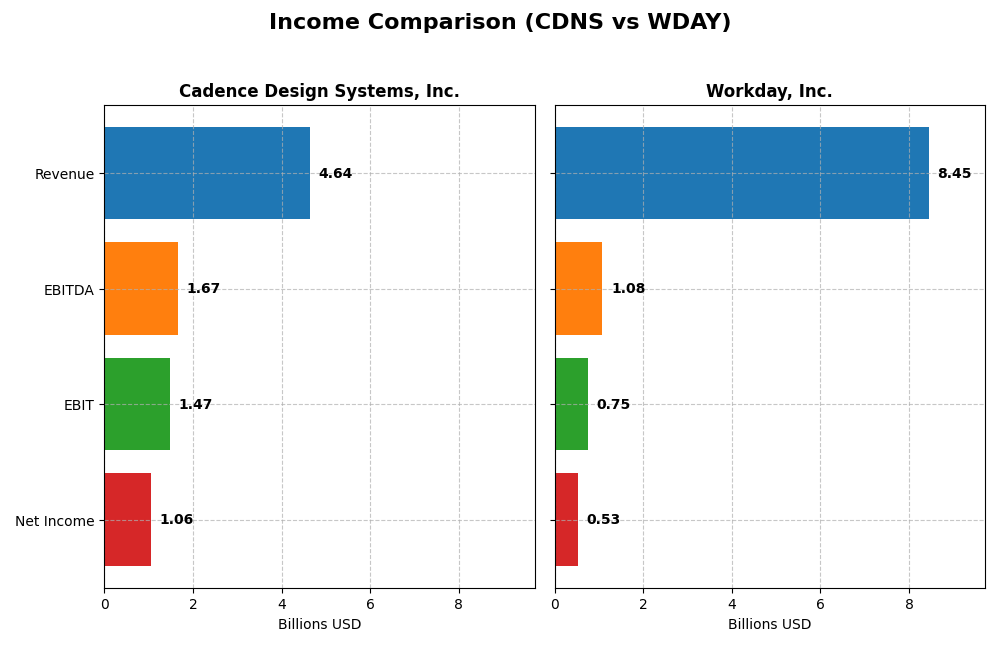
The table below compares the latest fiscal year income statement metrics for Cadence Design Systems, Inc. and Workday, Inc., providing a snapshot of their financial performance.
| Metric | Cadence Design Systems, Inc. | Workday, Inc. |
|---|---|---|
| Market Cap | 86.4B | 49.9B |
| Revenue | 4.64B | 8.45B |
| EBITDA | 1.67B | 1.08B |
| EBIT | 1.47B | 752M |
| Net Income | 1.06B | 526M |
| EPS | 3.89 | 1.98 |
| Fiscal Year | 2024 | 2025 |
Income Statement Interpretations
Cadence Design Systems, Inc.
Cadence Design Systems, Inc. showed consistent revenue growth from 2.68B in 2020 to 4.64B in 2024, with net income rising from 591M to 1.06B over the same period. Margins remained strong and stable, with a gross margin around 86% and net margin near 23%. In 2024, revenue growth slightly slowed to 13.5%, while net margin declined by 10.7%, signaling margin pressure despite favorable overall performance.
Workday, Inc.
Workday, Inc. experienced robust revenue growth from 4.32B in 2021 to 8.45B in 2025, with net income improving markedly from a loss of 282M to a profit of 526M. Gross margin held steady near 75.5%, but EBIT margin was modest at 8.9%. The 2025 fiscal year saw revenue rise 16.4%, EBIT surge 60%, yet net margin and EPS dropped sharply, indicating profitability challenges amid growth.
Which one has the stronger fundamentals?
Both companies exhibit favorable income statement trends with strong revenue and net income growth over their respective periods. Cadence benefits from higher and more stable margins, reflecting efficient cost control. Workday shows impressive growth and margin expansion overall but faces recent net margin and EPS declines. The stronger fundamentals depend on prioritizing margin stability versus rapid growth with volatility.
Financial Ratios Comparison
The table below presents a side-by-side comparison of key financial ratios for Cadence Design Systems, Inc. (CDNS) and Workday, Inc. (WDAY) based on their most recent fiscal year data.
| Ratios | Cadence Design Systems, Inc. (2024) | Workday, Inc. (2025) |
|---|---|---|
| ROE | 22.58% | 5.82% |
| ROIC | 13.43% | 2.73% |
| P/E | 77.20 | 132.15 |
| P/B | 17.44 | 7.69 |
| Current Ratio | 2.93 | 1.85 |
| Quick Ratio | 2.74 | 1.85 |
| D/E (Debt-to-Equity) | 0.55 | 0.37 |
| Debt-to-Assets | 28.8% | 18.7% |
| Interest Coverage | 17.77 | 3.64 |
| Asset Turnover | 0.52 | 0.47 |
| Fixed Asset Turnover | 7.68 | 5.36 |
| Payout ratio | 0 | 0 |
| Dividend yield | 0% | 0% |
Interpretation of the Ratios
Cadence Design Systems, Inc.
Cadence Design Systems exhibits strong financial ratios, with favorable net margin at 22.74%, ROE at 22.58%, and ROIC at 13.43%, indicating efficient profitability and capital use. Its liquidity is robust, shown by a current ratio of 2.93 and a quick ratio of 2.74, while leverage levels and interest coverage are also favorable. The company does not pay dividends, likely reflecting a reinvestment strategy or focus on growth.
Workday, Inc.
Workday’s ratios are more mixed; it shows neutral net margin at 6.23% but unfavorable returns on equity (5.82%) and invested capital (2.73%). Liquidity ratios like current and quick ratios are favorable, and debt metrics are well-managed, but valuation multiples such as PE and PB are high and unfavorable. Workday also does not pay dividends, possibly due to reinvestment priorities and growth focus.
Which one has the best ratios?
Cadence Design Systems holds a more favorable overall ratios profile with 57.14% favorable and 21.43% unfavorable ratios, compared to Workday’s balanced but less convincing 42.86% favorable and 42.86% unfavorable. Cadence’s stronger profitability, liquidity, and coverage ratios contrast with Workday’s weaker returns and stretched valuation metrics, suggesting a more robust financial position in this comparison.
Strategic Positioning
This section compares the strategic positioning of Cadence Design Systems, Inc. and Workday, Inc. in terms of Market position, Key segments, and Exposure to technological disruption:
Cadence Design Systems, Inc.
- Leading software provider in IC design with competitive pressure from specialized tech firms.
- Focuses on semiconductor design tools, IC verification, and system analysis serving 5G, automotive, and aerospace sectors.
- Faces disruption risks from evolving semiconductor design technologies and increasing integration complexity.
Workday, Inc.
- Cloud enterprise software leader with strong competition in financial and HCM applications.
- Concentrates on cloud financial management, HR, and analytics serving diverse industries globally.
- Exposed to rapid cloud innovation and AI-driven analytics transformation in enterprise software.
Cadence Design Systems, Inc. vs Workday, Inc. Positioning
Cadence has a diversified product range across semiconductor design and verification, benefiting multiple advanced tech markets. Workday centers on cloud enterprise applications with strong customer lifecycle management. Cadence’s broad IC ecosystem contrasts with Workday’s focused SaaS model, each with unique market dependencies.
Which has the best competitive advantage?
Cadence’s MOAT is slightly favorable due to value creation despite declining ROIC, while Workday’s MOAT is slightly unfavorable with value destruction but improving profitability, indicating Cadence currently holds a stronger competitive advantage.
Stock Comparison
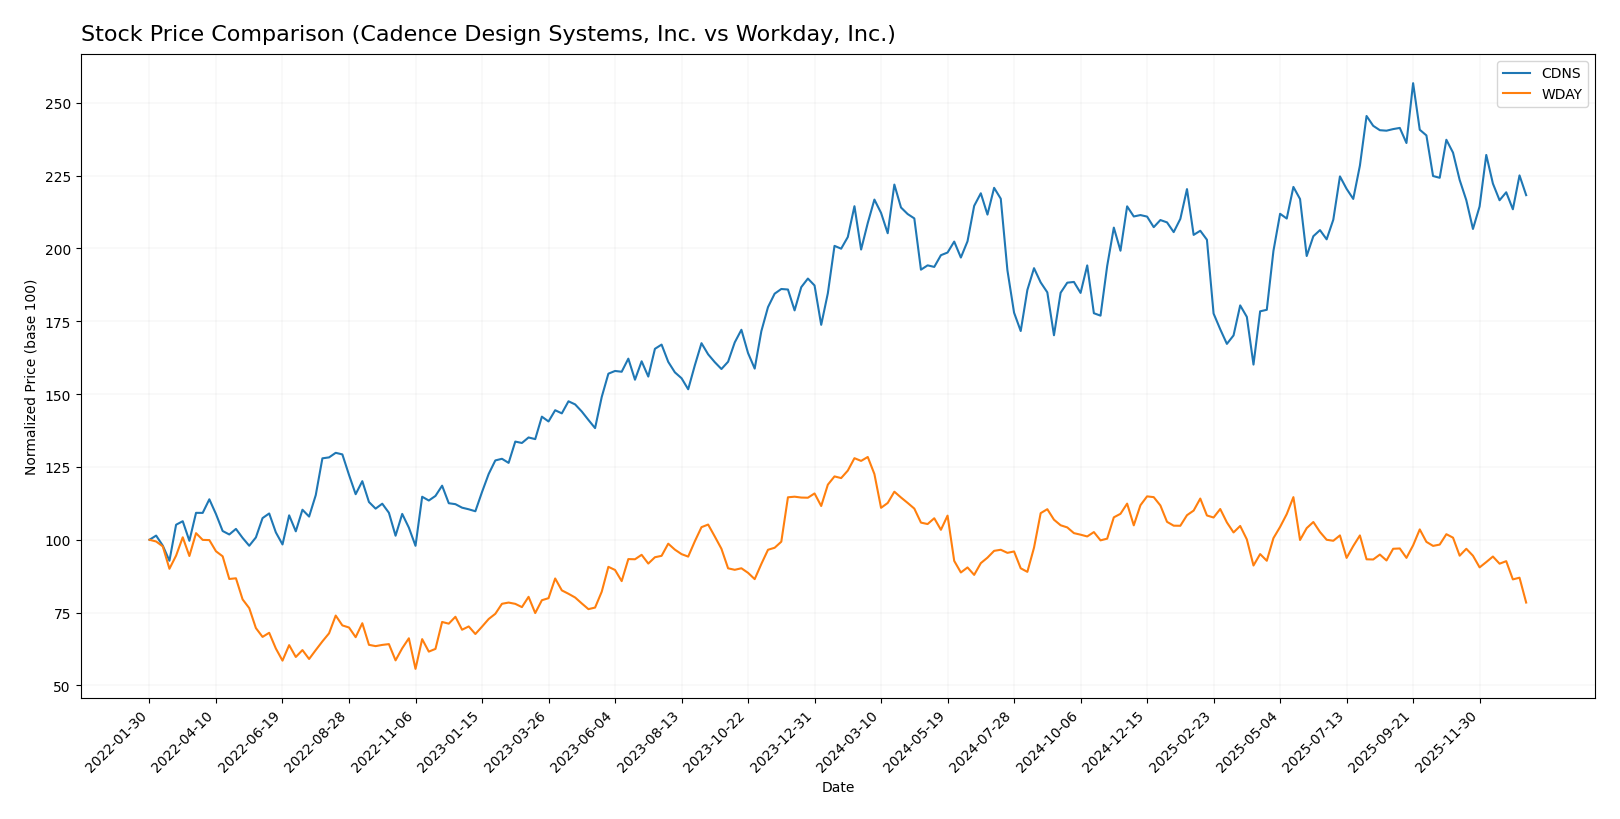
The stock price movements of Cadence Design Systems, Inc. (CDNS) and Workday, Inc. (WDAY) over the past 12 months reveal contrasting trends, with CDNS showing moderate gains and WDAY experiencing significant declines amid shifting trading volumes and seller dominance.
Trend Analysis
Cadence Design Systems, Inc. exhibited a bullish trend over the past 12 months with a 4.59% price increase, though the trend showed deceleration. The stock’s highest price reached 373.35, while volatility measured by standard deviation was 29.12.
Workday, Inc. recorded a bearish trend with a 38.91% price decrease over the same period, also with decelerating momentum. Its price ranged between 186.86 and 305.88, and volatility was lower than CDNS at 20.22 standard deviation.
Comparing the two, Cadence Design Systems delivered the highest market performance with a positive price change, contrasting with Workday’s substantial negative return over the last year.
Target Prices
The target price consensus for Cadence Design Systems, Inc. and Workday, Inc. reflects analyst optimism with a balanced range of expectations.
| Company | Target High | Target Low | Consensus |
|---|---|---|---|
| Cadence Design Systems, Inc. | 418 | 275 | 381 |
| Workday, Inc. | 320 | 235 | 274.47 |
Analysts expect Cadence’s stock to appreciate from the current 317.45 USD toward the consensus target of 381 USD, while Workday’s consensus target of 274.47 USD also suggests significant upside from its current price of 186.86 USD.
Analyst Opinions Comparison
This section compares analysts’ ratings and grades for Cadence Design Systems, Inc. (CDNS) and Workday, Inc. (WDAY):
Rating Comparison
CDNS Rating
- Rating: B, considered very favorable by analysts.
- Discounted Cash Flow Score: Moderate at 3, indicating balanced valuation expectations.
- ROE Score: Favorable at 4, showing efficient profit generation from equity.
- ROA Score: Very Favorable at 5, demonstrating excellent asset utilization.
- Debt To Equity Score: Moderate at 2, implying average financial risk exposure.
- Overall Score: Moderate at 3, representing a balanced overall financial standing.
WDAY Rating
- Rating: B-, also considered very favorable.
- Discounted Cash Flow Score: Favorable at 4, suggesting a stronger undervaluation signal.
- ROE Score: Moderate at 3, indicating average efficiency in generating profit from equity.
- ROA Score: Moderate at 3, reflecting average asset utilization effectiveness.
- Debt To Equity Score: Moderate at 2, showing similar financial risk profile.
- Overall Score: Moderate at 2, indicating slightly weaker overall financial standing.
Which one is the best rated?
Based strictly on the provided data, CDNS holds higher scores in ROE, ROA, and overall rating, while WDAY scores better on discounted cash flow. Overall, CDNS appears to have a stronger financial profile according to these metrics.
Scores Comparison
Here is a comparison of the Altman Z-Score and Piotroski Score for both companies:
CDNS Scores
- Altman Z-Score: 14.51, indicating a safe zone with very low bankruptcy risk.
- Piotroski Score: 7, classified as strong financial health.
WDAY Scores
- Altman Z-Score: 4.41, also in the safe zone, showing low bankruptcy risk.
- Piotroski Score: 6, considered average financial strength.
Which company has the best scores?
Based on the provided data, CDNS has a higher Altman Z-Score and a stronger Piotroski Score compared to WDAY, indicating comparatively better financial health and lower bankruptcy risk.
Grades Comparison
Here is a detailed comparison of the latest grading data for Cadence Design Systems, Inc. and Workday, Inc.:
Cadence Design Systems, Inc. Grades
The table below summarizes recent grades from reputable grading companies for Cadence Design Systems, Inc.:
| Grading Company | Action | New Grade | Date |
|---|---|---|---|
| Needham | Maintain | Buy | 2025-12-22 |
| Wells Fargo | Maintain | Overweight | 2025-10-28 |
| Baird | Maintain | Outperform | 2025-10-28 |
| Needham | Maintain | Buy | 2025-10-28 |
| JP Morgan | Maintain | Overweight | 2025-10-28 |
| Oppenheimer | Maintain | Underperform | 2025-10-28 |
| Rosenblatt | Maintain | Neutral | 2025-10-28 |
| Rosenblatt | Maintain | Neutral | 2025-10-22 |
| Needham | Maintain | Buy | 2025-07-29 |
| Loop Capital | Maintain | Buy | 2025-07-29 |
The overall trend for Cadence indicates predominantly positive grades, with multiple “Buy,” “Overweight,” and “Outperform” ratings, though there is some caution reflected by “Neutral” and one “Underperform” rating.
Workday, Inc. Grades
The table below summarizes recent grades from reputable grading companies for Workday, Inc.:
| Grading Company | Action | New Grade | Date |
|---|---|---|---|
| Barclays | Maintain | Overweight | 2026-01-12 |
| RBC Capital | Maintain | Outperform | 2026-01-05 |
| TD Cowen | Maintain | Buy | 2025-11-26 |
| DA Davidson | Maintain | Neutral | 2025-11-26 |
| Wells Fargo | Maintain | Overweight | 2025-11-26 |
| Barclays | Maintain | Overweight | 2025-11-26 |
| Keybanc | Maintain | Overweight | 2025-11-26 |
| Citigroup | Maintain | Neutral | 2025-11-26 |
| JP Morgan | Maintain | Overweight | 2025-11-26 |
| UBS | Maintain | Neutral | 2025-11-26 |
Workday’s grades predominantly feature “Overweight,” “Buy,” and “Outperform” ratings, with a balanced proportion of “Neutral” ratings, reflecting a generally favorable outlook with moderate caution.
Which company has the best grades?
Both Cadence Design Systems, Inc. and Workday, Inc. have received predominantly positive grades with consensus “Buy” ratings. Workday shows a higher volume of “Overweight” and “Buy” ratings from multiple firms, while Cadence displays a strong “Buy” presence but also includes a few more neutral and one underperform rating. This suggests Workday may currently have slightly stronger analyst support, potentially influencing investor confidence and portfolio positioning accordingly.
Strengths and Weaknesses
The table below compares key strengths and weaknesses of Cadence Design Systems, Inc. (CDNS) and Workday, Inc. (WDAY) based on recent financial performance, market presence, and innovation metrics.
| Criterion | Cadence Design Systems, Inc. (CDNS) | Workday, Inc. (WDAY) |
|---|---|---|
| Diversification | Moderate: Mainly in design software and tech services (4.2B product rev, 428M services rev in 2024) | Moderate: Focused on subscription and professional services (7.7B subscription rev, 728M services rev in 2025) |
| Profitability | Strong: 22.7% net margin, 22.6% ROE, ROIC 13.4%, creating value with slightly declining ROIC | Weaker: 6.2% net margin, 5.8% ROE, ROIC 2.7%, shedding value but improving profitability |
| Innovation | High: Consistent investment in new tech with favorable operating metrics, high fixed asset turnover | Moderate: Improving ROIC trend signals growing innovation, but overall profitability still low |
| Global presence | Strong: Well-established in global semiconductor and design markets | Strong: Large global SaaS presence but faces intense competition |
| Market Share | Leading in electronic design automation software | Significant in enterprise cloud HR software but market fragmented and competitive |
Key takeaways: Cadence excels in profitability and value creation despite a slight profitability decline, supported by solid innovation and global reach. Workday shows improving profitability trends but still struggles with value creation and faces tougher market competition. Both have focused portfolios, with Cadence emphasizing design tech and Workday SaaS services.
Risk Analysis
Below is a summary table outlining key risks for Cadence Design Systems, Inc. (CDNS) and Workday, Inc. (WDAY) based on the most recent data:
| Metric | Cadence Design Systems, Inc. (CDNS) | Workday, Inc. (WDAY) |
|---|---|---|
| Market Risk | Beta 1.02, moderate market volatility | Beta 1.14, higher market sensitivity |
| Debt Level | Debt-to-assets 28.8%, moderate debt | Debt-to-assets 18.7%, lower debt level |
| Regulatory Risk | Moderate, tech sector compliance | Moderate, cloud software regulations |
| Operational Risk | Strong operational metrics, low risk | Some inefficiencies (lower ROIC) |
| Environmental Risk | Low, typical tech industry exposure | Low, typical software sector exposure |
| Geopolitical Risk | US-based, moderate global exposure | US-based, moderate global exposure |
The most impactful risks are market sensitivity and valuation concerns. Workday shows higher beta, implying more price volatility, while Cadence has a more favorable operational profile but faces valuation headwinds with high P/E and P/B ratios. Both have manageable debt levels and low bankruptcy risk per Altman Z-Scores. Investors should weigh market fluctuations and valuation premiums carefully.
Which Stock to Choose?
Cadence Design Systems, Inc. (CDNS) shows favorable income evolution with strong revenue and net income growth over 2020-2024, supported by solid profitability metrics and a robust financial structure. Its global financial ratios evaluation is favorable, reflecting good liquidity, manageable debt, and high returns, while its rating is very favorable with a B grade. However, its ROIC trend is declining despite value creation, indicating slightly favorable moat status.
Workday, Inc. (WDAY) exhibits favorable income growth overall, though recent net margin and EPS growth have been negative. Its financial ratios present a neutral global evaluation with strengths in liquidity and debt management but weaker profitability ratios. The company’s rating is also very favorable at B-, yet its moat is slightly unfavorable due to value destruction, though its ROIC trend is improving.
For investors prioritizing growth, CDNS’s stable profitability and strong income growth might appear more attractive, especially given its very favorable ratings and consistent value creation despite a slight ROIC decline. Conversely, those more tolerant of risk and seeking potential turnaround opportunities might find WDAY’s improving profitability trend and neutral ratio profile worth consideration, given its recovering ROIC and very favorable rating.
Disclaimer: Investment carries a risk of loss of initial capital. The past performance is not a reliable indicator of future results. Be sure to understand risks before making an investment decision.
Go Further
I encourage you to read the complete analyses of Cadence Design Systems, Inc. and Workday, Inc. to enhance your investment decisions: