In the dynamic world of software applications, Cadence Design Systems, Inc. (CDNS) and Unity Software Inc. (U) stand out as innovators shaping distinct yet overlapping markets. Cadence specializes in advanced integrated circuit design and verification tools, while Unity leads in real-time 3D content creation platforms. Both companies drive technological progress with unique strategies, making this comparison essential for investors seeking growth and stability. Let’s explore which company offers the most compelling investment opportunity today.

Table of contents
Companies Overview
I will begin the comparison between Cadence Design Systems, Inc. and Unity Software Inc. by providing an overview of these two companies and their main differences.
Cadence Design Systems, Inc. Overview
Cadence Design Systems, Inc. specializes in software, hardware, and services for integrated circuit design and verification. It provides advanced tools for digital IC design, functional verification, and system analysis, serving industries such as 5G communications, aerospace, automotive, and healthcare. Headquartered in San Jose, California, Cadence is a well-established player in the semiconductor design market with a market cap of $86.4B.
Unity Software Inc. Overview
Unity Software Inc. develops a real-time 3D content platform used for creating, running, and monetizing interactive 2D and 3D content across multiple devices, including mobile, PC, consoles, and AR/VR. The company targets content creators, developers, and designers worldwide, operating from its San Francisco headquarters. Unity has a market cap of $17.5B and is recognized for enabling immersive digital experiences.
Key similarities and differences
Both companies operate in the technology sector focusing on software applications but serve distinct markets: Cadence targets semiconductor design and verification, while Unity focuses on interactive 3D content creation and monetization. Cadence has a larger market capitalization and a broader industrial customer base, whereas Unity emphasizes creative digital platforms and real-time content. Their business models differ fundamentally in end-user focus and product offerings.
Income Statement Comparison
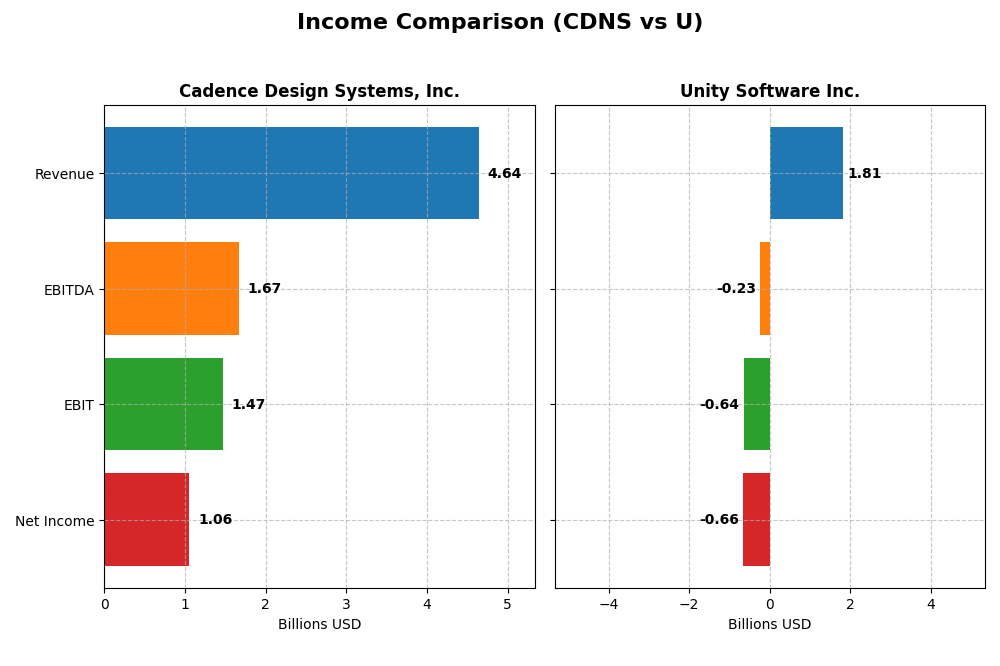
The table below summarizes the key income statement metrics for Cadence Design Systems, Inc. and Unity Software Inc. for the fiscal year 2024.
| Metric | Cadence Design Systems, Inc. | Unity Software Inc. |
|---|---|---|
| Market Cap | 86.4B | 17.5B |
| Revenue | 4.64B | 1.81B |
| EBITDA | 1.67B | -235M |
| EBIT | 1.47B | -644M |
| Net Income | 1.06B | -664M |
| EPS | 3.89 | -1.68 |
| Fiscal Year | 2024 | 2024 |
Income Statement Interpretations
Cadence Design Systems, Inc.
Cadence’s revenue rose steadily from $2.68B in 2020 to $4.64B in 2024, with net income increasing from $591M to $1.06B over the same period. Margins remained robust, with a gross margin of 86.05% and net margin at 22.74% in 2024. The latest year showed healthy revenue growth of 13.48%, though net margin dipped slightly, indicating some pressure on profitability.
Unity Software Inc.
Unity’s revenue more than doubled from $772M in 2020 to $1.81B in 2024 but declined by 17.1% in the last year. The company posted consistent net losses, with a net margin of -36.63% in 2024. Despite a 16.77% improvement in EBIT growth and better EPS growth last year, overall profitability remains negative, reflecting ongoing operational challenges.
Which one has the stronger fundamentals?
Cadence Design Systems exhibits stronger fundamentals with steady revenue and net income growth, favorable margins, and a positive overall income statement evaluation. Unity, while showing impressive revenue growth over the longer term, struggles with persistent net losses and unfavorable margins, resulting in a less favorable income statement outlook.
Financial Ratios Comparison
The table below presents a side-by-side comparison of key financial ratios for Cadence Design Systems, Inc. (CDNS) and Unity Software Inc. (U) based on their most recent fiscal year, 2024.
| Ratios | Cadence Design Systems, Inc. (CDNS) | Unity Software Inc. (U) |
|---|---|---|
| ROE | 22.6% | -20.8% |
| ROIC | 13.4% | -12.8% |
| P/E | 77.2 | -13.4 |
| P/B | 17.4 | 2.79 |
| Current Ratio | 2.93 | 2.50 |
| Quick Ratio | 2.74 | 2.50 |
| D/E | 0.55 | 0.74 |
| Debt-to-Assets | 28.8% | 34.9% |
| Interest Coverage | 17.8 | -32.1 |
| Asset Turnover | 0.52 | 0.27 |
| Fixed Asset Turnover | 7.68 | 18.3 |
| Payout ratio | 0 | 0 |
| Dividend yield | 0 | 0 |
Interpretation of the Ratios
Cadence Design Systems, Inc.
Cadence Design Systems shows mostly favorable financial ratios, including a strong net margin of 22.74% and return on equity at 22.58%, indicating solid profitability and efficient capital use. However, its high price-to-earnings ratio (77.2) and price-to-book ratio (17.44) suggest potentially overvalued stock. The company does not pay dividends, focusing on reinvestment and growth.
Unity Software Inc.
Unity Software displays weak profitability metrics, with negative net margin (-36.63%) and return on equity (-20.81%), reflecting ongoing losses and operational challenges. The firm has a favorable price-to-earnings ratio due to negative earnings, but unfavorable interest coverage and asset turnover raise concerns. Unity does not pay dividends, consistent with its high-growth investment strategy.
Which one has the best ratios?
Cadence Design Systems holds a more favorable overall ratio profile, with a majority of metrics positive and reflecting financial strength and profitability. Unity Software’s ratios are predominantly unfavorable, indicating higher risk and less operational efficiency. Thus, Cadence Design Systems currently presents the stronger ratio set between the two companies.
Strategic Positioning
This section compares the strategic positioning of Cadence Design Systems, Inc. and Unity Software Inc., focusing on Market position, Key segments, and Exposure to technological disruption:
Cadence Design Systems, Inc.
- Market leader in IC design software with strong competition in software applications.
- Key segments include IC design software, verification, and IP products serving diverse tech markets.
- Exposed to disruption from advances in chip design and real-time 3D technology innovation.
Unity Software Inc.
- Focused on interactive 2D/3D content platform amid high competition in real-time graphics.
- Key segments are Create and Operate solutions for real-time 2D/3D content across multiple devices.
- Faces disruption risks from rapid evolution in interactive content and AR/VR technology.
Cadence Design Systems, Inc. vs Unity Software Inc. Positioning
Cadence has a diversified approach targeting integrated circuit design and verification across multiple industries, offering broad product and service solutions. Unity concentrates on interactive 3D content creation and operation, focusing on software platforms for developers and artists. Cadence benefits from scale and breadth; Unity leverages specialization but has narrower revenue streams.
Which has the best competitive advantage?
Cadence exhibits a slightly favorable moat by creating value despite declining profitability, reflecting efficient capital use. Unity shows a very unfavorable moat, shedding value with decreasing returns, indicating weaker competitive advantage and capital efficiency.
Stock Comparison
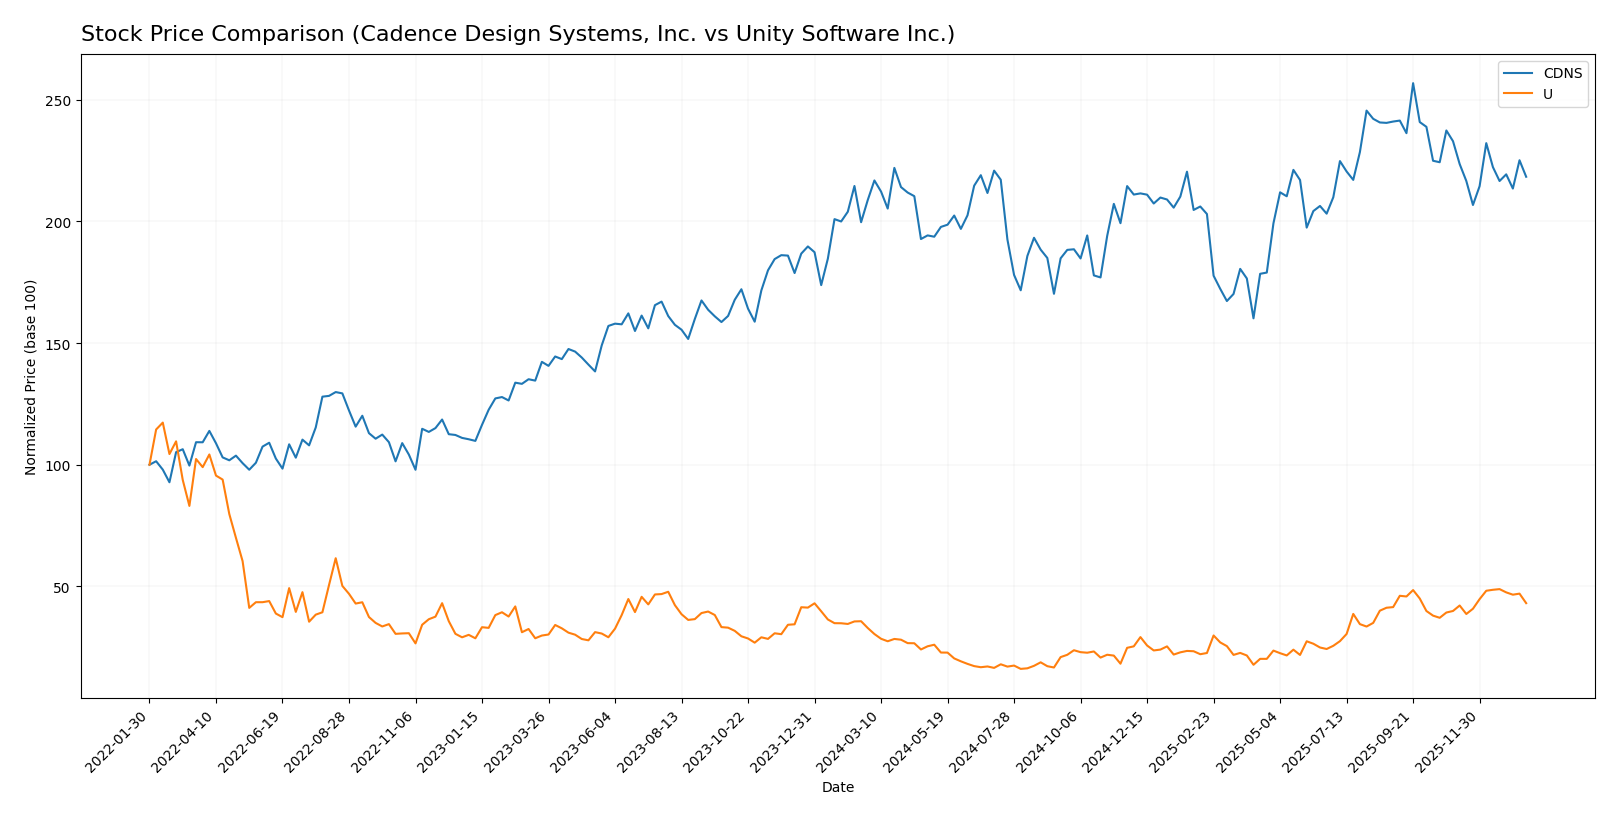
The stock price movements of Cadence Design Systems, Inc. (CDNS) and Unity Software Inc. (U) over the past 12 months reveal distinct trading dynamics, with CDNS showing moderate gains and deceleration, while U demonstrates a robust upward trajectory and accelerating momentum.
Trend Analysis
Cadence Design Systems, Inc. (CDNS) experienced a 4.59% price increase over the past 12 months, indicating a bullish trend with deceleration. The stock ranged between 232.88 and 373.35, with notable volatility (std deviation 29.12).
Unity Software Inc. (U) showed a strong 31.0% gain over the same period, reflecting a bullish trend with acceleration. Its price fluctuated from 15.32 to 46.42 and exhibited lower volatility (std deviation 9.04).
Comparing the two, Unity Software Inc. delivered the highest market performance with a 31.0% increase, significantly outperforming Cadence Design Systems, which rose 4.59%.
Target Prices
Here is the current consensus on target prices for Cadence Design Systems, Inc. and Unity Software Inc., reflecting analysts’ expectations.
| Company | Target High | Target Low | Consensus |
|---|---|---|---|
| Cadence Design Systems, Inc. | 418 | 275 | 381 |
| Unity Software Inc. | 60 | 39 | 50.98 |
Analysts expect Cadence’s stock to appreciate from its current price of $317.45 toward the $381 consensus target, indicating moderate upside potential. Unity’s consensus target of $50.98 suggests notable potential growth above its current price of $40.95.
Analyst Opinions Comparison
This section compares analysts’ ratings and grades for Cadence Design Systems, Inc. (CDNS) and Unity Software Inc. (U):
Rating Comparison
CDNS Rating
- Rating: B, classified as Very Favorable by analysts.
- Discounted Cash Flow Score: 3, indicating a moderate valuation based on cash flow.
- ROE Score: 4, showing favorable profit generation efficiency from equity.
- ROA Score: 5, rated very favorable for effective asset utilization.
- Debt To Equity Score: 2, moderate financial risk with some debt reliance.
- Overall Score: 3, reflecting a moderate overall financial standing.
U Rating
- Rating: D+, also considered Very Favorable despite low scores.
- Discounted Cash Flow Score: 1, signaling a very unfavorable valuation.
- ROE Score: 1, very unfavorable return on equity.
- ROA Score: 1, very unfavorable asset efficiency.
- Debt To Equity Score: 1, very unfavorable due to high financial risk.
- Overall Score: 1, very unfavorable overall financial health.
Which one is the best rated?
Based strictly on the provided data, CDNS is better rated overall with a B rating and higher scores in discounted cash flow, ROE, ROA, debt to equity, and overall financial standing compared to U, which has uniformly low scores and a D+ rating.
Scores Comparison
Here is a comparison of the Altman Z-Score and Piotroski Score for Cadence Design Systems, Inc. and Unity Software Inc.:
CDNS Scores
- Altman Z-Score: 14.5, indicating a safe zone status.
- Piotroski Score: 7, reflecting strong financial health.
U Scores
- Altman Z-Score: 2.93, placing it in the grey zone.
- Piotroski Score: 4, reflecting average financial health.
Which company has the best scores?
Based strictly on the provided data, CDNS has higher financial safety and strength scores than U. CDNS is in the safe zone for bankruptcy risk and strong in financial health, while U is in the grey zone and average for financial health.
Grades Comparison
Here is a comparison of the recent grades assigned to Cadence Design Systems, Inc. and Unity Software Inc.:
Cadence Design Systems, Inc. Grades
This table summarizes the latest grades from reputable grading companies for Cadence Design Systems, Inc.:
| Grading Company | Action | New Grade | Date |
|---|---|---|---|
| Needham | Maintain | Buy | 2025-12-22 |
| Wells Fargo | Maintain | Overweight | 2025-10-28 |
| Baird | Maintain | Outperform | 2025-10-28 |
| Needham | Maintain | Buy | 2025-10-28 |
| JP Morgan | Maintain | Overweight | 2025-10-28 |
| Oppenheimer | Maintain | Underperform | 2025-10-28 |
| Rosenblatt | Maintain | Neutral | 2025-10-28 |
| Rosenblatt | Maintain | Neutral | 2025-10-22 |
| Needham | Maintain | Buy | 2025-07-29 |
| Loop Capital | Maintain | Buy | 2025-07-29 |
Cadence’s grades predominantly reflect positive outlooks, with multiple “Buy,” “Overweight,” and “Outperform” ratings, though some neutral and one underperform grade appear.
Unity Software Inc. Grades
This table details recent grades from recognized grading firms for Unity Software Inc.:
| Grading Company | Action | New Grade | Date |
|---|---|---|---|
| Morgan Stanley | Maintain | Overweight | 2026-01-13 |
| Goldman Sachs | Maintain | Neutral | 2026-01-13 |
| Wells Fargo | Maintain | Overweight | 2026-01-08 |
| Jefferies | Maintain | Buy | 2026-01-05 |
| Piper Sandler | Upgrade | Overweight | 2025-12-11 |
| BTIG | Upgrade | Buy | 2025-12-11 |
| Wells Fargo | Upgrade | Overweight | 2025-12-05 |
| Arete Research | Upgrade | Buy | 2025-12-01 |
| Citigroup | Maintain | Buy | 2025-11-11 |
| Wells Fargo | Maintain | Equal Weight | 2025-11-07 |
Unity’s ratings show a positive trend with multiple upgrades and predominantly “Buy” and “Overweight” grades, alongside some neutral and equal weight ratings.
Which company has the best grades?
Both Cadence Design Systems and Unity Software have consensus ratings of “Buy,” but Cadence shows a broader mix including “Outperform” and “Overweight” ratings with fewer upgrades recently, while Unity displays recent upgrades and a consistent upward trend. This suggests Cadence maintains solid analyst confidence, whereas Unity is gaining positive momentum, potentially impacting investors by reflecting differing market perceptions and growth expectations.
Strengths and Weaknesses
Below is a comparative summary of key strengths and weaknesses for Cadence Design Systems, Inc. (CDNS) and Unity Software Inc. (U) based on their latest financial and strategic data.
| Criterion | Cadence Design Systems, Inc. (CDNS) | Unity Software Inc. (U) |
|---|---|---|
| Diversification | Strong product and maintenance revenue stream with growing technology services segment; solid balance between segments | Revenue split between Create and Operate Solutions; moderate diversification but heavily reliant on Operate Solutions |
| Profitability | High net margin (22.74%), ROIC (13.43%) well above WACC; company creates value despite a declining ROIC trend | Negative net margin (-36.63%), ROIC (-12.78%) below WACC; company is shedding value with declining profitability |
| Innovation | Established in EDA software with consistent investment in technology services; innovation supports strong fixed asset turnover | Rapid growth in fixed asset turnover (18.35) indicates operational efficiency, but profitability issues suggest challenges in monetization |
| Global presence | Broad international footprint typical of design software firms; favorable liquidity and financial health | Growing global reach in gaming and interactive platforms; decent liquidity but financial struggles limit expansion capacity |
| Market Share | Strong position in electronic design automation with stable and growing revenues (4.2B in product/maintenance in 2024) | Significant player in game development engines but revenue decline in Create Solutions signals competitive pressures |
Key takeaways: Cadence Design Systems exhibits robust profitability and a well-diversified revenue base, though its profitability is slightly declining. Unity Software faces significant profitability challenges and value destruction despite operational efficiency, suggesting higher investment risk.
Risk Analysis
Below is a comparison of key risk factors for Cadence Design Systems, Inc. (CDNS) and Unity Software Inc. (U) based on the latest 2024 data:
| Metric | Cadence Design Systems, Inc. (CDNS) | Unity Software Inc. (U) |
|---|---|---|
| Market Risk | Moderate (Beta 1.02) | High (Beta 2.05) |
| Debt Level | Moderate (Debt/Equity 0.55) | Moderate-High (Debt/Equity 0.74) |
| Regulatory Risk | Low, stable U.S. tech environment | Moderate, expanding global footprint |
| Operational Risk | Low, strong operational metrics | Elevated, negative margins and ROE |
| Environmental Risk | Low, standard for software industry | Low, standard for software industry |
| Geopolitical Risk | Moderate, exposed to global supply chains | Moderate, global sales exposure |
The most impactful risks are Unity’s high market volatility and operational losses, with a 36.6% net margin deficit and negative interest coverage indicating financial stress. Cadence’s risks are more moderate, with stable profitability but valuation concerns due to high P/E and P/B ratios. Investors should weigh Unity’s growth potential against its financial instability, while Cadence offers safer operational footing but at a premium valuation.
Which Stock to Choose?
Cadence Design Systems, Inc. (CDNS) shows a favorable income evolution with strong revenue and net income growth over 2020-2024, supported by robust profitability and efficient debt management. Its financial ratios are largely favorable, reflecting solid returns on equity (22.6%) and invested capital (13.4%), with a very favorable rating of B and strong scores on Altman Z and Piotroski. The company’s debt levels are moderate, and it maintains a slightly favorable moat despite a declining ROIC trend.
Unity Software Inc. (U) exhibits an unfavorable income evolution characterized by negative net margins and declining profitability over the same period, with significant losses despite revenue growth. Its financial ratios are mostly unfavorable, including negative returns on equity (-20.8%) and invested capital (-12.8%), and it holds a very unfavorable moat status. The company’s rating stands at D+ with average Piotroski and grey zone Altman Z scores, showing elevated financial risk and value destruction.
For investors prioritizing stability, profitability, and value creation, CDNS’s favorable income statement and financial ratios coupled with its strong rating might appear more suitable. Conversely, those with a higher risk tolerance or focused on growth might see potential in U’s accelerating bullish price trend despite its weaker fundamentals. Thus, the choice could depend on the investor’s risk profile and investment strategy.
Disclaimer: Investment carries a risk of loss of initial capital. The past performance is not a reliable indicator of future results. Be sure to understand risks before making an investment decision.
Go Further
I encourage you to read the complete analyses of Cadence Design Systems, Inc. and Unity Software Inc. to enhance your investment decisions: