In today’s dynamic technology landscape, Uber Technologies, Inc. and Cadence Design Systems, Inc. stand out as influential players driving innovation. Uber revolutionizes urban mobility and delivery services worldwide, while Cadence leads in advanced software and hardware solutions for integrated circuit design. Despite operating in distinct niches, both companies share a commitment to cutting-edge technology and expansive market reach. This article will help you decide which company holds the most promise for your investment portfolio.
Table of contents
Companies Overview
I will begin the comparison between Uber Technologies, Inc. and Cadence Design Systems, Inc. by providing an overview of these two companies and their main differences.
Uber Technologies, Inc. Overview
Uber Technologies, Inc. operates proprietary technology platforms worldwide, connecting consumers with independent providers of ride services, food delivery, and freight logistics. Founded in 2009 and headquartered in San Francisco, Uber’s business spans three segments: Mobility, Delivery, and Freight. It aims to facilitate transportation and delivery services using various vehicle types, offering solutions such as ridesharing, meal and grocery delivery, and freight shipping.
Cadence Design Systems, Inc. Overview
Cadence Design Systems, Inc. provides software, hardware, and services focused on integrated circuit (IC) design and verification. Since its incorporation in 1987, Cadence has specialized in tools for digital IC design, functional verification, custom IC simulation, and system design. Headquartered in San Jose, the company serves markets including 5G communications, aerospace, automotive, and consumer electronics, delivering solutions for chip development and verification.
Key similarities and differences
Both Uber and Cadence operate in the technology sector, specifically in software applications, but their business models differ substantially. Uber focuses on connecting consumers with transportation and delivery providers through digital platforms, generating revenue from service transactions. In contrast, Cadence develops and sells specialized software and hardware tools for semiconductor design and verification, targeting industrial and technological customers rather than consumers directly. Both companies are US-based with strong market presences in their respective niches.
Income Statement Comparison
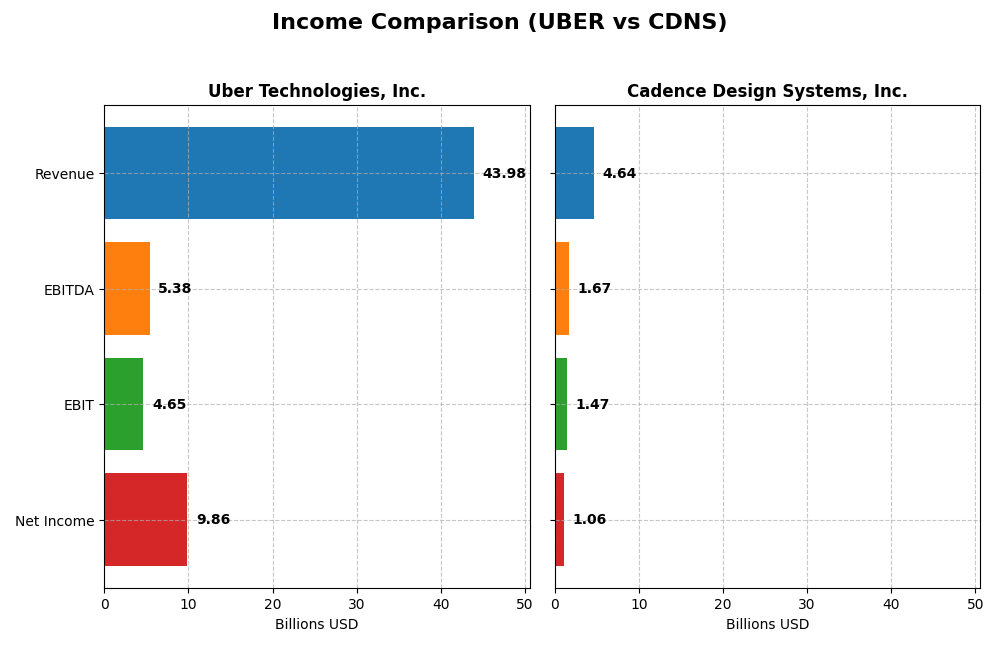
This table provides a side-by-side comparison of key income statement metrics for Uber Technologies, Inc. and Cadence Design Systems, Inc. for the fiscal year 2024.
| Metric | Uber Technologies, Inc. | Cadence Design Systems, Inc. |
|---|---|---|
| Market Cap | 176.4B | 86.4B |
| Revenue | 43.98B | 4.64B |
| EBITDA | 5.39B | 1.67B |
| EBIT | 4.65B | 1.47B |
| Net Income | 9.86B | 1.06B |
| EPS | 4.71 | 3.89 |
| Fiscal Year | 2024 | 2024 |
Income Statement Interpretations
Uber Technologies, Inc.
Uber’s revenue has grown significantly from $11.1B in 2020 to $43.98B in 2024, accompanied by a remarkable turnaround from a net loss of -$6.75B in 2020 to a net income of $9.86B in 2024. Margins improved notably, with gross margin at 39.4% and net margin expanding to 22.41%. The 2024 fiscal year saw strong revenue growth of 18% and a substantial net margin increase, reflecting improved profitability.
Cadence Design Systems, Inc.
Cadence’s revenue increased steadily from $2.68B in 2020 to $4.64B in 2024, with net income rising from $590M to $1.06B over the same period. Margins remain robust, with a gross margin above 86% and net margin around 22.74%. The 2024 year showed favorable revenue and EBIT growth, though net margin declined slightly by 10.66%, indicating some margin pressure despite overall income gains.
Which one has the stronger fundamentals?
Both companies demonstrate favorable income statement fundamentals, with Uber showing more dramatic growth and margin recovery, especially in net income and EPS. Cadence maintains higher gross and EBIT margins but faces slight net margin contraction recently. Uber’s rapid profitability improvements contrast with Cadence’s steadier, margin-focused performance, reflecting different strengths in their income profiles.
Financial Ratios Comparison
Below is a comparison of key financial ratios for Uber Technologies, Inc. and Cadence Design Systems, Inc. based on the most recent fiscal year 2024 data.
| Ratios | Uber Technologies, Inc. | Cadence Design Systems, Inc. |
|---|---|---|
| ROE | 45.7% | 22.6% |
| ROIC | 6.8% | 13.4% |
| P/E | 12.8 | 77.2 |
| P/B | 5.9 | 17.4 |
| Current Ratio | 1.07 | 2.93 |
| Quick Ratio | 1.07 | 2.74 |
| D/E (Debt to Equity) | 0.53 | 0.55 |
| Debt-to-Assets | 22.3% | 28.8% |
| Interest Coverage | 5.35 | 17.8 |
| Asset Turnover | 0.86 | 0.52 |
| Fixed Asset Turnover | 14.1 | 7.68 |
| Payout ratio | 0% | 0% |
| Dividend yield | 0% | 0% |
Interpretation of the Ratios
Uber Technologies, Inc.
Uber shows a mix of strong and neutral ratios, with favorable net margin at 22.41% and a high return on equity of 45.72%, indicating solid profitability. However, its price-to-book ratio of 5.86 is unfavorable, suggesting potential overvaluation. The current ratio at 1.07 is neutral, reflecting adequate liquidity. Uber does not pay dividends, reflecting a reinvestment strategy focused on growth and operational expansion.
Cadence Design Systems, Inc.
Cadence displays mostly favorable financial ratios, including a strong net margin of 22.74% and a solid return on invested capital of 13.43%. Its current ratio of 2.93 and interest coverage of 19.37 are also favorable, indicating good liquidity and debt service capability. The high price-to-earnings ratio of 77.2 is unfavorable, implying premium valuation. Cadence also does not pay dividends, prioritizing reinvestment and innovation.
Which one has the best ratios?
Cadence’s ratios lean more favorably overall, with 57.14% favorable metrics compared to Uber’s 50%. Despite Uber’s higher return on equity, Cadence offers better liquidity and lower risk in debt management. Both companies do not pay dividends, focusing on growth, but Cadence’s stronger operational ratios present a more consistently favorable financial profile in 2024.
Strategic Positioning
This section compares the strategic positioning of Uber Technologies, Inc. and Cadence Design Systems, Inc., focusing on market position, key segments, and exposure to disruption:
Uber Technologies, Inc.
- Global leader in ride-sharing and delivery, facing strong competition worldwide.
- Operates three segments: Mobility, Delivery, and Freight, driving revenue growth.
- Faces technological disruption from evolving mobility and logistics technologies.
Cadence Design Systems, Inc.
- Established provider of IC design software and services, competing in specialized tech sectors.
- Focused on software, hardware, and services for IC design and verification across multiple markets.
- Exposure to disruption via advances in chip design and verification technologies.
Uber Technologies, Inc. vs Cadence Design Systems, Inc. Positioning
Uber pursues a diversified strategy with multiple revenue streams in mobility, delivery, and freight, enabling broad market coverage. Cadence concentrates on specialized semiconductor design software and services, offering focused expertise but narrower market exposure.
Which has the best competitive advantage?
Cadence shows a slightly favorable moat, creating value despite declining profitability, indicating efficient capital use. Uber’s moat is slightly unfavorable, shedding value but improving profitability, reflecting challenges in sustaining competitive advantage.
Stock Comparison
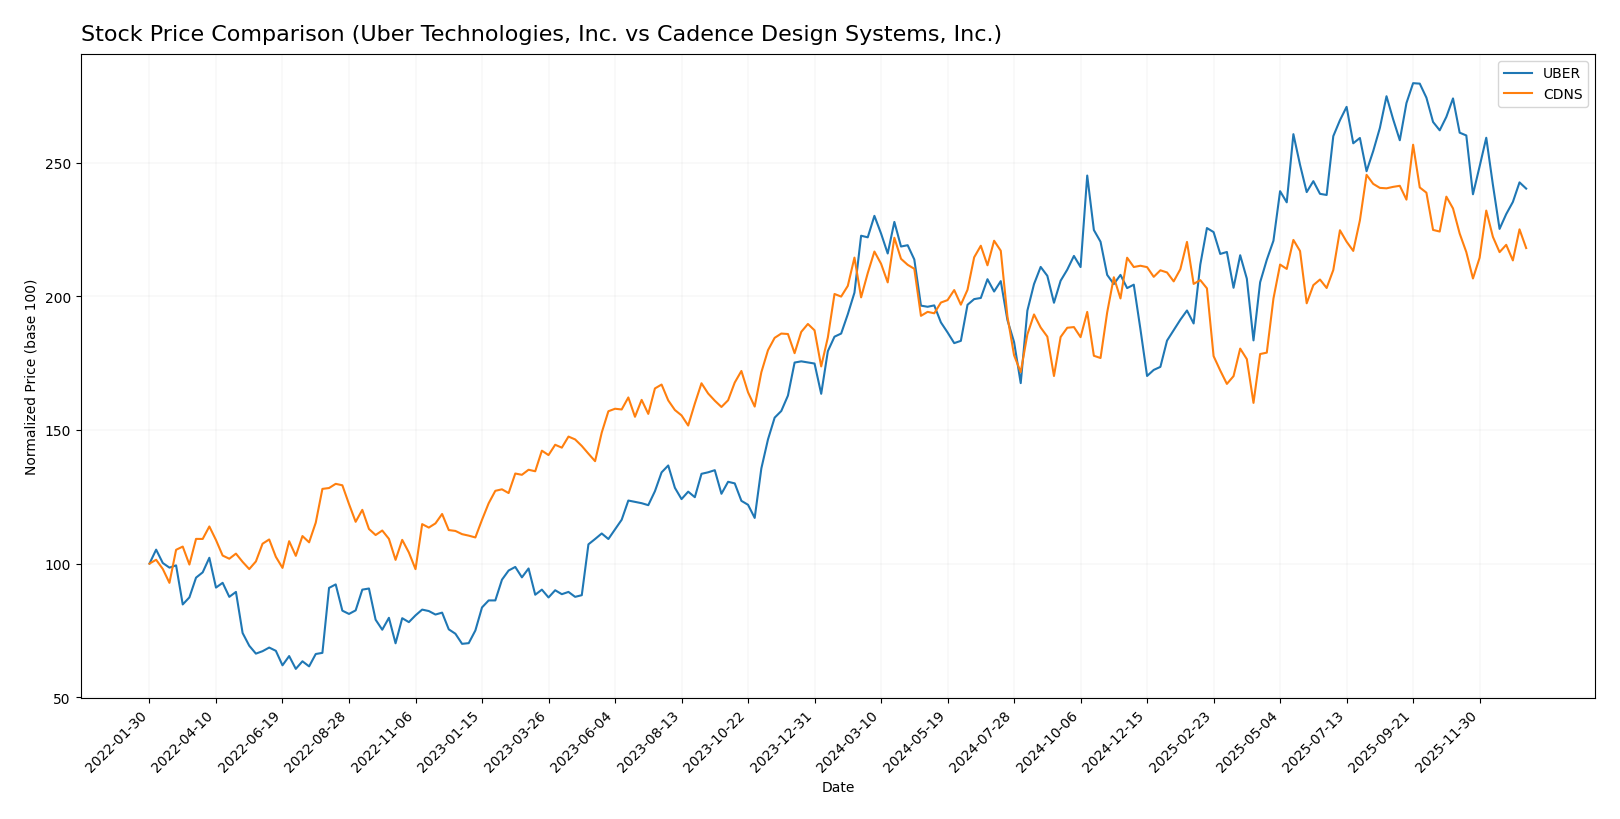
The past year saw both Uber Technologies, Inc. and Cadence Design Systems, Inc. exhibit bullish trends with decelerating momentum, marked by notable price fluctuations and recent downward corrections in trading dynamics.
Trend Analysis
Uber Technologies, Inc. recorded an 8.21% price increase over the past 12 months, indicating a bullish trend with deceleration in momentum. The stock ranged between 58.99 and 98.51, exhibiting a standard deviation of 10.29.
Cadence Design Systems, Inc. showed a 4.48% price gain over the same period, confirming a bullish but decelerating trend. Price volatility was higher with a 29.12 standard deviation, and prices fluctuated between 232.88 and 373.35.
Comparing both, Uber delivered a stronger market performance over the past year with a higher positive price change, despite recent short-term declines in both stocks.
Target Prices
Analysts present a strong target consensus for both Uber Technologies, Inc. and Cadence Design Systems, Inc.
| Company | Target High | Target Low | Consensus |
|---|---|---|---|
| Uber Technologies, Inc. | 140 | 73 | 111.26 |
| Cadence Design Systems, Inc. | 418 | 275 | 381 |
The consensus target for Uber is significantly above the current price of $84.9, indicating potential upside. Cadence’s consensus target of $381 also suggests room for growth compared to its current price at $317.32.
Analyst Opinions Comparison
This section compares analysts’ ratings and grades for Uber Technologies, Inc. and Cadence Design Systems, Inc.:
Rating Comparison
Uber Rating
- Rating: Both companies hold a “B” rating, indicating a very favorable status.
- Discounted Cash Flow Score: Low score of 1, considered very unfavorable for Uber.
- ROE Score: Strong performance with a top score of 5, very favorable for Uber.
- ROA Score: Both companies have a top score of 5, indicating very favorable asset utilization.
- Debt To Equity Score: Moderate score of 2 for Uber, indicating balanced financial risk.
- Overall Score: Both stand at a moderate score of 3, reflecting an average overall financial rating.
Cadence Rating
- Rating: Both companies hold a “B” rating, indicating a very favorable status.
- Discounted Cash Flow Score: Moderate score of 3, suggesting better valuation projections for Cadence.
- ROE Score: Favorable score of 4, slightly lower than Uber’s but still positive.
- ROA Score: Both companies have a top score of 5, indicating very favorable asset utilization.
- Debt To Equity Score: Same moderate score of 2 for Cadence, reflecting similar financial stability.
- Overall Score: Both stand at a moderate score of 3, reflecting an average overall financial rating.
Which one is the best rated?
Both Uber and Cadence share the same “B” rating and overall score of 3, indicating moderate financial standing. Uber excels in return on equity, whereas Cadence has a stronger discounted cash flow score, showing mixed strengths between them.
Scores Comparison
Here is the comparison of the Altman Z-Score and Piotroski Score for Uber and Cadence Design Systems:
Uber Scores
- Altman Z-Score: 4.44, indicating a safe zone and low bankruptcy risk.
- Piotroski Score: 6, classified as average financial strength.
Cadence Scores
- Altman Z-Score: 14.51, well within the safe zone, indicating very low bankruptcy risk.
- Piotroski Score: 7, indicating strong financial health.
Which company has the best scores?
Cadence shows a higher Altman Z-Score and a stronger Piotroski Score than Uber, suggesting Cadence has better financial stability and health based on these metrics.
Grades Comparison
Here is a comparison of the recent grades assigned to Uber Technologies, Inc. and Cadence Design Systems, Inc.:
Uber Technologies, Inc. Grades
This table summarizes the recent stock grades for Uber from verified grading companies.
| Grading Company | Action | New Grade | Date |
|---|---|---|---|
| BTIG | Maintain | Buy | 2026-01-15 |
| Wells Fargo | Maintain | Overweight | 2026-01-08 |
| Cantor Fitzgerald | Maintain | Overweight | 2026-01-08 |
| Wolfe Research | Maintain | Outperform | 2026-01-06 |
| Wedbush | Maintain | Neutral | 2025-12-19 |
| Morgan Stanley | Maintain | Overweight | 2025-12-08 |
| Arete Research | Upgrade | Buy | 2025-12-03 |
| Wells Fargo | Maintain | Overweight | 2025-11-05 |
| Guggenheim | Maintain | Buy | 2025-11-05 |
| DA Davidson | Maintain | Buy | 2025-11-05 |
Overall, Uber’s grades show a strong trend toward Buy and Overweight ratings, with multiple upgrades and no downgrades.
Cadence Design Systems, Inc. Grades
This table summarizes recent stock grades for Cadence Design Systems from recognized grading companies.
| Grading Company | Action | New Grade | Date |
|---|---|---|---|
| Needham | Maintain | Buy | 2025-12-22 |
| Wells Fargo | Maintain | Overweight | 2025-10-28 |
| Baird | Maintain | Outperform | 2025-10-28 |
| Needham | Maintain | Buy | 2025-10-28 |
| JP Morgan | Maintain | Overweight | 2025-10-28 |
| Oppenheimer | Maintain | Underperform | 2025-10-28 |
| Rosenblatt | Maintain | Neutral | 2025-10-28 |
| Rosenblatt | Maintain | Neutral | 2025-10-22 |
| Needham | Maintain | Buy | 2025-07-29 |
| Loop Capital | Maintain | Buy | 2025-07-29 |
Cadence’s grades are predominantly Buy and Overweight, but include some Neutral and one Underperform rating, indicating a more mixed outlook.
Which company has the best grades?
Uber Technologies, Inc. has received more consistently positive grades with multiple Buy and Overweight ratings and no negative grades, whereas Cadence Design Systems, Inc. shows a wider range including Neutral and Underperform. This suggests Uber is viewed more favorably by analysts, which may influence investor confidence and portfolio decisions accordingly.
Strengths and Weaknesses
Below is a comparison table highlighting key strengths and weaknesses of Uber Technologies, Inc. and Cadence Design Systems, Inc. based on recent financial and operational data.
| Criterion | Uber Technologies, Inc. | Cadence Design Systems, Inc. |
|---|---|---|
| Diversification | Strong diversification with Mobility, Delivery, and Freight segments generating $25.1B, $13.8B, and $5.1B respectively in 2024 | Focused primarily on product and technology services, generating $4.2B and $0.4B respectively in 2024 |
| Profitability | High net margin (22.41%) and ROE (45.72%), but ROIC (6.79%) below WACC (9.12%), indicating slight value destruction | Strong profitability with net margin (22.74%), ROE (22.58%), and ROIC (13.43%) exceeding WACC (8.44%), creating value |
| Innovation | Growing ROIC trend suggests improving operational efficiency despite current value shedding | Declining ROIC trend indicates some challenges in maintaining profitability growth despite value creation |
| Global presence | Extensive global footprint through multiple service segments and markets | Global presence in semiconductor software market but less diversified geographically |
| Market Share | Leading player in ride-sharing and delivery markets with expanding freight segment | Strong market position in electronic design automation software with steady revenue growth |
Key takeaways: Uber shows robust diversification and improving profitability metrics but still faces challenges in value creation. Cadence maintains strong profitability and market position, though its declining ROIC trend calls for cautious monitoring of future growth sustainability.
Risk Analysis
Below is a risk comparison table for Uber Technologies, Inc. and Cadence Design Systems, Inc. based on the most recent data from 2024.
| Metric | Uber Technologies, Inc. | Cadence Design Systems, Inc. |
|---|---|---|
| Market Risk | Beta 1.20, moderate volatility in ride-sharing and delivery sectors | Beta 1.02, moderate volatility tied to semiconductor industry cycles |
| Debt level | Debt-to-Equity 0.53, moderate leverage, interest coverage 8.89 (favorable) | Debt-to-Equity 0.55, similar leverage, interest coverage 19.37 (very favorable) |
| Regulatory Risk | High, due to ongoing legal challenges in multiple jurisdictions worldwide | Moderate, subject to tech export controls and IP regulations |
| Operational Risk | Medium, reliant on gig economy workforce and platform stability | Medium, dependent on continuous innovation and software reliability |
| Environmental Risk | Moderate, growing focus on emissions and sustainability in transportation | Low, limited direct environmental impact |
| Geopolitical Risk | Moderate, exposure to global markets with diverse regulations | Moderate, exposure to global supply chains and trade policies |
The most impactful risks are Uber’s regulatory challenges and Cadence’s valuation concerns. Uber faces increasing scrutiny in many regions, which could affect operations and costs. Cadence, while financially stable with strong debt coverage, carries high valuation multiples (P/E ~77), posing risk if market conditions shift. Both maintain safe financial zones, but investors should watch regulatory developments for Uber and market sentiment for Cadence.
Which Stock to Choose?
Uber Technologies, Inc. shows a strong income evolution with a 295% revenue growth over five years and a very favorable net margin of 22.41%. Its financial ratios are slightly favorable overall, supported by high ROE (45.72%) and solid interest coverage, despite a neutral debt profile. The company has a slightly unfavorable moat status, indicating value destruction but improving profitability, and holds a very favorable rating with a strong Altman Z-Score in the safe zone.
Cadence Design Systems, Inc. demonstrates favorable income growth with 73% revenue increase over five years and a 22.74% net margin. Its financial ratios are favorable overall, featuring robust ROIC (13.43%) and strong liquidity ratios. Cadence has a slightly favorable moat status, reflecting value creation despite a declining ROIC trend. The company also holds a very favorable rating, with a strong Altman Z-Score and a strong Piotroski score.
Investors focused on growth might find Uber’s accelerating profitability and high ROE appealing, while those prioritizing stable value creation and solid liquidity could view Cadence’s consistent income and favorable financial ratios as attractive. The choice might depend on the investor’s risk tolerance and strategy emphasis.
Disclaimer: Investment carries a risk of loss of initial capital. The past performance is not a reliable indicator of future results. Be sure to understand risks before making an investment decision.
Go Further
I encourage you to read the complete analyses of Uber Technologies, Inc. and Cadence Design Systems, Inc. to enhance your investment decisions: