In the dynamic world of software applications, Cadence Design Systems, Inc. (CDNS) and Tyler Technologies, Inc. (TYL) stand out as influential players with distinct market focuses. Cadence leads in integrated circuit design tools and verification platforms, while Tyler specializes in public sector management software. Both companies innovate in their niches, offering growth potential through technology-driven solutions. This article will help you determine which company presents the most compelling investment opportunity in 2026.
Table of contents
Companies Overview
I will begin the comparison between Cadence Design Systems, Inc. and Tyler Technologies, Inc. by providing an overview of these two companies and their main differences.
Cadence Design Systems, Inc. Overview
Cadence Design Systems, Inc. focuses on providing software, hardware, and services for integrated circuit (IC) design and verification worldwide. The company offers products covering digital IC design, system design, and intellectual property, serving markets such as 5G communications, automotive, aerospace, and industrial sectors. Headquartered in San Jose, California, Cadence is a key player in the semiconductor and electronic design automation industry.
Tyler Technologies, Inc. Overview
Tyler Technologies, Inc. delivers integrated information management software and services specifically tailored for the public sector. The company’s solutions cover financial management, judicial and public safety systems, appraisal and tax management, and school administration. Based in Plano, Texas, Tyler Technologies supports government agencies and educational institutions with software designed to automate and streamline their operations.
Key similarities and differences
Both companies operate within the software application industry but target distinct markets: Cadence serves high-tech hardware design and verification sectors, while Tyler focuses on public sector software solutions. Cadence has a larger workforce and market capitalization, reflecting its broader technology scope. Tyler emphasizes government and education systems with cloud collaboration, whereas Cadence specializes in semiconductor design tools and IP products.
Income Statement Comparison
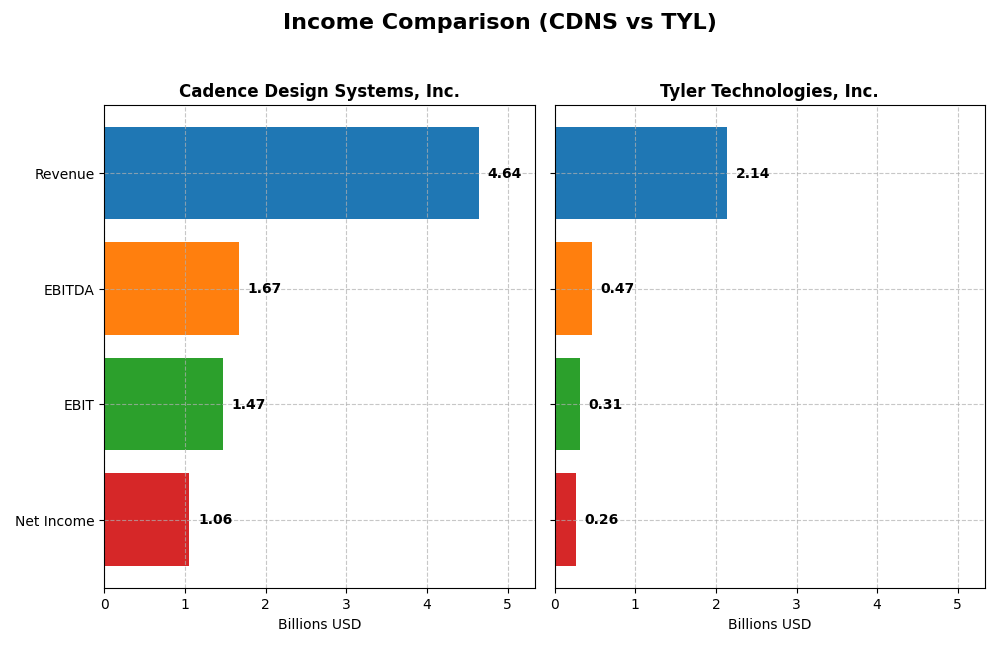
Below is a comparison of key income statement metrics for Cadence Design Systems, Inc. and Tyler Technologies, Inc. for the fiscal year 2024.
| Metric | Cadence Design Systems, Inc. | Tyler Technologies, Inc. |
|---|---|---|
| Market Cap | 86.4B | 18.9B |
| Revenue | 4.64B | 2.14B |
| EBITDA | 1.67B | 466M |
| EBIT | 1.47B | 314M |
| Net Income | 1.06B | 263M |
| EPS | 3.89 | 6.17 |
| Fiscal Year | 2024 | 2024 |
Income Statement Interpretations
Cadence Design Systems, Inc.
Cadence’s revenue and net income have shown strong growth from 2020 to 2024, with revenue increasing from $2.68B to $4.64B and net income rising from $591M to $1.06B. Gross and EBIT margins remain favorable at 86.05% and 31.71%, respectively. In 2024, revenue growth slowed to 13.48% but margins held steady, supporting stable profitability.
Tyler Technologies, Inc.
Tyler’s revenue also grew significantly over the period, from $1.12B in 2020 to $2.14B in 2024, with net income climbing from $195M to $263M. Margins remain favorable, though gross margin at 40.98% and EBIT margin at 14.69% are lower than Cadence’s. The latest year saw a 9.53% revenue increase and a notable 44.73% net margin growth, indicating improved operational efficiency.
Which one has the stronger fundamentals?
Both companies exhibit favorable income statement fundamentals with strong revenue growth and positive margin trends. Cadence leads in absolute scale and margin levels, while Tyler shows higher recent margin expansion and EPS growth. Cadence’s more stable net margin contrasts with Tyler’s wider fluctuations. Overall, both demonstrate solid profitability but differ in scale and margin consistency.
Financial Ratios Comparison
The table below presents a side-by-side comparison of key financial ratios for Cadence Design Systems, Inc. (CDNS) and Tyler Technologies, Inc. (TYL) for the fiscal year 2024.
| Ratios | Cadence Design Systems, Inc. (CDNS) | Tyler Technologies, Inc. (TYL) |
|---|---|---|
| ROE | 22.58% | 7.76% |
| ROIC | 13.43% | 6.20% |
| P/E | 77.20 | 93.42 |
| P/B | 17.44 | 7.25 |
| Current Ratio | 2.93 | 1.35 |
| Quick Ratio | 2.74 | 1.35 |
| D/E | 0.55 | 0.19 |
| Debt-to-Assets | 28.80% | 12.32% |
| Interest Coverage | 17.77 | 50.50 |
| Asset Turnover | 0.52 | 0.41 |
| Fixed Asset Turnover | 7.68 | 10.95 |
| Payout ratio | 0 | 0 |
| Dividend yield | 0% | 0% |
Interpretation of the Ratios
Cadence Design Systems, Inc.
Cadence Design Systems presents a largely favorable ratio profile with strong net margin (22.74%), ROE (22.58%), and ROIC (13.43%), supported by a solid current ratio of 2.93 and low debt-to-assets of 28.8%. However, high P/E (77.2) and P/B (17.44) ratios raise valuation concerns. The company does not pay dividends, likely prioritizing reinvestment and growth.
Tyler Technologies, Inc.
Tyler Technologies shows mixed ratios: a favorable net margin of 12.3% and strong interest coverage (52.96), but a weak ROE (7.76%) and asset turnover (0.41) that may indicate operational inefficiency. The P/E ratio is high at 93.42. Tyler does not pay dividends, possibly reflecting reinvestment or growth focus in its business model.
Which one has the best ratios?
Cadence Design Systems holds the advantage with a higher proportion of favorable ratios (57.14%) compared to Tyler’s 50%, especially in profitability and liquidity metrics. Tyler’s weaker ROE and asset turnover, alongside its higher unfavorable ratio share, suggest relatively less robust financial health. Overall, Cadence’s ratios appear more balanced and favorable.
Strategic Positioning
This section compares the strategic positioning of Cadence Design Systems, Inc. and Tyler Technologies, Inc. regarding market position, key segments, and exposure to technological disruption:
Cadence Design Systems, Inc.
- Large market cap of 86.4B with competitive pressure in software application industry
- Key segments include IC design software, functional verification, and IP products serving diverse tech markets
- Exposure to disruption through advanced chip design tools and software innovation in semiconductor verification
Tyler Technologies, Inc.
- Market cap of 18.9B focused on public sector software with moderate competition
- Segments cover enterprise software, appraisal and tax, SaaS, and transaction fees for public sector clients
- Faces disruption risks from cloud adoption and evolving public sector software needs, partnering with AWS
Cadence Design Systems, Inc. vs Tyler Technologies, Inc. Positioning
Cadence has a diversified technology focus across multiple high-tech markets, leveraging hardware and software integration, while Tyler concentrates on integrated public sector solutions with a narrower market scope. Cadence’s broader segment spread offers varied business drivers compared to Tyler’s specialized approach.
Which has the best competitive advantage?
Cadence exhibits a slightly favorable moat with value creation despite declining ROIC, indicating some sustainable competitive advantage. Tyler shows a very unfavorable moat with value destruction and declining profitability, suggesting weaker competitive positioning.
Stock Comparison
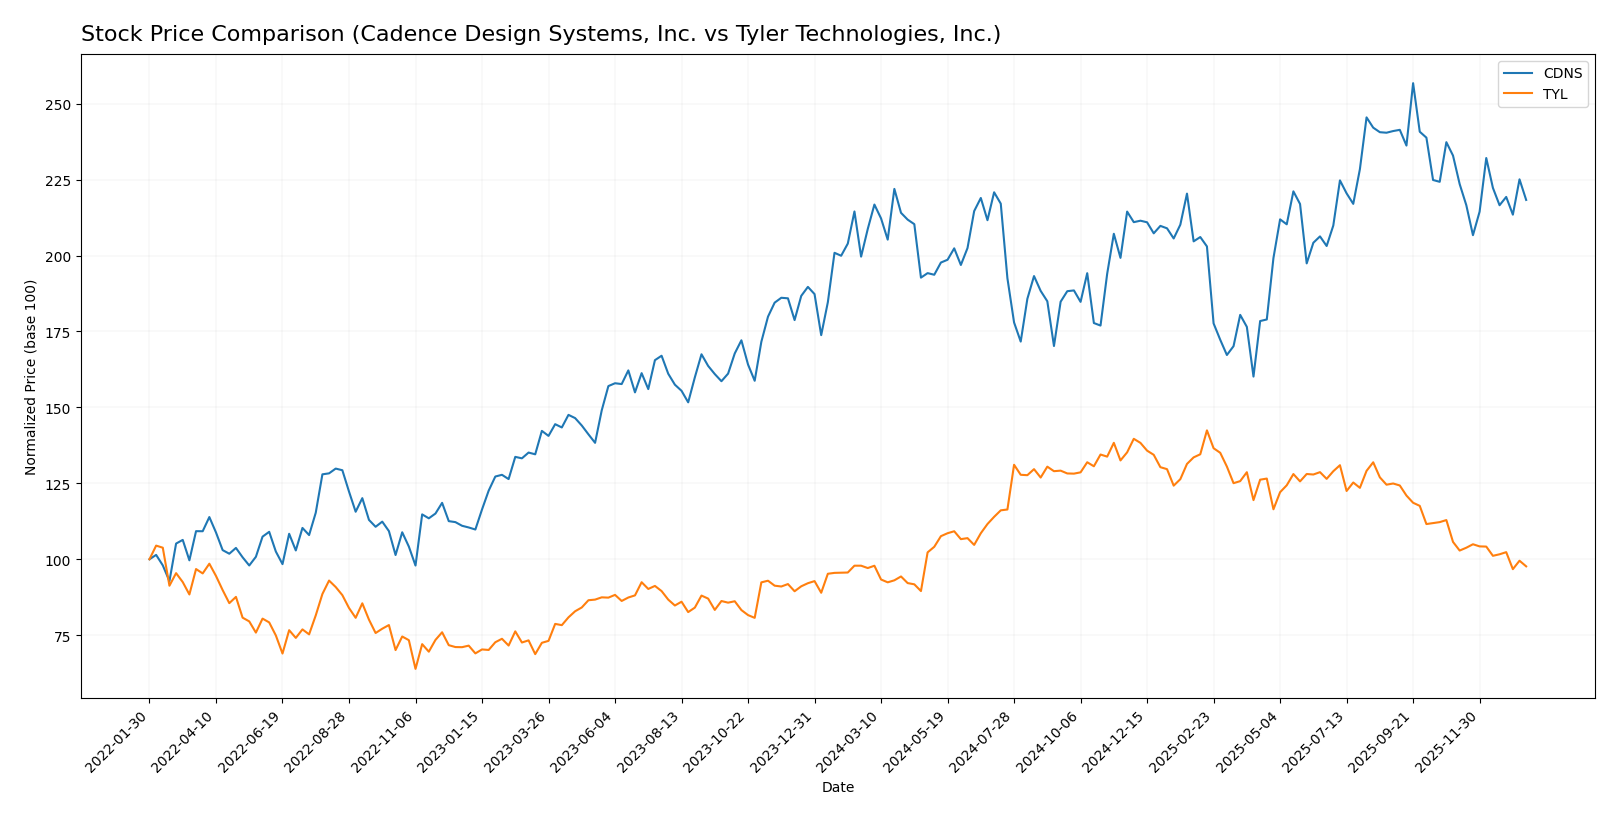
The stock price chart reveals contrasting price movements and trading dynamics for Cadence Design Systems, Inc. and Tyler Technologies, Inc. over the past 12 months, highlighting a generally bullish but decelerating trend for both with recent weakening.
Trend Analysis
Cadence Design Systems, Inc. (CDNS) exhibited a 4.59% price increase over the past year, indicating a bullish trend with deceleration. The stock ranged from a low of 232.88 to a high of 373.35, showing moderate volatility with a standard deviation of 29.12.
Tyler Technologies, Inc. (TYL) posted a 0.58% price increase over the same period, reflecting a neutral to mildly bullish trend with deceleration. Its price ranged from 403.35 to 641.7, showing higher volatility with a standard deviation of 61.82.
Comparatively, Cadence Design Systems delivered the highest market performance with a stronger overall price increase, despite both stocks experiencing recent declines and seller dominance in trading volumes.
Target Prices
The current target price consensus for Cadence Design Systems, Inc. and Tyler Technologies, Inc. reflects bullish analyst expectations.
| Company | Target High | Target Low | Consensus |
|---|---|---|---|
| Cadence Design Systems, Inc. | 418 | 275 | 381 |
| Tyler Technologies, Inc. | 675 | 470 | 584 |
Analysts project upside potential for both stocks, with Cadence’s consensus target about 20% above its current price of 317.45 USD, and Tyler Technologies’ consensus target roughly 33% above its current price of 440.01 USD. This indicates positive market sentiment for these technology firms.
Analyst Opinions Comparison
This section compares analysts’ ratings and grades for Cadence Design Systems, Inc. and Tyler Technologies, Inc.:
Rating Comparison
CDNS Rating
- Rating: B, classified as Very Favorable overall rating.
- Discounted Cash Flow Score: Moderate at 3, indicating average valuation outlook.
- ROE Score: Favorable at 4, reflecting efficient profit generation from equity.
- ROA Score: Very Favorable at 5, excellent asset utilization.
- Debt To Equity Score: Moderate at 2, implying moderate financial risk.
TYL Rating
- Rating: B, also classified as Very Favorable overall rating.
- Discounted Cash Flow Score: Favorable at 4, suggesting a better valuation.
- ROE Score: Moderate at 3, showing average efficiency in profit from equity.
- ROA Score: Favorable at 4, indicating good asset utilization.
- Debt To Equity Score: Moderate at 3, indicating slightly higher financial risk.
Which one is the best rated?
Both CDNS and TYL share the same overall rating of B and a moderate overall score of 3. CDNS excels in return on assets and equity, while TYL scores better in discounted cash flow and debt to equity. Their ratings are comparable but differ in specific strengths.
Scores Comparison
The scores comparison between Cadence Design Systems and Tyler Technologies is as follows:
CDNS Scores
- Altman Z-Score of 14.51 indicates a very strong financial safety.
- Piotroski Score of 7 reflects strong financial health.
TYL Scores
- Altman Z-Score of 7.42 shows a strong position in the safe zone.
- Piotroski Score of 6 suggests average financial strength.
Which company has the best scores?
Cadence Design Systems shows higher scores in both Altman Z-Score and Piotroski Score, indicating stronger financial stability and health than Tyler Technologies based on the provided data.
Grades Comparison
Here is a comparison of recent grades assigned by established grading companies for Cadence Design Systems, Inc. and Tyler Technologies, Inc.:
Cadence Design Systems, Inc. Grades
The following table summarizes recent analyst ratings from reputable grading firms for Cadence Design Systems, Inc.:
| Grading Company | Action | New Grade | Date |
|---|---|---|---|
| Needham | Maintain | Buy | 2025-12-22 |
| Wells Fargo | Maintain | Overweight | 2025-10-28 |
| Baird | Maintain | Outperform | 2025-10-28 |
| Needham | Maintain | Buy | 2025-10-28 |
| JP Morgan | Maintain | Overweight | 2025-10-28 |
| Oppenheimer | Maintain | Underperform | 2025-10-28 |
| Rosenblatt | Maintain | Neutral | 2025-10-28 |
| Rosenblatt | Maintain | Neutral | 2025-10-22 |
| Needham | Maintain | Buy | 2025-07-29 |
| Loop Capital | Maintain | Buy | 2025-07-29 |
The overall grades for Cadence Design Systems show a predominance of Buy and Overweight ratings, indicating generally positive analyst sentiment with isolated neutral and underperform views.
Tyler Technologies, Inc. Grades
The following table presents recent analyst ratings from credible grading firms for Tyler Technologies, Inc.:
| Grading Company | Action | New Grade | Date |
|---|---|---|---|
| Piper Sandler | Maintain | Overweight | 2026-01-13 |
| Wells Fargo | Maintain | Equal Weight | 2026-01-08 |
| DA Davidson | Maintain | Neutral | 2025-12-09 |
| Evercore ISI Group | Maintain | In Line | 2025-10-31 |
| DA Davidson | Maintain | Neutral | 2025-10-31 |
| DA Davidson | Maintain | Neutral | 2025-10-10 |
| DA Davidson | Maintain | Neutral | 2025-08-05 |
| Barclays | Maintain | Overweight | 2025-07-31 |
| Needham | Maintain | Buy | 2025-05-13 |
| Barclays | Maintain | Overweight | 2025-04-25 |
Tyler Technologies’ grades show a mix of Overweight and Neutral ratings, with fewer Buy ratings compared to Cadence, reflecting a more cautious analyst stance.
Which company has the best grades?
Cadence Design Systems, Inc. has received a higher proportion of Buy and Outperform ratings compared to Tyler Technologies, Inc., which features more Neutral and Equal Weight grades. This suggests Cadence is viewed more favorably by analysts, potentially signaling stronger expected performance or confidence, which investors might consider when evaluating risk and opportunity profiles.
Strengths and Weaknesses
Below is a comparative overview of key strengths and weaknesses for Cadence Design Systems, Inc. (CDNS) and Tyler Technologies, Inc. (TYL) based on recent financial and operational data.
| Criterion | Cadence Design Systems, Inc. (CDNS) | Tyler Technologies, Inc. (TYL) |
|---|---|---|
| Diversification | Strong product and maintenance segment with growing technology services; diversified revenue streams | Moderate diversification with SaaS, transaction fees, maintenance, and professional services; less hardware exposure |
| Profitability | High net margin (22.7%) and ROIC (13.4%), creating value though with declining trend | Moderate net margin (12.3%) and neutral ROIC (6.2%), but profitability is declining and value is being lost |
| Innovation | Significant investment reflected in high P/E (77.2) and strong product demand; innovation-driven growth | Innovation reflected in SaaS and platform technologies, but higher P/E (93.4) and declining ROIC indicate challenges |
| Global presence | Established global footprint with strong asset turnover and financial stability | Focused primarily on U.S. public sector markets with less asset turnover but strong interest coverage |
| Market Share | Leading position in electronic design automation with steady revenue growth (4.2B in product sales 2024) | Leading provider in public sector software with revenue of over 2B across segments but slower growth |
Key takeaways: CDNS shows strong profitability and diversification with solid value creation despite a declining ROIC trend. TYL faces profitability challenges and declining returns but maintains a specialized market position. Both companies require cautious monitoring of profitability trends for investment decisions.
Risk Analysis
Below is a comparative table summarizing key risks for Cadence Design Systems, Inc. (CDNS) and Tyler Technologies, Inc. (TYL) based on the most recent data from 2024-2026.
| Metric | Cadence Design Systems, Inc. (CDNS) | Tyler Technologies, Inc. (TYL) |
|---|---|---|
| Market Risk | Moderate (Beta 1.02, tech sector volatility) | Moderate (Beta 0.92, stable public sector demand) |
| Debt level | Moderate (D/E 0.55, stable interest coverage) | Low (D/E 0.19, strong interest coverage) |
| Regulatory Risk | Moderate (Global tech regulations, IP protection) | Moderate (Government contracting and data privacy) |
| Operational Risk | Moderate (Complex IC design processes) | Moderate (Integrated public sector software complexity) |
| Environmental Risk | Low (Primarily software, limited physical footprint) | Low (Software services with minimal direct environmental impact) |
| Geopolitical Risk | Moderate (Global supply chain and market exposure) | Low to Moderate (Primarily US-focused public sector) |
The most impactful risks for Cadence are market volatility and regulatory challenges in the global semiconductor design space, while Tyler faces risks mainly from government regulatory changes and moderate market risk. Both companies maintain strong financial health with low bankruptcy risk, but investors should watch Cadence’s higher leverage and valuation multiples carefully.
Which Stock to Choose?
Cadence Design Systems, Inc. (CDNS) shows a favorable income evolution with strong revenue and net income growth over 2020-2024. Its financial ratios are mostly favorable, reflecting robust profitability, low debt levels, and a strong rating of B. Though its ROIC is declining, it remains above WACC, indicating value creation.
Tyler Technologies, Inc. (TYL) also posts favorable income growth, particularly in EBIT and EPS, despite a net margin decline overall. Its financial ratios are slightly favorable, with moderate profitability and low debt, supported by a B rating. However, its ROIC is below WACC and declining, implying value erosion.
For investors prioritizing stable profitability and value creation, CDNS might appear more favorable due to its higher and more consistent returns and stronger financial ratios. Conversely, those focused on growth potential and recent earnings expansion could find TYL’s improving income statement more appealing despite its value challenges.
Disclaimer: Investment carries a risk of loss of initial capital. The past performance is not a reliable indicator of future results. Be sure to understand risks before making an investment decision.
Go Further
I encourage you to read the complete analyses of Cadence Design Systems, Inc. and Tyler Technologies, Inc. to enhance your investment decisions: