Home > Comparison > Technology > CDNS vs MSTR
The strategic rivalry between Cadence Design Systems, Inc. and Strategy Inc defines the evolving landscape of technology software applications. Cadence operates as a capital-intensive industrial software leader specializing in integrated circuit design and verification. In contrast, Strategy Inc blends bitcoin treasury management with AI-powered enterprise analytics, highlighting a hybrid model of finance and software innovation. This analysis will assess which company presents a superior risk-adjusted opportunity for diversified technology portfolios.
Table of contents
Companies Overview
Cadence Design Systems and Strategy Inc stand as pivotal players in the software application market, each commanding unique niches.
Cadence Design Systems, Inc.: Leading IC Design Innovator
Cadence Design Systems dominates the electronic design automation industry by providing software and hardware solutions that enable integrated circuit (IC) design and verification. Its revenue derives from sophisticated platforms like JasperGold for verification and Genus for logic synthesis. In 2026, Cadence focuses strategically on expanding its footprint in 5G communications, aerospace, and automotive sectors, leveraging its comprehensive design and IP product suite.
Strategy Inc: Bitcoin Treasury and AI Analytics Pioneer
Strategy Inc operates primarily as a bitcoin treasury company while also offering AI-driven enterprise analytics software. It generates revenue by providing investors diverse economic exposure to Bitcoin through equity and fixed income instruments. The company’s strategic pivot in 2025 to blend digital assets with AI analytics underlines its dual focus on cryptocurrency markets and data-driven decision-making tools.
Strategic Collision: Similarities & Divergences
Both firms innovate within software applications but pursue vastly different business philosophies. Cadence relies on a closed ecosystem of IC design tools targeting hardware engineers, while Strategy Inc embraces an open exposure model combining cryptocurrency and AI analytics. Their competitive battleground lies between hardware design software and financial technology innovation. This divergence shapes distinct investment profiles—stability and deep technical moat for Cadence, and high volatility with growth potential for Strategy.
Income Statement Comparison
This data dissects the core profitability and scalability of both corporate engines to reveal who dominates the bottom line:
| Metric | Cadence Design Systems, Inc. (CDNS) | Strategy Inc (MSTR) |
|---|---|---|
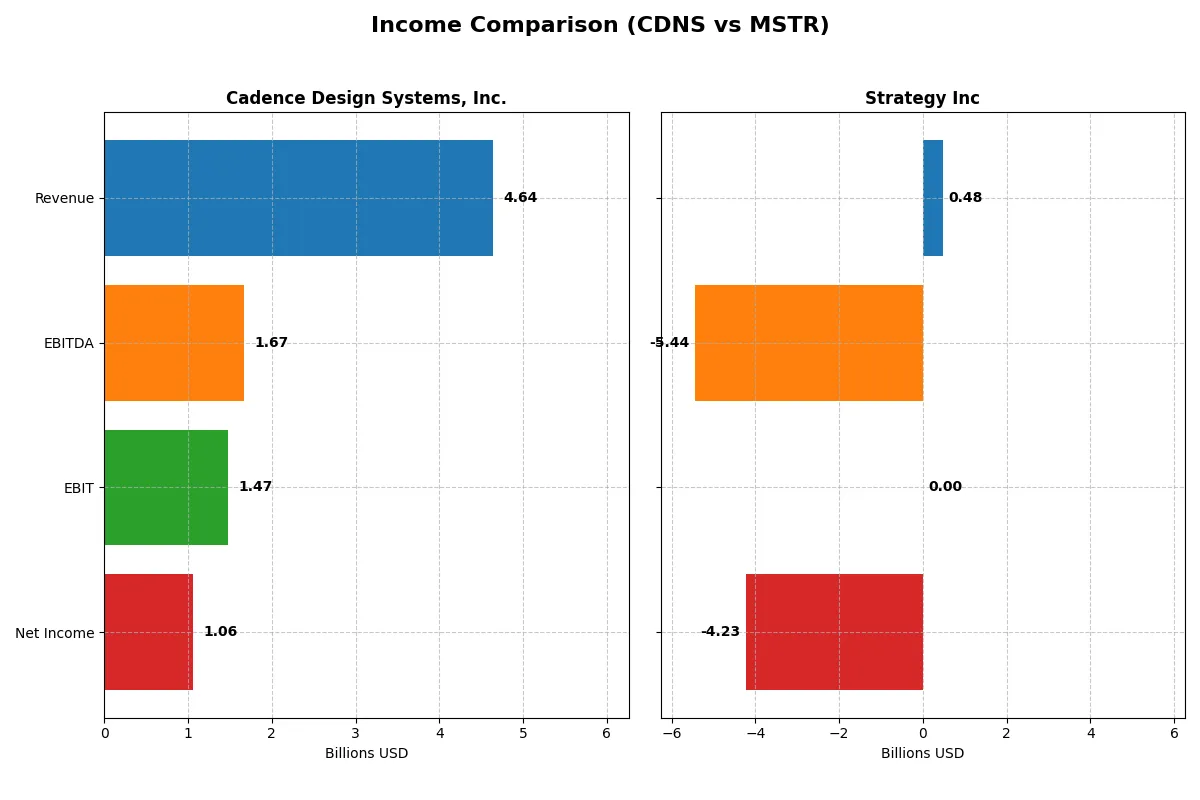
| Revenue | 4.64B | 477M |
| Cost of Revenue | 648M | 149M |
| Operating Expenses | 2.64B | 5.62B |
| Gross Profit | 3.99B | 328M |
| EBITDA | 1.67B | -5.44B |
| EBIT | 1.47B | 0 |
| Interest Expense | 76M | -65M |
| Net Income | 1.06B | -4.23B |
| EPS | 3.89 | -15.23 |
| Fiscal Year | 2024 | 2025 |
Income Statement Analysis: The Bottom-Line Duel
This income statement comparison reveals the true efficiency and profitability of each company’s business engine over recent years.
Cadence Design Systems, Inc. Analysis
Cadence Design Systems shows strong revenue growth, climbing from 2.68B in 2020 to 4.64B in 2024. Net income expands steadily, reaching 1.06B in 2024. Its gross margin remains robust at 86%, and net margin holds favorably at 22.7%. The company sustains solid momentum with efficient cost management reflected in rising EBIT and EBITDA margins.
Strategy Inc Analysis
Strategy Inc’s revenue hovers around 477M in 2025, marginally up from 463M in 2024 but down from 510M in 2021. The company suffers large net losses, with net income plunging to -4.23B in 2025, driven by massive other expenses. Despite a respectable gross margin near 69%, its net margin is deeply negative at -886%, indicating severe profitability challenges and cash flow pressures.
Verdict: Profitability Strength vs. Structural Losses
Cadence Design Systems clearly outperforms Strategy Inc by delivering strong growth, high margins, and consistent net income expansion. Strategy Inc’s persistent losses and negative margins highlight operational and financial strain. For investors, Cadence’s profile offers a stable, efficient growth engine, while Strategy’s losses pose significant risk and uncertainty.
Financial Ratios Comparison
These vital ratios act as a diagnostic tool to expose the underlying fiscal health, valuation premiums, and capital efficiency of the companies analyzed:
| Ratios | Cadence Design Systems, Inc. (CDNS) | Strategy Inc (MSTR) |
|---|---|---|
| ROE | 22.6% | -6.4% |
| ROIC | 13.4% | -4.4% |
| P/E | 77.2 | -47.8 |
| P/B | 17.4 | 3.1 |
| Current Ratio | 2.93 | 0.71 |
| Quick Ratio | 2.74 | 0.71 |
| D/E | 0.55 | 0.40 |
| Debt-to-Assets | 28.8% | 28.1% |
| Interest Coverage | 17.8 | -29.9 |
| Asset Turnover | 0.52 | 0.02 |
| Fixed Asset Turnover | 7.68 | 5.73 |
| Payout ratio | 0 | 0 |
| Dividend yield | 0 | 0 |
| Fiscal Year | 2024 | 2024 |
Efficiency & Valuation Duel: The Vital Signs
Financial ratios act as a company’s DNA, uncovering hidden risks and operational strengths that shape investment decisions.
Cadence Design Systems, Inc.
Cadence boasts strong profitability with a 22.58% ROE and a robust 22.74% net margin, signaling operational excellence. However, its valuation appears stretched, with a high P/E of 77.2 and P/B of 17.44. The company favors reinvestment over dividends, allocating heavily to R&D for growth.
Strategy Inc
Strategy Inc suffers from negative profitability, showing a -6.4% ROE and a deeply unfavorable net margin of -251.73%. The stock trades at a negative P/E, reflecting losses, while a modest P/B of 3.06 suggests some asset support. It lacks dividends and faces liquidity challenges, with a current ratio below 1.
Premium Valuation vs. Operational Risk
Cadence offers a favorable operational profile but trades at a premium, reflecting growth expectations. Strategy Inc presents significant financial distress and weak profitability, increasing risk. Investors seeking operational strength may prefer Cadence’s profile, while those tolerant of volatility might consider Strategy’s turnaround potential.
Which one offers the Superior Shareholder Reward?
Cadence Design Systems (CDNS) pays no dividends but generates strong free cash flow (4.1/share in 2024) with a high payout capacity, sustaining zero payout ratio. It repurchases shares steadily, enhancing total return with a robust current ratio of 2.9. Strategy Inc (MSTR) pays no dividends either but suffers negative free cash flow (-115/share) and weak operating margins (-4%), undermining buyback sustainability. Its current ratio is below 1, signaling liquidity risk. I see CDNS’s disciplined buyback and cash flow as a sustainable shareholder reward. MSTR’s financial strain and lack of distributions make it a riskier total return bet in 2026.
Comparative Score Analysis: The Strategic Profile
The radar chart reveals the fundamental DNA and trade-offs of Cadence Design Systems, Inc. and Strategy Inc, highlighting their financial strengths and valuation challenges:
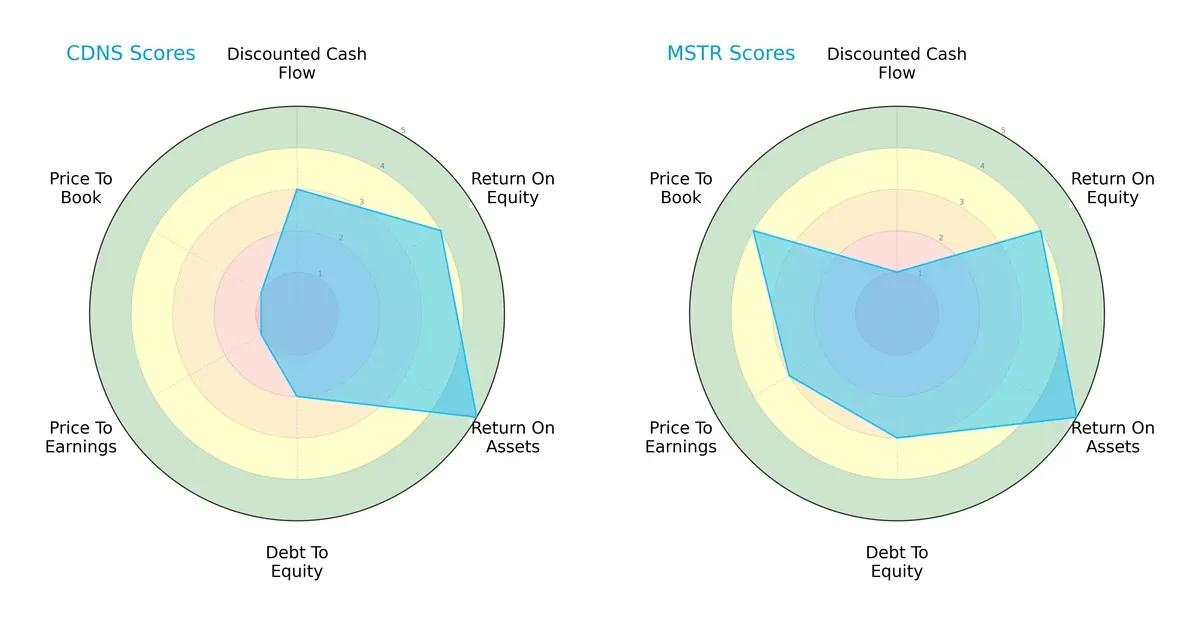
Cadence excels in asset efficiency (ROA 5) and profitability (ROE 4) but struggles with valuation (P/E and P/B scores at 1) and carries higher financial risk (Debt/Equity 2). Strategy Inc shows a more balanced profile with moderate debt (3) and better valuation scores (P/E 3, P/B 4) but weak discounted cash flow (DCF 1). Cadence relies on operational efficiency, whereas Strategy Inc leverages a more conservative capital structure and market valuation.
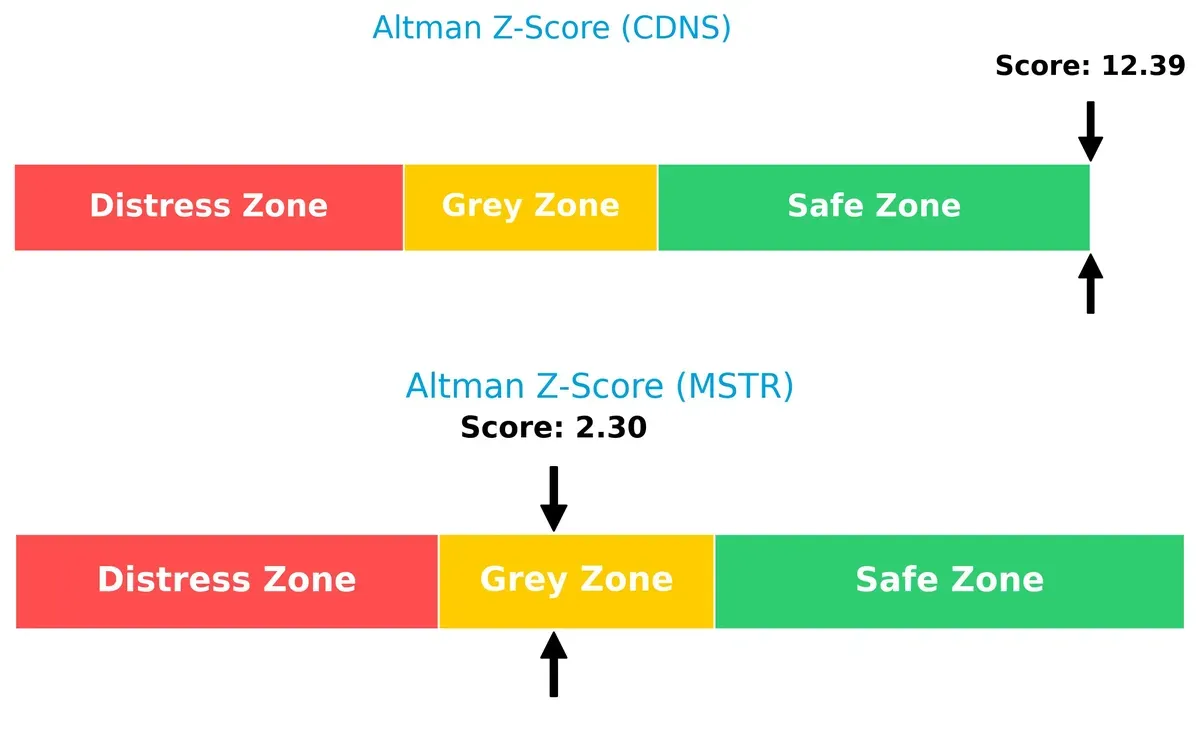
Bankruptcy Risk: Solvency Showdown
Cadence’s Altman Z-Score of 12.39 places it firmly in the safe zone, signaling robust long-term survival. Strategy Inc’s 2.30 score situates it in the grey zone, implying moderate bankruptcy risk in this cycle:
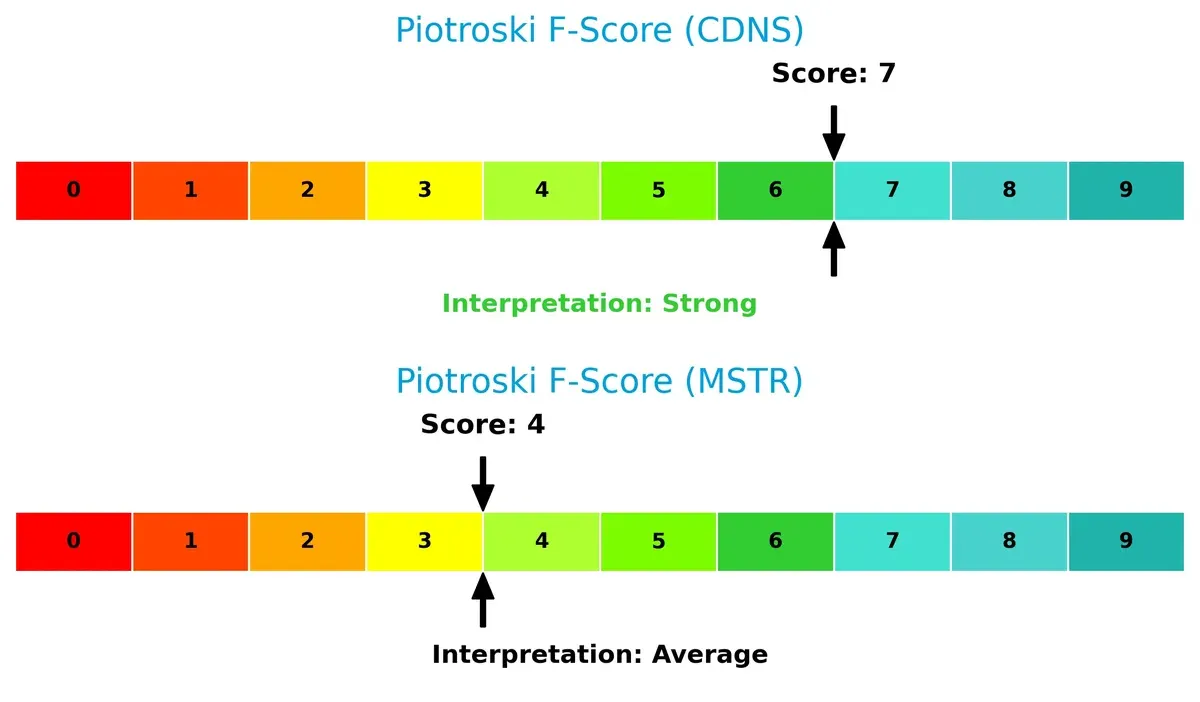
Financial Health: Quality of Operations
Cadence’s Piotroski F-Score of 7 reflects strong financial health and operational quality. Strategy Inc’s score of 4 raises concerns, indicating weaker internal metrics and potential red flags:
How are the two companies positioned?
This section dissects the operational DNA of CDNS and MSTR by comparing their revenue distribution and internal dynamics. The goal is to confront their economic moats and identify which model offers the most resilient competitive advantage today.
Revenue Segmentation: The Strategic Mix
The following comparison dissects how Cadence Design Systems, Inc. and Strategy Inc diversify their income streams and reveals their primary sector bets:
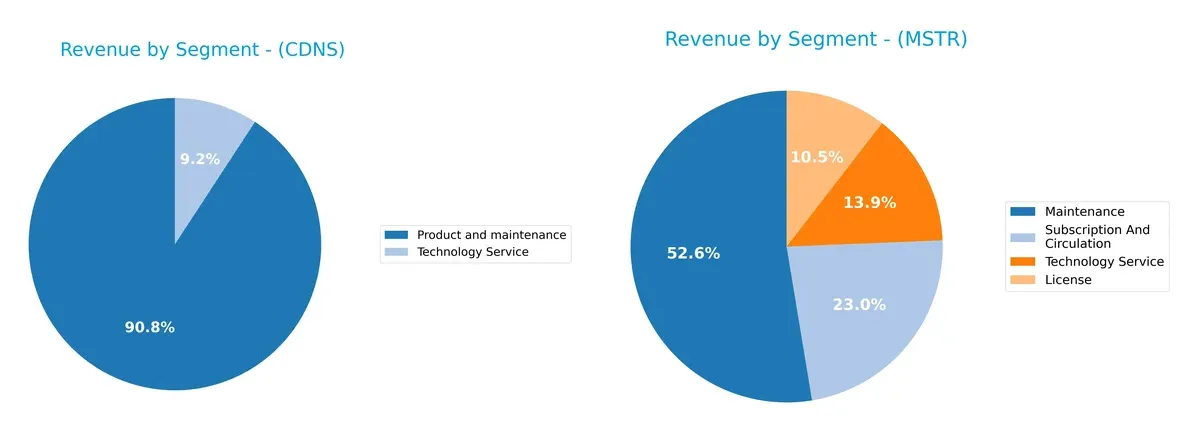
Cadence leans heavily on Product and Maintenance, generating $4.2B in 2024, anchoring its revenue with a focused, high-margin core. Its Technology Service segment, at $428M, plays a smaller supporting role. Strategy Inc shows a more balanced mix: Maintenance leads at $244M, but License ($49M), Subscription ($107M), and Technology Service ($64M) diversify its base. Cadence’s concentration signals strong ecosystem lock-in, while Strategy’s broader spread mitigates concentration risk but may dilute focus.
Strengths and Weaknesses Comparison
This table compares the strengths and weaknesses of Cadence Design Systems, Inc. and Strategy Inc based on financial and operational metrics:
Cadence Design Systems, Inc. Strengths
- Strong net margin at 22.74%
- Favorable ROE of 22.58%
- High current and quick ratios above 2.7
- Low debt to assets at 28.8%
- Robust fixed asset turnover at 7.68
- Diverse revenue from products and technology services
Strategy Inc Strengths
- Favorable debt-to-equity ratio at 0.4
- Reasonable debt to assets at 28.09%
- Favorable fixed asset turnover at 5.73
- Positive PE ratio despite losses
- Diversified revenue sources including license, maintenance, subscription
- Geographic reach across North America, EMEA, and other regions
Cadence Design Systems, Inc. Weaknesses
- High PE at 77.2, indicating expensive valuation
- High PB at 17.44
- No dividend yield
- Neutral asset turnover at 0.52
- Moderate debt-to-equity at 0.55
Strategy Inc Weaknesses
- Negative net margin at -251.73%
- Negative ROE and ROIC
- Low current and quick ratios at 0.71, risking liquidity
- Negative interest coverage
- Low asset turnover at 0.02
- No dividend yield
Overall, Cadence Design Systems demonstrates solid profitability and liquidity with some valuation concerns. Strategy Inc faces significant profitability and liquidity challenges but maintains some operational efficiency and moderate leverage. These contrasts imply different strategic priorities in financial health and market positioning.
The Moat Duel: Analyzing Competitive Defensibility
A structural moat is the only reliable shield protecting long-term profits from relentless competitive pressure and market disruption:
Cadence Design Systems, Inc.: Intangible Assets and High Switching Costs
Cadence’s moat arises from its proprietary software and hardware platforms, creating high switching costs. Its 86% gross margin and stable 31.7% EBIT margin confirm strong pricing power. In 2026, expanding into 5G and automotive electronics deepens this moat.
Strategy Inc: Niche Market Exposure with Volatile Positioning
Strategy Inc’s moat centers on specialized Bitcoin treasury management and AI analytics. Unlike Cadence, it lacks consistent profitability, reflected by negative net margins and volatile revenue growth. Future market disruption and crypto volatility threaten its competitive edge.
Economic Moat Strength: Intangible Assets vs. Niche Exposure
Cadence’s 5.1% ROIC premium over WACC and robust margin profile signal a wider, more sustainable moat. Strategy’s unstable returns and shrinking profitability reveal a fragile moat. Cadence stands better equipped to defend and grow its market share in 2026.
Which stock offers better returns?
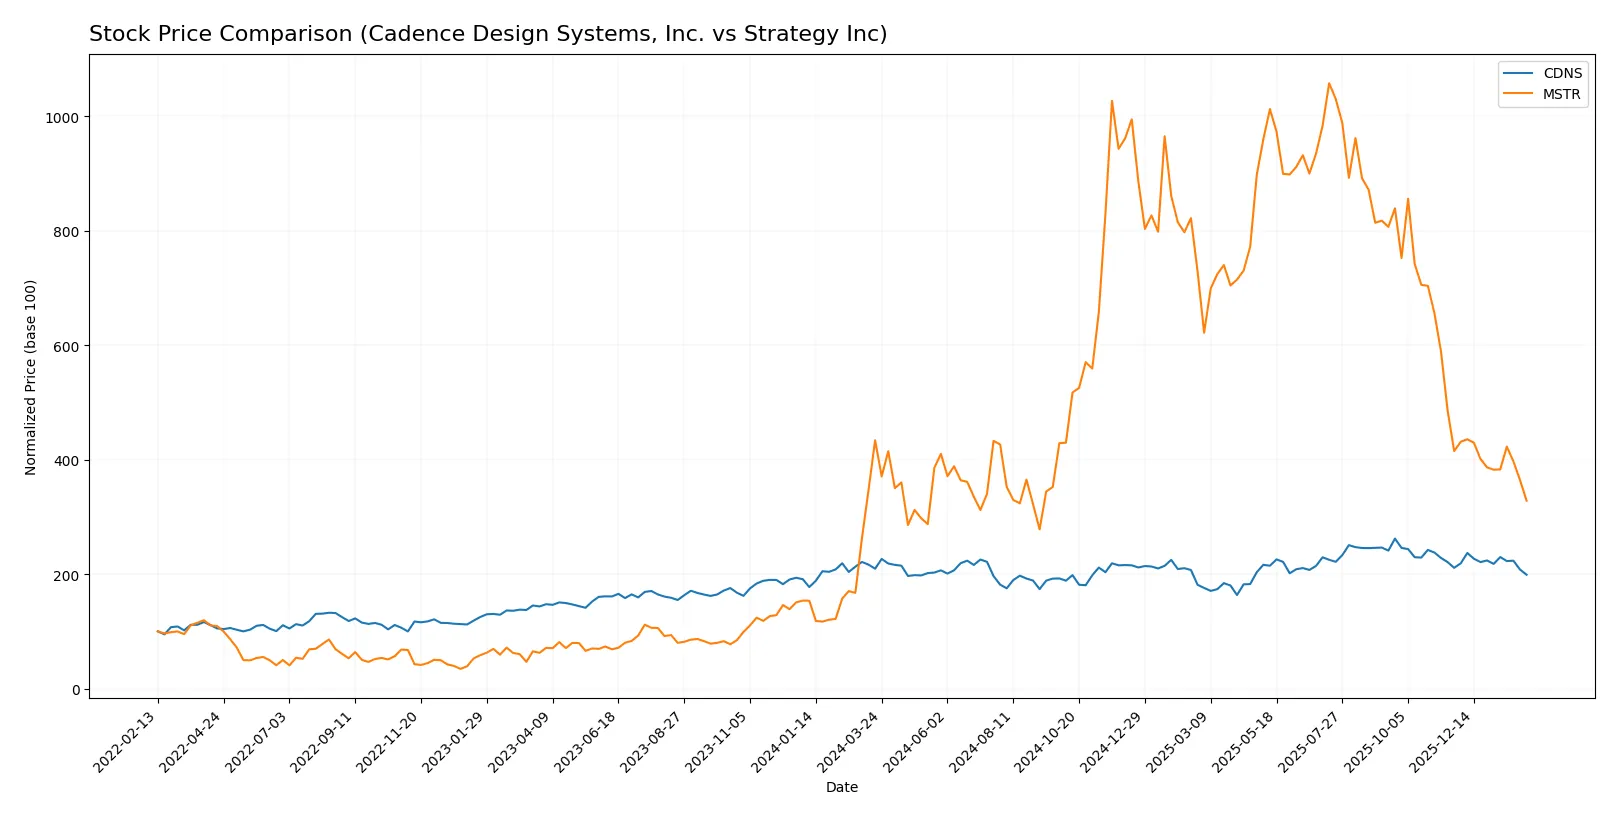
Both Cadence Design Systems, Inc. and Strategy Inc have experienced notable price declines over the past year, exhibiting bearish trends with varying volatility and deceleration patterns.
Trend Comparison
Cadence Design Systems, Inc. (CDNS) shows a 5.0% price decline over the past 12 months, marking a bearish trend with decelerating momentum and a high volatility of 29.19. The stock peaked at 373.35 and bottomed at 232.88.
Strategy Inc (MSTR) faces a sharper 24.3% price decline over the same period, also bearish with deceleration. It shows extreme volatility at 101.34, reaching a high of 434.58 and a low of 114.3.
Comparing both, CDNS outperformed MSTR, delivering a smaller loss and lower volatility, thus showing relatively better market resilience in this period.
Target Prices
Analysts present a mixed but optimistic consensus for Cadence Design Systems and Strategy Inc.
| Company | Target Low | Target High | Consensus |
|---|---|---|---|
| Cadence Design Systems, Inc. | 275 | 418 | 382.17 |
| Strategy Inc | 175 | 705 | 374.5 |
Cadence’s target consensus at 382.17 implies a 35% upside from the current 283.52 price, signaling strong confidence. Strategy Inc’s wide target range reflects volatility but suggests potential growth from its current 134.93 price.

Don’t Let Luck Decide Your Entry Point
Optimize your entry points with our advanced ProRealTime indicators. You’ll get efficient buy signals with precise price targets for maximum performance. Start outperforming now!
How do institutions grade them?
Here are the recent institutional grades for Cadence Design Systems, Inc. and Strategy Inc:
Cadence Design Systems, Inc. Grades
The table below summarizes Cadence Design Systems’ latest institutional grades:
| Grading Company | Action | New Grade | Date |
|---|---|---|---|
| Needham | Maintain | Buy | 2025-12-22 |
| Oppenheimer | Maintain | Underperform | 2025-10-28 |
| JP Morgan | Maintain | Overweight | 2025-10-28 |
| Needham | Maintain | Buy | 2025-10-28 |
| Rosenblatt | Maintain | Neutral | 2025-10-28 |
| Baird | Maintain | Outperform | 2025-10-28 |
| Wells Fargo | Maintain | Overweight | 2025-10-28 |
| Rosenblatt | Maintain | Neutral | 2025-10-22 |
| Mizuho | Maintain | Outperform | 2025-07-29 |
| JP Morgan | Maintain | Overweight | 2025-07-29 |
Strategy Inc Grades
The table below shows the most recent institutional grades for Strategy Inc:
| Grading Company | Action | New Grade | Date |
|---|---|---|---|
| BTIG | Maintain | Buy | 2026-02-06 |
| Canaccord Genuity | Maintain | Buy | 2026-02-04 |
| Mizuho | Maintain | Outperform | 2026-01-16 |
| TD Cowen | Maintain | Buy | 2026-01-15 |
| Citigroup | Maintain | Buy | 2025-12-22 |
| Bernstein | Maintain | Outperform | 2025-12-08 |
| Monness, Crespi, Hardt | Upgrade | Neutral | 2025-11-10 |
| Canaccord Genuity | Maintain | Buy | 2025-11-03 |
| HC Wainwright & Co. | Maintain | Buy | 2025-11-03 |
| TD Cowen | Maintain | Buy | 2025-10-31 |
Which company has the best grades?
Strategy Inc has consistently received Buy and Outperform ratings from multiple firms. Cadence Design Systems shows more mixed grades, including Underperform and Neutral. This divergence may influence investor sentiment and portfolio positioning.
Risks specific to each company
The following categories identify the critical pressure points and systemic threats facing both firms in the 2026 market environment:
1. Market & Competition
Cadence Design Systems, Inc.
- Dominates a mature software application niche with strong 5G and hyperscale computing demand. Faces intense competition but benefits from entrenched client relationships.
Strategy Inc
- Operates in volatile bitcoin treasury and AI analytics markets. Faces fierce competition and rapid tech shifts, increasing market unpredictability.
2. Capital Structure & Debt
Cadence Design Systems, Inc.
- Maintains a balanced capital structure with moderate leverage (D/E 0.55) and strong interest coverage (19.37x).
Strategy Inc
- Lower leverage (D/E 0.40) but poor interest coverage near zero signals financial strain and risk of distress.
3. Stock Volatility
Cadence Design Systems, Inc.
- Exhibits low beta (~1.0) indicating stable stock price relative to market.
Strategy Inc
- Extremely high beta (3.54) signals elevated price volatility and investor risk exposure.
4. Regulatory & Legal
Cadence Design Systems, Inc.
- Operates in regulated tech sectors with standard compliance risks but no notable legal issues.
Strategy Inc
- Faces regulatory uncertainty tied to cryptocurrency holdings and cross-border AI data governance.
5. Supply Chain & Operations
Cadence Design Systems, Inc.
- Benefits from diversified, global supply chains supporting IC design and verification services.
Strategy Inc
- Operations heavily reliant on data centers and digital infrastructure vulnerable to cyber and operational disruptions.
6. ESG & Climate Transition
Cadence Design Systems, Inc.
- Increasingly integrating ESG practices with modest carbon footprint and tech-driven efficiency gains.
Strategy Inc
- ESG risks elevated due to cryptocurrency energy consumption and emerging climate-related regulation pressures.
7. Geopolitical Exposure
Cadence Design Systems, Inc.
- Primarily US-based with global client base; moderate exposure to trade tensions but robust market position.
Strategy Inc
- High geopolitical risk given international bitcoin holdings and multi-region operations in volatile regulatory environments.
Which company shows a better risk-adjusted profile?
Cadence Design Systems faces manageable operational and market risks, supported by strong financial health and stable stock behavior. Strategy Inc carries outsized volatility and regulatory uncertainty tied to its bitcoin treasury model. Cadence’s superior liquidity, debt coverage, and safer Altman Z-score (12.4 vs. 2.3) underscore its resilience. Strategy’s negative margins and weak liquidity raise red flags despite favorable rating scores. I see Cadence as the safer, more prudent investment in 2026.
Final Verdict: Which stock to choose?
Cadence Design Systems stands out as a powerhouse of operational efficiency and robust capital allocation. Its ability to generate consistently high returns on invested capital signals a durable competitive edge. The main point of vigilance remains its premium valuation, which may pressure returns. It suits portfolios focused on aggressive growth with a tolerance for valuation risk.
Strategy Inc’s strategic moat lies in its niche market presence and recurring revenue streams, providing some cushion against volatility. However, its financial instability and deteriorating profitability raise safety concerns compared to Cadence. This profile fits investors seeking growth at a reasonable price but with a higher appetite for risk and turnaround potential.
If you prioritize strong, proven capital efficiency and operational resilience, Cadence outshines as the compelling choice due to its consistent value creation and balance sheet strength. However, if you seek speculative growth with potential high rewards from market repositioning, Strategy Inc offers an analytical scenario worth considering, albeit with heightened financial risks.
Disclaimer: Investment carries a risk of loss of initial capital. The past performance is not a reliable indicator of future results. Be sure to understand risks before making an investment decision.
Go Further
I encourage you to read the complete analyses of Cadence Design Systems, Inc. and Strategy Inc to enhance your investment decisions: