In today’s fast-evolving technology landscape, Shopify Inc. and Cadence Design Systems, Inc. stand out as leaders in software applications, yet they serve distinct yet overlapping market needs. Shopify powers global e-commerce platforms, while Cadence specializes in electronic design automation for complex chip development. Both companies emphasize innovation to maintain competitive edges. This article will analyze their strengths and risks to help you decide which represents the more compelling investment opportunity in 2026.
Table of contents
Companies Overview
I will begin the comparison between Shopify and Cadence Design Systems by providing an overview of these two companies and their main differences.
Shopify Overview
Shopify Inc. is a commerce company headquartered in Ottawa, Canada, offering a platform that enables merchants to display, manage, market, and sell products across multiple sales channels worldwide. Its services include inventory management, order processing, payments, shipping, and financing solutions. Founded in 2004, Shopify serves a broad range of businesses with an emphasis on e-commerce innovation and merchant empowerment.
Cadence Design Systems Overview
Cadence Design Systems, Inc., based in San Jose, California, provides software, hardware, and services for integrated circuit (IC) design and verification. The company’s offerings include functional verification, digital IC design, custom IC simulation, and system design tools, targeting sectors such as 5G, aerospace, automotive, and healthcare. Established in 1987, Cadence supports complex chip design and manufacturing processes globally.
Key similarities and differences
Both Shopify and Cadence operate in the technology sector, focusing on software applications but serving distinct markets—e-commerce for Shopify and semiconductor design for Cadence. Shopify’s business model revolves around enabling merchants’ commerce operations, while Cadence centers on IC design and verification tools. Additionally, Shopify operates globally with a commerce platform, whereas Cadence provides specialized hardware and software for chip design industries.
Income Statement Comparison
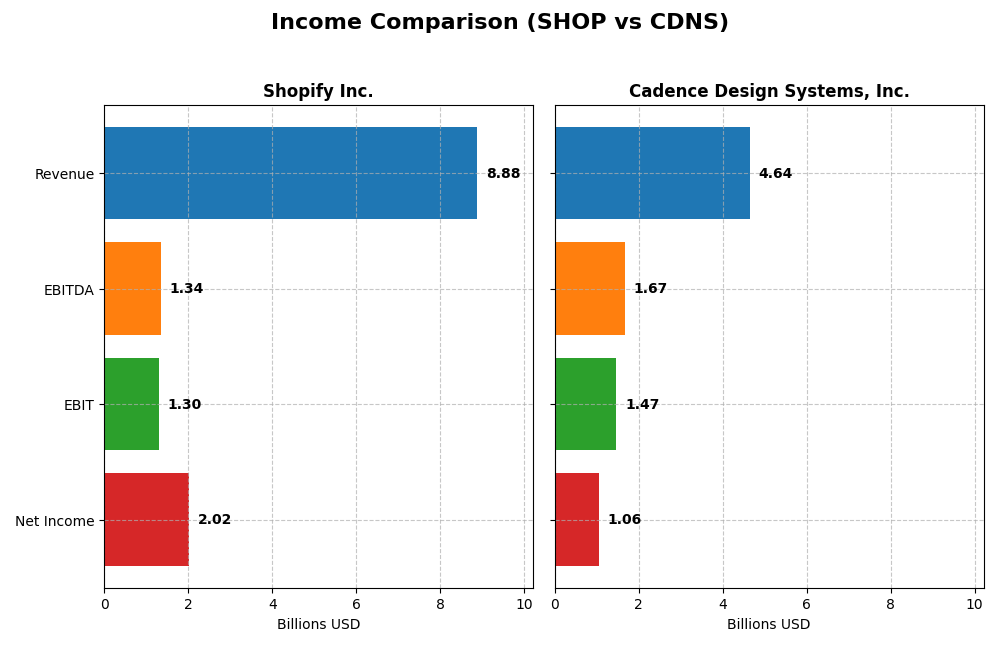
The table below compares key income statement metrics for Shopify Inc. and Cadence Design Systems, Inc. for the fiscal year 2024, providing a snapshot of their financial performance.
| Metric | Shopify Inc. (SHOP) | Cadence Design Systems, Inc. (CDNS) |
|---|---|---|
| Market Cap | 205.6B | 86.2B |
| Revenue | 8.88B | 4.64B |
| EBITDA | 1.34B | 1.67B |
| EBIT | 1.30B | 1.47B |
| Net Income | 2.02B | 1.06B |
| EPS | 1.56 | 3.89 |
| Fiscal Year | 2024 | 2024 |
Income Statement Interpretations
Shopify Inc.
Shopify Inc. demonstrated strong growth from 2020 to 2024, with revenue increasing from $2.9B to $8.9B and net income rising from $320M to $2.0B. Margins improved significantly, with a gross margin of 50.36% and a net margin of 22.74% in 2024. The latest year showed accelerated growth, with revenue up 25.8% and net income surging over 1100%, reflecting enhanced profitability and operational efficiency.
Cadence Design Systems, Inc.
Cadence Design Systems saw stable revenue growth from $2.7B in 2020 to $4.6B in 2024, with net income increasing from $591M to $1.1B. The company maintained high gross margins above 86% and an EBIT margin of 31.7% in 2024. However, net margin experienced a slight decline in 2024, dropping by 10.7%, despite continued revenue and EBIT growth, indicating some pressure on profitability.
Which one has the stronger fundamentals?
Both companies exhibit favorable fundamentals with strong revenue and net income growth over the period. Shopify shows more pronounced margin improvements and rapid earnings expansion recently, while Cadence maintains superior gross and EBIT margins but faces a minor net margin setback. Shopify’s accelerating profitability contrasts with Cadence’s steady but less dynamic margin profile, reflecting different financial strengths.
Financial Ratios Comparison
This table presents a side-by-side comparison of key financial ratios for Shopify Inc. and Cadence Design Systems, Inc. based on their most recent full-year data from 2024.
| Ratios | Shopify Inc. (SHOP) | Cadence Design Systems, Inc. (CDNS) |
|---|---|---|
| ROE | 17.5% | 22.6% |
| ROIC | 7.5% | 13.4% |
| P/E | 68.2 | 77.2 |
| P/B | 11.9 | 17.4 |
| Current Ratio | 3.71 | 2.93 |
| Quick Ratio | 3.70 | 2.74 |
| D/E (Debt-to-Equity) | 0.10 | 0.55 |
| Debt-to-Assets | 8.1% | 28.8% |
| Interest Coverage | 0 | 17.8 |
| Asset Turnover | 0.64 | 0.52 |
| Fixed Asset Turnover | 63.4 | 7.68 |
| Payout Ratio | 0 | 0 |
| Dividend Yield | 0 | 0 |
Interpretation of the Ratios
Shopify Inc.
Shopify shows a mixed ratio profile with strong net margin (22.74%) and ROE (17.47%), yet the high PE (68.18) and PB (11.91) ratios indicate potentially overvalued shares. The current ratio is high at 3.71 but marked unfavorable, suggesting excess liquidity. The company does not pay dividends, likely focusing on growth and reinvestment, with no share buybacks noted.
Cadence Design Systems, Inc.
Cadence exhibits stronger profitability with a favorable net margin (22.74%), ROE (22.58%), and ROIC (13.43%), alongside a balanced debt position. Its current and quick ratios are favorable, reflecting sound liquidity. Despite a high PE (77.2) and PB (17.44), the company pays no dividends, probably prioritizing R&D and growth initiatives over distributions or buybacks.
Which one has the best ratios?
Cadence Design Systems presents a more favorable ratio set overall, with higher profitability and better liquidity metrics compared to Shopify. While both companies share high valuation multiples and absence of dividends, Cadence’s stronger coverage ratios and balanced debt levels contribute to a comparatively healthier financial profile.
Strategic Positioning
This section compares the strategic positioning of Shopify Inc. and Cadence Design Systems, Inc., including Market position, Key segments, and exposure to disruption:
Shopify Inc.
- Leading commerce platform with global reach and high beta indicating competitive market pressure.
- Key segments include merchant solutions and subscription services driving revenue growth.
- Platform-based business model with evolving merchant solutions faces technological shifts in e-commerce.
Cadence Design Systems, Inc.
- Specialized software and hardware provider with moderate beta in a competitive tech industry.
- Focused on IC design software, hardware, and services across multiple high-tech markets.
- Exposure to rapid chip design innovation and verification technology disruption.
Shopify Inc. vs Cadence Design Systems, Inc. Positioning
Shopify pursues a diversified commerce platform strategy serving multiple sales channels, while Cadence concentrates on specialized IC design and verification tools. Shopify leverages broad merchant services, whereas Cadence targets niche tech-driven markets with complex products and services.
Which has the best competitive advantage?
Cadence Design Systems shows a slightly favorable moat by creating value despite declining ROIC, indicating efficient capital use. Shopify’s slightly unfavorable moat reflects value destruction despite growing ROIC, signaling less consistent competitive advantage.
Stock Comparison
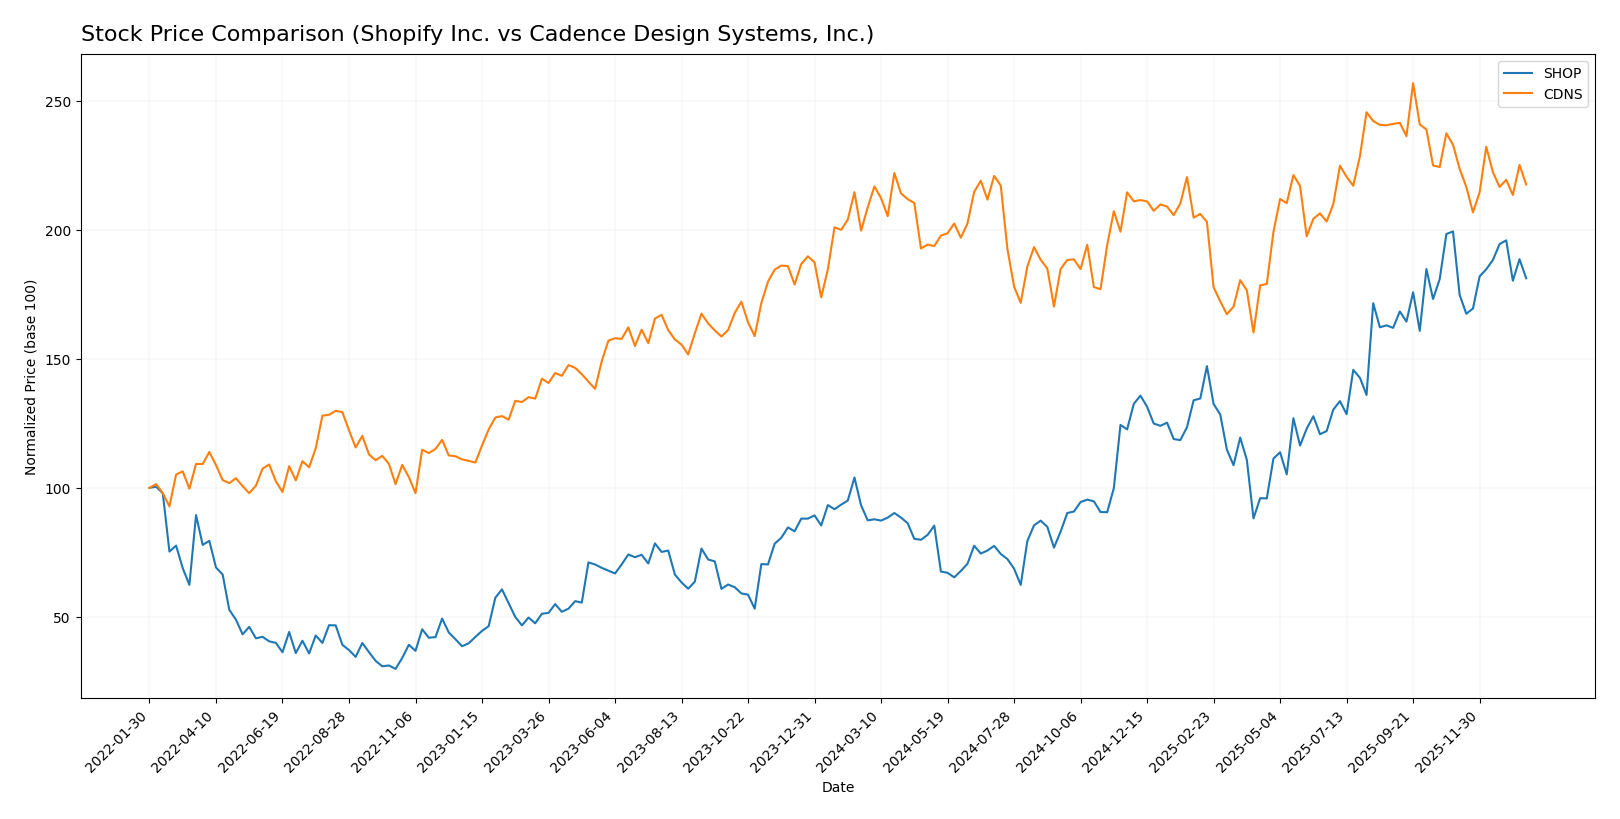
The past year showed strong bullish trends for Shopify Inc. and Cadence Design Systems, Inc., with notable price appreciation and decelerating momentum, amid contrasting buyer-seller volume dynamics.
Trend Analysis
Shopify Inc. exhibited a significant bullish trend over the past 12 months with a 107.29% price increase, reaching a high of 173.86. The trend shows deceleration, and recent weeks indicate a -9.1% dip with buyer dominance at 65.06%.
Cadence Design Systems, Inc. showed a mild bullish trend with a 4.21% gain over 12 months, also decelerating. The stock peaked at 373.35, but recent data reflect a -6.61% decline and seller dominance at 69.82%.
Comparatively, Shopify’s stock delivered the highest market performance with a much larger price increase, despite both stocks experiencing recent downward corrections.
Target Prices
Analysts present a bullish consensus for both Shopify Inc. and Cadence Design Systems, Inc.
| Company | Target High | Target Low | Consensus |
|---|---|---|---|
| Shopify Inc. | 200 | 140 | 186.24 |
| Cadence Design Systems, Inc. | 418 | 275 | 381 |
The target consensus for Shopify at 186.24 is notably above its current price of 157.93, indicating potential upside. Similarly, Cadence’s consensus target of 381 suggests room for growth compared to its current price near 316.8.
Analyst Opinions Comparison
This section compares analysts’ ratings and grades for Shopify Inc. and Cadence Design Systems, Inc.:
Rating Comparison
SHOP Rating
- Rating: Both companies share a “B” rating, indicating a very favorable status.
- Discounted Cash Flow Score: Shopify scores 2, showing moderate valuation based on future cash flows.
- ROE Score: Both companies have a favorable score of 4, reflecting efficient profit generation.
- ROA Score: Both firms achieve a very favorable score of 5, showing excellent asset utilization.
- Debt To Equity Score: Shopify has a moderate score of 3, implying balanced financial risk.
- Overall Score: Both companies have a moderate overall score of 3, suggesting average financial standing.
CDNS Rating
- Rating: Both companies share a “B” rating, indicating a very favorable status.
- Discounted Cash Flow Score: Cadence scores 3, indicating a slightly stronger valuation perspective.
- ROE Score: Both companies have a favorable score of 4, reflecting efficient profit generation.
- ROA Score: Both firms achieve a very favorable score of 5, showing excellent asset utilization.
- Debt To Equity Score: Cadence scores 2, indicating somewhat lower financial risk.
- Overall Score: Both companies have a moderate overall score of 3, suggesting average financial standing.
Which one is the best rated?
Both Shopify and Cadence have identical “B” ratings and overall scores of 3, indicating moderate financial standing. Cadence holds a slightly better discounted cash flow and debt-to-equity score, but both companies are similarly rated overall.
Scores Comparison
Here is a comparison of the financial health scores for Shopify Inc. and Cadence Design Systems, Inc.:
SHOP Scores
- Altman Z-Score: 50.42, indicating a safe zone and very low bankruptcy risk.
- Piotroski Score: 6, reflecting average financial strength.
CDNS Scores
- Altman Z-Score: 14.51, indicating a safe zone and very low bankruptcy risk.
- Piotroski Score: 7, reflecting strong financial strength.
Which company has the best scores?
Both companies are in the Altman Z-Score safe zone, showing low bankruptcy risk. However, CDNS has a slightly stronger Piotroski Score (7 vs. 6), indicating better financial health based on the provided data.
Grades Comparison
The following presents the recent grades and rating trends for Shopify Inc. and Cadence Design Systems, Inc.:
Shopify Inc. Grades
This table shows recent grades and rating changes from reputable financial institutions for Shopify Inc.:
| Grading Company | Action | New Grade | Date |
|---|---|---|---|
| Scotiabank | Upgrade | Sector Outperform | 2026-01-08 |
| Wolfe Research | Downgrade | Peer Perform | 2026-01-06 |
| Wells Fargo | Maintain | Overweight | 2025-12-17 |
| Truist Securities | Maintain | Hold | 2025-11-05 |
| CIBC | Maintain | Outperform | 2025-11-05 |
| Cantor Fitzgerald | Maintain | Neutral | 2025-11-05 |
| DA Davidson | Maintain | Buy | 2025-11-05 |
| Scotiabank | Maintain | Sector Perform | 2025-11-05 |
| Needham | Maintain | Buy | 2025-11-05 |
| JP Morgan | Maintain | Overweight | 2025-11-05 |
Shopify’s grades show a mixed but generally positive trend, with mostly stable or upgraded recommendations from multiple firms.
Cadence Design Systems, Inc. Grades
This table shows recent grades and rating stability from recognized financial institutions for Cadence Design Systems, Inc.:
| Grading Company | Action | New Grade | Date |
|---|---|---|---|
| Needham | Maintain | Buy | 2025-12-22 |
| Wells Fargo | Maintain | Overweight | 2025-10-28 |
| Baird | Maintain | Outperform | 2025-10-28 |
| Needham | Maintain | Buy | 2025-10-28 |
| JP Morgan | Maintain | Overweight | 2025-10-28 |
| Oppenheimer | Maintain | Underperform | 2025-10-28 |
| Rosenblatt | Maintain | Neutral | 2025-10-28 |
| Rosenblatt | Maintain | Neutral | 2025-10-22 |
| Needham | Maintain | Buy | 2025-07-29 |
| Loop Capital | Maintain | Buy | 2025-07-29 |
Cadence exhibits consistent ratings with mostly “Buy” and “Overweight” grades, though one “Underperform” rating is noted.
Which company has the best grades?
Both companies have a consensus “Buy” rating, but Shopify displays a broader range of grade changes including recent upgrades and downgrades, while Cadence’s ratings are more stable with fewer fluctuations. This variability in Shopify’s grades may influence investor perception of potential volatility or opportunity, whereas Cadence’s consistent buy-side support suggests steadier confidence.
Strengths and Weaknesses
Below is a comparison table highlighting key strengths and weaknesses of Shopify Inc. and Cadence Design Systems, Inc. based on recent financial and operational data.
| Criterion | Shopify Inc. (SHOP) | Cadence Design Systems, Inc. (CDNS) |
|---|---|---|
| Diversification | Strong growth in Merchant Solutions and Subscription revenue streams; expanding service offerings. | Balanced revenue from Product & Maintenance and Technology Services; steady segment contribution. |
| Profitability | Net margin 22.74%, ROE 17.47%, but ROIC (7.55%) below WACC (17.1%), indicating value destruction. | Net margin 22.74%, ROE 22.58%, ROIC (13.43%) above WACC (8.44%), indicating value creation. |
| Innovation | Growing ROIC trend (+514%), indicating increasing profitability potential despite current value destruction. | Declining ROIC trend (-30%), showing some challenges in sustaining profitability growth. |
| Global presence | Strong global e-commerce platform with expanding merchant base worldwide. | Global leader in electronic design automation software with diversified client base. |
| Market Share | Significant player in e-commerce solutions with increasing subscription and merchant service revenues. | Leading market position in electronic design software with steady revenue growth. |
Key takeaways: Shopify demonstrates robust revenue diversification and growth potential but currently destroys value due to high capital costs. Cadence shows solid profitability and value creation but faces challenges with declining ROIC, signaling caution for future growth sustainability. Investors should weigh growth prospects against profitability trends carefully.
Risk Analysis
Below is a comparative table summarizing key risks for Shopify Inc. and Cadence Design Systems, Inc. based on the most recent data from 2024.
| Metric | Shopify Inc. (SHOP) | Cadence Design Systems, Inc. (CDNS) |
|---|---|---|
| Market Risk | High (Beta 2.84) | Moderate (Beta 1.02) |
| Debt Level | Low (Debt/Equity 0.1) | Moderate (Debt/Equity 0.55) |
| Regulatory Risk | Moderate (Global operations) | Moderate (Tech sector regulations) |
| Operational Risk | Moderate (Platform dependency) | Moderate (Complex product development) |
| Environmental Risk | Low (Software focus) | Low (Software and hardware focus) |
| Geopolitical Risk | Moderate (Global exposure) | Moderate (US-based with global clients) |
The most impactful risks are Shopify’s high market volatility reflected in its elevated beta and Cadence’s moderate debt level, which demands careful monitoring. Both face operational and regulatory challenges typical of global technology firms, but their strong financial health and safe Altman Z-scores mitigate near-term bankruptcy risk.
Which Stock to Choose?
Shopify Inc. (SHOP) has demonstrated strong income growth with a 25.78% one-year revenue increase and a favorable 22.74% net margin in 2024. Its financial ratios show a balanced profile of 50% favorable and 36% unfavorable metrics, with very favorable profitability and low debt. However, its ROIC is below WACC, indicating value destruction despite improving profitability. The company holds a very favorable B rating and a robust Altman Z-Score in the safe zone, though its Piotroski score is average.
Cadence Design Systems, Inc. (CDNS) exhibits steady income growth with a 13.48% revenue rise and an excellent 22.74% net margin in 2024. Its financial ratios are more favorable overall at 57%, with strong profitability metrics and moderate debt levels. CDNS is creating value with ROIC exceeding WACC, though ROIC is declining. It holds a very favorable B rating, a strong Piotroski score, and an Altman Z-Score in the safe zone, reflecting solid financial health.
For investors, CDNS might appear more attractive for those prioritizing value creation and stable profitability, while SHOP could be seen as suited for those focused on rapid income growth and improving returns despite current value erosion. The choice could depend on an investor’s tolerance for risk and preference for growth versus value dynamics.
Disclaimer: Investment carries a risk of loss of initial capital. The past performance is not a reliable indicator of future results. Be sure to understand risks before making an investment decision.
Go Further
I encourage you to read the complete analyses of Shopify Inc. and Cadence Design Systems, Inc. to enhance your investment decisions: