In the fast-evolving world of technology software, Cadence Design Systems, Inc. and PTC Inc. stand out as key players offering innovative solutions across overlapping markets. Both companies focus on advanced design and engineering software, catering to industries from aerospace to manufacturing. Their distinct innovation strategies and market approaches make this comparison essential. Join me as we explore which company presents the most compelling opportunity for your investment portfolio.
Table of contents
Companies Overview
I will begin the comparison between Cadence Design Systems and PTC by providing an overview of these two companies and their main differences.
Cadence Design Systems Overview
Cadence Design Systems, Inc. specializes in software, hardware, and services for integrated circuit (IC) design and verification, serving industries like 5G communications, aerospace, automotive, and healthcare. Headquartered in San Jose, California, Cadence offers advanced platforms for functional verification, digital IC design, physical implementation, and custom IC simulation. Founded in 1987, it is a key player in the application software sector with a market cap of $84.5B.
PTC Overview
PTC Inc. operates as a software and services company focusing on digital transformation solutions across the Americas, Europe, and Asia Pacific. Headquartered in Boston, Massachusetts, PTC offers platforms such as ThingWorx for IoT, Vuforia for augmented reality, and several product lifecycle management and CAD tools. Established in 1985, PTC has a market cap of $20.4B and serves clients through software products and professional services segments.
Key similarities and differences
Both Cadence and PTC operate in the software application industry, providing solutions that support complex design and digital transformation efforts. Cadence focuses primarily on IC design and verification tools, while PTC’s portfolio centers on IoT platforms, AR, and product lifecycle management software. Cadence is larger by market cap and employee count, reflecting a strong emphasis on hardware-related software, whereas PTC’s offerings lean more toward software-as-a-service and digital product innovation.
Income Statement Comparison
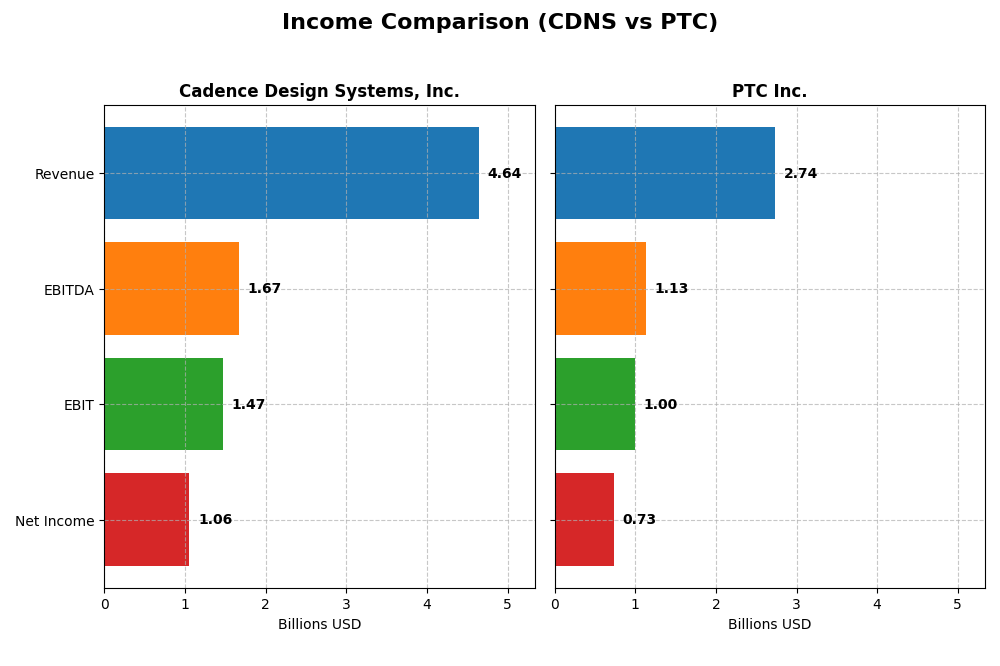
The table below compares key income statement metrics for Cadence Design Systems, Inc. and PTC Inc. based on their most recent fiscal year data.
| Metric | Cadence Design Systems, Inc. | PTC Inc. |
|---|---|---|
| Market Cap | 84.5B | 20.4B |
| Revenue | 4.64B | 2.74B |
| EBITDA | 1.67B | 1.13B |
| EBIT | 1.47B | 997M |
| Net Income | 1.06B | 734M |
| EPS | 3.89 | 6.18 |
| Fiscal Year | 2024 | 2025 |
Income Statement Interpretations
Cadence Design Systems, Inc.
Cadence’s revenue and net income grew steadily from 2020 to 2024, with revenue rising from $2.68B to $4.64B and net income from $590M to $1.06B. Margins remained strong, notably a gross margin around 86%, reflecting operational efficiency. In 2024, revenue growth slowed slightly to 13.5%, while net margin dipped modestly, indicating some pressure on profitability despite continued solid earnings.
PTC Inc.
PTC showed consistent revenue and net income growth between 2021 and 2025, with revenue increasing from $1.81B to $2.74B and net income from $477M to $734M. Margins, including an EBIT margin of 36.4% and net margin of 26.8% in 2025, improved over the period. The latest year saw accelerated growth, with revenue up 19.2% and net margin expanding by 63.7%, signaling improving profitability and operational leverage.
Which one has the stronger fundamentals?
Both companies demonstrate favorable fundamentals with solid revenue and net income growth. Cadence benefits from higher absolute scale and consistent margin stability, albeit with a slight net margin decline recently. PTC exhibits stronger margin expansion and accelerated growth in the latest year, with no unfavorable indicators reported. Overall, PTC shows a higher proportion of favorable income statement metrics, suggesting robust momentum in profitability.
Financial Ratios Comparison
The following table compares key financial ratios for Cadence Design Systems, Inc. (CDNS) and PTC Inc. (PTC) based on their most recent fiscal year data.
| Ratios | Cadence Design Systems, Inc. (2024) | PTC Inc. (2025) |
|---|---|---|
| ROE | 22.6% | 19.2% |
| ROIC | 13.4% | 14.4% |
| P/E | 77.2 | 33.2 |
| P/B | 17.4 | 6.4 |
| Current Ratio | 2.93 | 1.12 |
| Quick Ratio | 2.74 | 1.12 |
| D/E (Debt/Equity) | 0.55 | 0.36 |
| Debt-to-Assets | 28.8% | 20.7% |
| Interest Coverage | 17.8 | 12.8 |
| Asset Turnover | 0.52 | 0.41 |
| Fixed Asset Turnover | 7.68 | 15.6 |
| Payout Ratio | 0% | 0% |
| Dividend Yield | 0% | 0% |
Interpretation of the Ratios
Cadence Design Systems, Inc.
Cadence Design Systems shows strong financial health with favorable net margin (22.74%), ROE (22.58%), ROIC (13.43%), and liquidity ratios, including a current ratio of 2.93. Concerns arise from its high P/E (77.2) and P/B (17.44) ratios, indicating possible overvaluation. The company does not pay dividends, likely reinvesting earnings to support growth and R&D initiatives.
PTC Inc.
PTC Inc. displays solid profitability with a favorable net margin of 26.8%, ROE at 19.18%, and ROIC of 14.43%. It maintains good debt management and interest coverage, though its P/E of 33.19 and P/B of 6.37 remain elevated. PTC also does not pay dividends, suggesting a focus on reinvestment, innovation, and possible share buybacks to enhance shareholder value.
Which one has the best ratios?
Both Cadence Design Systems and PTC have an equal share of favorable ratios (57.14%), reflecting strong operational performance. Cadence’s superior liquidity and asset turnover contrast with PTC’s better debt ratios and fixed asset efficiency. However, PTC’s slightly higher unfavorable ratio percentage and weaker asset turnover give Cadence a marginal edge in overall ratio quality.
Strategic Positioning
This section compares the strategic positioning of Cadence Design Systems, Inc. (CDNS) and PTC Inc. (PTC) regarding market position, key segments, and exposure to technological disruption:
Cadence Design Systems, Inc.
- Leading software provider in IC design with strong competitive pressure in semiconductor tools.
- Key segments include IC design software, functional verification, IP products, and services across multiple tech markets.
- Faces ongoing disruption from advances in semiconductor design and verification technologies requiring continuous innovation.
PTC Inc.
- Software and services player focused on product lifecycle management and digital transformation with moderate competition.
- Focuses on software products and professional services including CAD, PLM, AR, and SaaS for product development.
- Exposed to disruption via digital transformation and augmented reality trends shaping product development and lifecycle management.
Cadence Design Systems, Inc. vs PTC Inc. Positioning
Cadence has a diversified approach centered on semiconductor IC design and verification, serving various high-tech markets. PTC concentrates on software platforms and services enabling digital transformation and product lifecycle management. Cadence’s wider market scope contrasts with PTC’s focused enterprise software solutions.
Which has the best competitive advantage?
PTC exhibits a very favorable MOAT with growing ROIC, showing a durable competitive advantage and increasing profitability. Cadence also creates value but with a slightly favorable MOAT and declining ROIC trend, indicating less durable profitability.
Stock Comparison
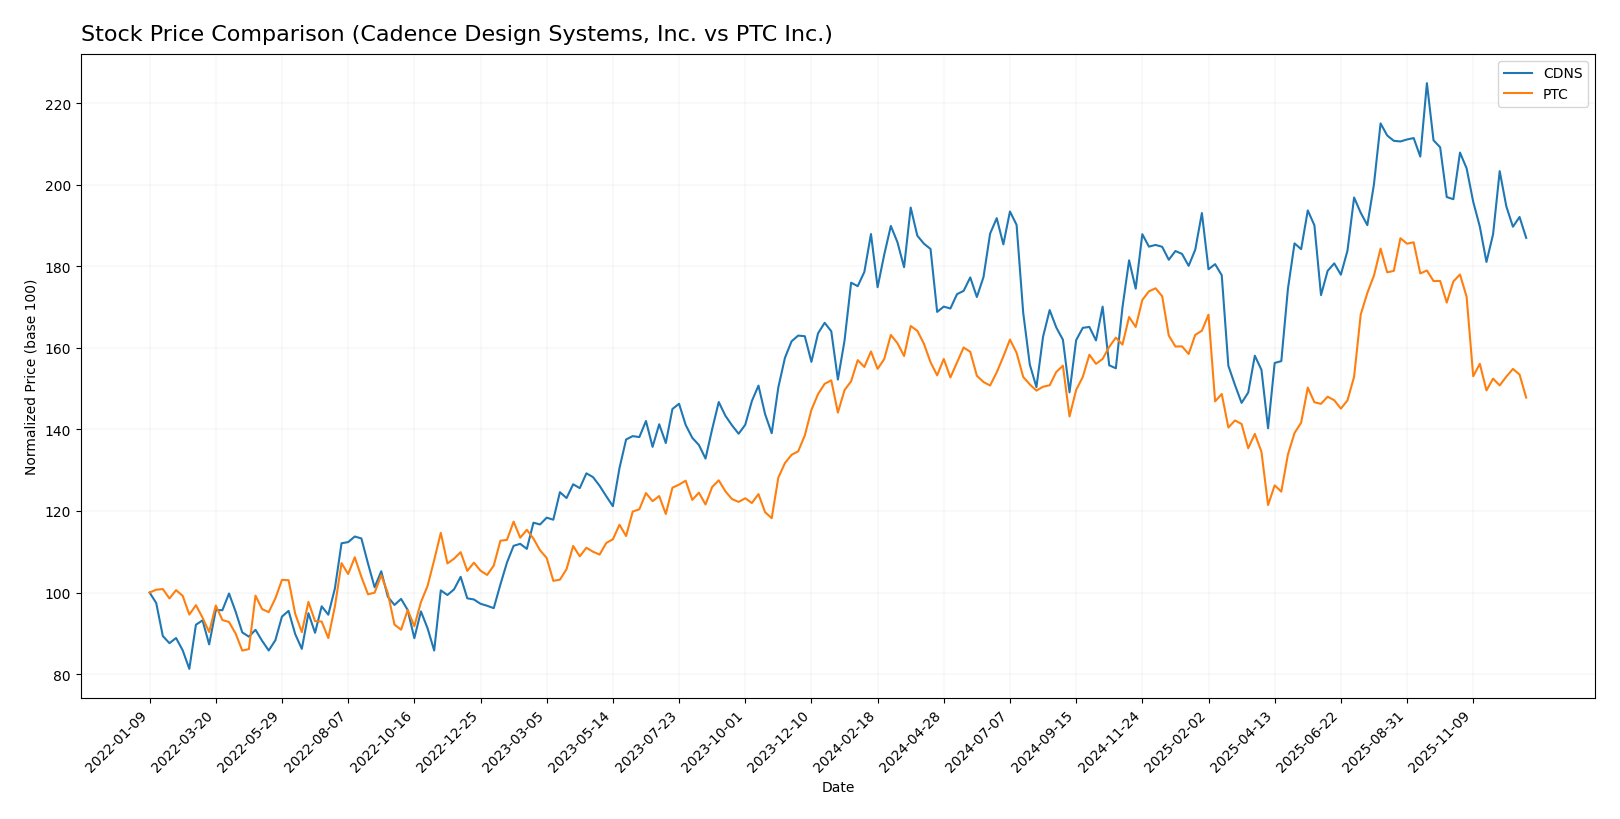
The stock price movements of Cadence Design Systems, Inc. (CDNS) and PTC Inc. over the past year reveal distinct bearish trends with varying degrees of deceleration and volatility, highlighting divergent trading dynamics.
Trend Analysis
Cadence Design Systems, Inc. (CDNS) experienced a slight bearish trend over the past 12 months with a -0.49% price change and decelerating momentum. The stock showed a high volatility level, with prices ranging between 232.88 and 373.35.
PTC Inc. displayed a stronger bearish trend with a -7.1% price decline over the same period, also accompanied by deceleration. The stock’s price fluctuated between 139.77 and 215.05, with notable volatility.
Comparing the two, CDNS delivered a milder negative performance than PTC, which recorded a more pronounced price drop, indicating CDNS was relatively more stable in market performance.
Target Prices
The current analyst consensus presents a solid outlook with defined target ranges for these technology firms.
| Company | Target High | Target Low | Consensus |
|---|---|---|---|
| Cadence Design Systems, Inc. | 418 | 275 | 381 |
| PTC Inc. | 255 | 120 | 213.25 |
Analysts expect Cadence Design Systems shares to appreciate above the current price of $310.4, showing confidence in growth. PTC’s consensus target of $213.25 also indicates upside potential from its current $170.1 price level.
Analyst Opinions Comparison
This section compares analysts’ ratings and grades for Cadence Design Systems, Inc. and PTC Inc.:
Rating Comparison
Cadence Design Systems, Inc. Rating
- Rating: B, considered very favorable by analysts.
- Discounted Cash Flow Score: Moderate at 3, indicating average valuation.
- ROE Score: Favorable at 4, showing efficient profit generation.
- ROA Score: Very favorable at 5, strong asset utilization.
- Debt To Equity Score: Moderate at 2, reflecting average financial risk.
- Overall Score: Moderate at 3, reflecting a balanced financial standing.
PTC Inc. Rating
- Rating: B+, considered very favorable by analysts.
- Discounted Cash Flow Score: Favorable at 4, suggesting better valuation.
- ROE Score: Favorable at 4, also indicating efficient profit generation.
- ROA Score: Very favorable at 5, equally strong asset utilization.
- Debt To Equity Score: Moderate at 2, similar average financial risk.
- Overall Score: Moderate at 3, also indicating balanced financial standing.
Which one is the best rated?
PTC Inc. holds a slightly higher rating (B+) than Cadence Design Systems (B) and a better discounted cash flow score, while both share similar scores in ROE, ROA, debt to equity, and overall ratings.
Scores Comparison
Here is a comparison of the Altman Z-Score and Piotroski Score for Cadence Design Systems, Inc. and PTC Inc.:
CDNS Scores
- Altman Z-Score: 14.1, indicating a safe zone with very low bankruptcy risk.
- Piotroski Score: 7, reflecting strong financial health and value potential.
PTC Scores
- Altman Z-Score: 5.9, indicating a safe zone with low bankruptcy risk.
- Piotroski Score: 8, reflecting very strong financial health and value potential.
Which company has the best scores?
Based on the provided data, CDNS has a higher Altman Z-Score indicating more financial stability, while PTC leads with a stronger Piotroski Score, suggesting better overall financial strength.
Grades Comparison
Here is an overview of the recent grades assigned to Cadence Design Systems, Inc. and PTC Inc. by reputable grading companies:
Cadence Design Systems, Inc. Grades
The following table summarizes the recent grades from well-known financial institutions for Cadence Design Systems, Inc.:
| Grading Company | Action | New Grade | Date |
|---|---|---|---|
| Needham | Maintain | Buy | 2025-12-22 |
| Oppenheimer | Maintain | Underperform | 2025-10-28 |
| Needham | Maintain | Buy | 2025-10-28 |
| Wells Fargo | Maintain | Overweight | 2025-10-28 |
| Baird | Maintain | Outperform | 2025-10-28 |
| JP Morgan | Maintain | Overweight | 2025-10-28 |
| Rosenblatt | Maintain | Neutral | 2025-10-28 |
| Rosenblatt | Maintain | Neutral | 2025-10-22 |
| Loop Capital | Maintain | Buy | 2025-07-29 |
| Mizuho | Maintain | Outperform | 2025-07-29 |
Grades for Cadence Design Systems show a mix of Buy, Overweight, and Outperform ratings, with some Neutral and Underperform opinions, indicating varied analyst views.
PTC Inc. Grades
The following table presents the most recent grades from established grading companies for PTC Inc.:
| Grading Company | Action | New Grade | Date |
|---|---|---|---|
| Piper Sandler | Maintain | Neutral | 2025-11-07 |
| Rosenblatt | Maintain | Buy | 2025-11-06 |
| Rosenblatt | Maintain | Buy | 2025-10-30 |
| Barclays | Maintain | Overweight | 2025-07-31 |
| Piper Sandler | Maintain | Neutral | 2025-07-31 |
| Oppenheimer | Maintain | Outperform | 2025-07-31 |
| Rosenblatt | Maintain | Buy | 2025-07-31 |
| RBC Capital | Maintain | Outperform | 2025-07-31 |
| Keybanc | Maintain | Overweight | 2025-07-31 |
| Stifel | Maintain | Buy | 2025-07-31 |
PTC Inc. has predominantly Buy, Outperform, and Overweight ratings, with some Neutral grades, reflecting generally positive analyst sentiment.
Which company has the best grades?
PTC Inc. has received a higher concentration of Buy and Outperform grades compared to Cadence Design Systems, which shows more mixed ratings including Underperform and Neutral. This difference could influence investor perception of growth potential and risk.
Strengths and Weaknesses
Below is a comparative overview of key strengths and weaknesses for Cadence Design Systems, Inc. (CDNS) and PTC Inc. (PTC) based on their latest financial and operational data.
| Criterion | Cadence Design Systems, Inc. (CDNS) | PTC Inc. (PTC) |
|---|---|---|
| Diversification | Strong focus on product and maintenance (4.2B USD in 2024) with growing technology services | Balanced revenue streams with strong cloud services (1.47B USD) and license segments (1.16B USD) in 2025 |
| Profitability | Favorable profitability: net margin 22.74%, ROIC 13.43%, but declining ROIC trend | Higher net margin at 26.8%, ROIC 14.43%, with a growing ROIC trend indicating improving profitability |
| Innovation | Consistent investment in technology services, though ROIC decline suggests pressure on returns | Robust innovation reflected in growing profitability and significant cloud service revenues |
| Global presence | Well-established in global markets, supported by strong asset turnover and liquidity ratios | Global reach with a diverse product portfolio and solid debt management, though lower asset turnover |
| Market Share | Leading position in electronic design automation with sustained revenue growth | Strong market share in CAD/PLM software with expanding cloud services presence |
Key takeaways: Both companies demonstrate solid financial health and innovation capacity. CDNS shows strong value creation but faces a declining profitability trend, while PTC enjoys rising profitability and durable competitive advantages. Investors should weigh CDNS’s market leadership against PTC’s growth momentum.
Risk Analysis
Below is a comparison of key risk factors for Cadence Design Systems, Inc. (CDNS) and PTC Inc. (PTC) based on the latest available data:
| Metric | Cadence Design Systems, Inc. (CDNS) | PTC Inc. (PTC) |
|---|---|---|
| Market Risk | Beta 1.05 – Moderate market volatility sensitivity | Beta 1.03 – Moderate market volatility sensitivity |
| Debt level | Debt/Equity 0.55 – Moderate leverage | Debt/Equity 0.36 – Lower leverage, stronger balance sheet |
| Regulatory Risk | Moderate – tech sector regulatory scrutiny | Moderate – similar tech sector exposure |
| Operational Risk | Moderate – complex IC design tools and services | Moderate – diverse software product portfolio |
| Environmental Risk | Low – primarily software business | Low – primarily software business |
| Geopolitical Risk | Moderate – global supply chain dependencies | Moderate – global operations and client base |
The most impactful risks are market volatility and operational complexity for both companies. Cadence’s higher leverage suggests a slightly elevated financial risk compared to PTC. Both firms operate in regulated tech environments with moderate geopolitical exposures, but their strong financial health and safe Altman Z-scores mitigate bankruptcy risk effectively.
Which Stock to Choose?
Cadence Design Systems, Inc. (CDNS) shows a favorable income evolution with 13.48% revenue growth in 2024 and strong profitability metrics, including a 22.74% net margin and a 22.58% ROE. Its debt profile is moderate, with a net debt to EBITDA of -0.04, and it holds a very favorable “B” rating. The company creates value with a positive ROIC to WACC spread, despite a declining ROIC trend.
PTC Inc. (PTC) exhibits robust income growth, with 19.18% revenue growth in 2025 and a 26.8% net margin. It maintains favorable financial ratios such as a 19.18% ROE and moderate debt levels (net debt to EBITDA of 1.05). Its overall rating is very favorable “B+,” reflecting strong value creation, supported by a growing ROIC above WACC.
For investors, PTC might appear more suitable for those valuing durable competitive advantages and income growth, given its very favorable rating and improving profitability. Conversely, CDNS could be of interest to those focused on established profitability and solid balance sheet metrics, despite its slightly declining ROIC trend.
Disclaimer: Investment carries a risk of loss of initial capital. The past performance is not a reliable indicator of future results. Be sure to understand risks before making an investment decision.
Go Further
I encourage you to read the complete analyses of Cadence Design Systems, Inc. and PTC Inc. to enhance your investment decisions: