In today’s fast-evolving technology landscape, Cadence Design Systems, Inc. and Perfect Corp. stand out as innovative players in the software application sector. Cadence excels in integrated circuit design and verification tools, while Perfect Corp. leads in AI-driven beauty and fashion tech solutions. Their shared focus on cutting-edge software and digital innovation makes this comparison compelling. Join me as we explore which company offers the most promising investment opportunity.
Table of contents
Companies Overview
I will begin the comparison between Cadence Design Systems, Inc. and Perfect Corp. by providing an overview of these two companies and their main differences.
Cadence Design Systems, Inc. Overview
Cadence Design Systems, Inc. develops software, hardware, and services for integrated circuit (IC) design and verification. The company focuses on functional verification platforms, digital IC design tools, and custom IC design products to serve markets like 5G communications, aerospace, automotive, and healthcare. Founded in 1987 and headquartered in San Jose, California, Cadence is a leading player in the semiconductor design industry with a market cap of $86.4B.
Perfect Corp. Overview
Perfect Corp. offers SaaS solutions using artificial intelligence and augmented reality for beauty and fashion technology applications. Its product suite includes virtual try-on tools for makeup, hair, glasses, and accessories, along with AI-driven analysis features. Founded in 2015 and based in New Taipei City, Taiwan, Perfect Corp. operates with a market cap of $179M, targeting consumer engagement in the beauty tech sector through innovative AR experiences.
Key similarities and differences
Both companies operate in the technology sector with a focus on software applications, but their business models diverge significantly. Cadence specializes in electronic design automation for semiconductor industries, emphasizing complex IC verification and design tools. In contrast, Perfect Corp. targets consumer-facing beauty and fashion markets using AI and AR technologies. While Cadence serves large industrial markets, Perfect Corp. focuses on enhancing digital consumer experiences.
Income Statement Comparison
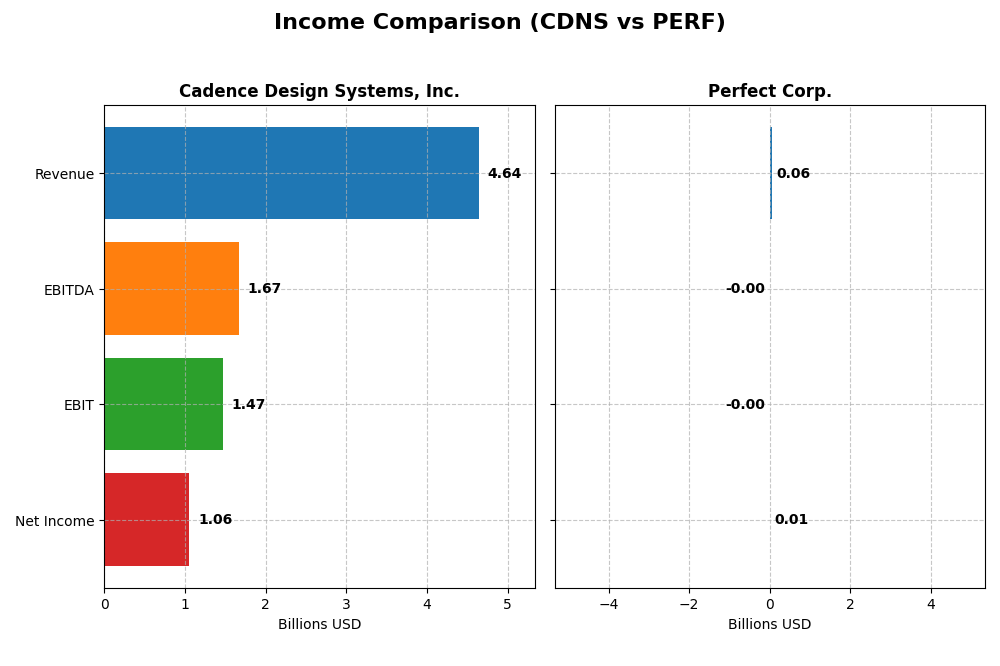
The table below provides a side-by-side comparison of key income statement metrics for Cadence Design Systems, Inc. and Perfect Corp. for the fiscal year 2024.
| Metric | Cadence Design Systems, Inc. (CDNS) | Perfect Corp. (PERF) |
|---|---|---|
| Market Cap | 86.4B | 179M |
| Revenue | 4.64B | 60.2M |
| EBITDA | 1.67B | -2.05M |
| EBIT | 1.47B | -2.84M |
| Net Income | 1.06B | 5.02M |
| EPS | 3.89 | 0.05 |
| Fiscal Year | 2024 | 2024 |
Income Statement Interpretations
Cadence Design Systems, Inc.
Cadence showed strong revenue growth from 2020 to 2024, increasing from $2.68B to $4.64B, with net income rising from $591M to $1.06B. Margins remained robust, with a gross margin around 86% and net margin near 23%. The latest year saw a 13.5% revenue increase, stable margins, and a slight dip in net margin growth, signaling steady operational performance.
Perfect Corp.
Perfect Corp. demonstrated rapid revenue expansion, doubling from $29.9M in 2020 to $60.2M in 2024, with net income improving from a loss of $5.6M to a profit of $5M. Gross margin was favorable at 78%, but EBIT margin remained negative at -4.7%. The latest year showed 12.5% revenue growth but a notable decline in EBIT and net margin, reflecting ongoing profitability challenges despite top-line gains.
Which one has the stronger fundamentals?
Cadence Design Systems exhibits stronger fundamentals with consistently higher margins, positive EBIT, and substantial net income growth. Perfect Corp. posts impressive revenue and net income growth rates, but its persistent negative EBIT margin and recent margin contractions raise concerns. Overall, Cadence’s stable profitability and margin control provide a more solid income statement foundation.
Financial Ratios Comparison
The table below presents the most recent fiscal year (2024) financial ratios for Cadence Design Systems, Inc. and Perfect Corp., facilitating a side-by-side comparison of key performance and financial health metrics.
| Ratios | Cadence Design Systems, Inc. (CDNS) | Perfect Corp. (PERF) |
|---|---|---|
| ROE | 22.58% | 3.42% |
| ROIC | 13.43% | -2.10% |
| P/E | 77.20 | 56.60 |
| P/B | 17.44 | 1.93 |
| Current Ratio | 2.93 | 5.52 |
| Quick Ratio | 2.74 | 5.52 |
| D/E | 0.55 | 0.0035 |
| Debt-to-Assets | 28.80% | 0.28% |
| Interest Coverage | 17.77 | -449 |
| Asset Turnover | 0.52 | 0.33 |
| Fixed Asset Turnover | 7.68 | 57.94 |
| Payout Ratio | 0% | 0% |
| Dividend Yield | 0% | 0% |
Interpretation of the Ratios
Cadence Design Systems, Inc.
Cadence Design Systems shows a favorable overall ratio profile with strong net margin (22.74%) and return on equity (22.58%), indicating solid profitability and efficient capital use. However, high PE (77.2) and PB (17.44) ratios raise valuation concerns. The current and quick ratios are robust, supporting liquidity. Cadence does not pay dividends, likely focusing on reinvestment and growth opportunities.
Perfect Corp.
Perfect Corp. displays mixed ratios with a neutral net margin (8.34%) but unfavorable returns on equity (3.42%) and invested capital (-2.1%). The company maintains a favorable debt profile but suffers from poor interest coverage (-406.29) and weak asset turnover (0.33). It also pays no dividends, likely due to its reinvestment strategy or growth phase given its recent IPO and operational focus.
Which one has the best ratios?
Cadence Design Systems holds a more favorable ratio set overall, with strong profitability, returns, and liquidity ratios outweighing valuation concerns. Perfect Corp. shows several unfavorable metrics, particularly in profitability and debt servicing. Thus, Cadence presents a comparatively stronger financial ratio profile based on the latest data.
Strategic Positioning
This section compares the strategic positioning of Cadence Design Systems, Inc. and Perfect Corp., focusing on Market position, Key segments, and Exposure to technological disruption:
Cadence Design Systems, Inc.
- Leading global software provider in IC design; faces competition in software application industry.
- Serves diverse markets including 5G, aerospace, automotive, healthcare, and consumer electronics.
- Exposure to evolving semiconductor design technologies; innovation critical to maintain relevance.
Perfect Corp.
- Smaller market cap; specializes in AI and AR beauty tech solutions with niche competitive pressures.
- Focused on SaaS AI and AR applications for beauty and fashion industries with specialized product lines.
- Relies on advancements in AI and AR technologies; disruption potential from rapid tech evolution in beauty tech.
Cadence Design Systems, Inc. vs Perfect Corp. Positioning
Cadence Design Systems exhibits a diversified strategic approach across multiple high-tech segments, providing stability but facing broad competition. Perfect Corp. follows a concentrated strategy in AI-driven beauty and fashion tech, offering focused innovation but narrower market reach.
Which has the best competitive advantage?
Cadence shows a slightly favorable moat with value creation despite declining ROIC, indicating established competitive strength. Perfect Corp. has a slightly unfavorable moat, shedding value though improving profitability, reflecting emerging but less stable competitive advantage.
Stock Comparison
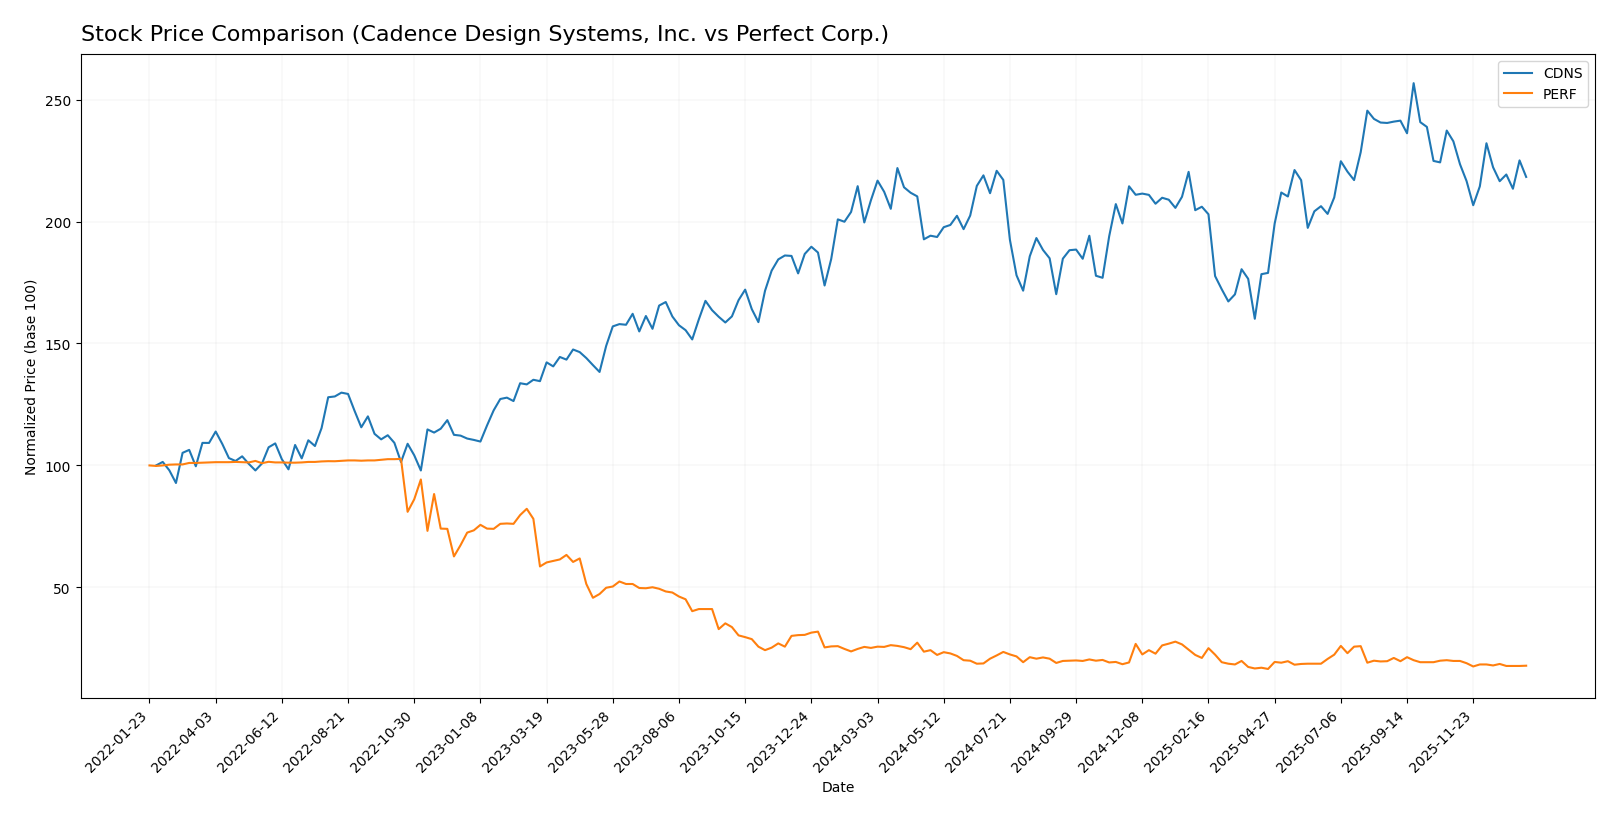
The stock price movements over the past 12 months reflect contrasting trends, with Cadence Design Systems, Inc. showing a moderate bullish trajectory despite recent deceleration, while Perfect Corp. experiences a sustained bearish trend marked by significant declines.
Trend Analysis
Cadence Design Systems, Inc. (CDNS) posted a 4.59% price increase over the past year, indicating a bullish trend with deceleration. The stock ranged between 232.88 and 373.35, showing notable volatility (std deviation 29.12).
Perfect Corp. (PERF) recorded a -28.98% price change over the same period, confirming a bearish trend with deceleration. Its price fluctuated narrowly between 1.61 and 2.7, with low volatility (std deviation 0.27).
Comparing both, CDNS delivered the highest market performance with a positive price change, while PERF showed a significant decline, reflecting weaker market momentum.
Target Prices
The consensus target prices reflect optimistic outlooks by analysts for Cadence Design Systems, Inc. and Perfect Corp.
| Company | Target High | Target Low | Consensus |
|---|---|---|---|
| Cadence Design Systems, Inc. | 418 | 275 | 381 |
| Perfect Corp. | 7 | 7 | 7 |
Analysts expect Cadence’s stock to appreciate from the current price of $317.45 toward the consensus target of $381, signaling moderate upside potential. Perfect Corp.’s target price at $7 is significantly above its current price of $1.74, suggesting high growth expectations.
Analyst Opinions Comparison
This section compares analysts’ ratings and grades for Cadence Design Systems, Inc. and Perfect Corp.:
Rating Comparison
CDNS Rating
- Rating: B, evaluated as Very Favorable
- Discounted Cash Flow Score: 3, Moderate status
- ROE Score: 4, Favorable status
- ROA Score: 5, Very Favorable status
- Debt To Equity Score: 2, Moderate status
- Overall Score: 3, Moderate status
PERF Rating
- Rating: A-, evaluated as Very Favorable
- Discounted Cash Flow Score: 5, Very Favorable status
- ROE Score: 2, Moderate status
- ROA Score: 3, Moderate status
- Debt To Equity Score: 4, Favorable status
- Overall Score: 4, Favorable status
Which one is the best rated?
Based strictly on the provided data, Perfect Corp. holds a higher overall rating (A- vs. B) and scores better in discounted cash flow, debt to equity, and overall scores. Cadence Design Systems scores higher in ROE and ROA but has a lower overall score.
Scores Comparison
Here is a comparison of the Altman Z-Score and Piotroski Score for Cadence Design Systems, Inc. and Perfect Corp.:
CDNS Scores
- Altman Z-Score: 14.51, indicating safe zone with very low bankruptcy risk.
- Piotroski Score: 7, classified as strong financial health.
PERF Scores
- Altman Z-Score: 1.31, in distress zone implying high bankruptcy risk.
- Piotroski Score: 6, reflecting average financial strength.
Which company has the best scores?
Based on the provided scores, Cadence Design Systems shows significantly better financial health with a safe zone Altman Z-Score and a strong Piotroski Score. Perfect Corp. is in distress zone with a lower Piotroski Score, indicating weaker financial stability.
Grades Comparison
Here is a detailed comparison of the recent grades assigned to Cadence Design Systems, Inc. and Perfect Corp.:
Cadence Design Systems, Inc. Grades
The following table summarizes the latest grading actions from reputable firms for Cadence Design Systems, Inc.:
| Grading Company | Action | New Grade | Date |
|---|---|---|---|
| Needham | Maintain | Buy | 2025-12-22 |
| Wells Fargo | Maintain | Overweight | 2025-10-28 |
| Baird | Maintain | Outperform | 2025-10-28 |
| Needham | Maintain | Buy | 2025-10-28 |
| JP Morgan | Maintain | Overweight | 2025-10-28 |
| Oppenheimer | Maintain | Underperform | 2025-10-28 |
| Rosenblatt | Maintain | Neutral | 2025-10-28 |
| Rosenblatt | Maintain | Neutral | 2025-10-22 |
| Needham | Maintain | Buy | 2025-07-29 |
| Loop Capital | Maintain | Buy | 2025-07-29 |
Overall, Cadence maintains a predominantly positive consensus with multiple Buy and Overweight ratings, alongside a few Neutral and one Underperform, indicating a generally favorable outlook.
Perfect Corp. Grades
The following table summarizes the latest grading actions from reputable firms for Perfect Corp.:
| Grading Company | Action | New Grade | Date |
|---|---|---|---|
| Piper Sandler | Maintain | Neutral | 2024-02-29 |
| Goldman Sachs | Maintain | Neutral | 2023-10-26 |
| Piper Sandler | Maintain | Neutral | 2023-10-25 |
| Piper Sandler | Maintain | Neutral | 2023-07-26 |
| Piper Sandler | Maintain | Neutral | 2023-07-25 |
| Piper Sandler | Maintain | Neutral | 2023-04-27 |
| Oppenheimer | Downgrade | Perform | 2023-04-20 |
| Oppenheimer | Downgrade | Perform | 2023-04-19 |
| Oppenheimer | Downgrade | Perform | 2023-04-18 |
| Piper Sandler | Maintain | Neutral | 2023-03-08 |
Perfect Corp. exhibits consistently Neutral ratings with a recent downgrade from Outperform to Perform, reflecting a more cautious stance.
Which company has the best grades?
Cadence Design Systems clearly holds the stronger grades, with a majority of Buy and Overweight ratings compared to Perfect Corp.’s Neutral consensus. This disparity may influence investor perceptions of growth and risk between these two companies.
Strengths and Weaknesses
The table below compares the key strengths and weaknesses of Cadence Design Systems, Inc. (CDNS) and Perfect Corp. (PERF) based on recent financial and strategic data.
| Criterion | Cadence Design Systems, Inc. (CDNS) | Perfect Corp. (PERF) |
|---|---|---|
| Diversification | Moderate diversification with a stable product and maintenance segment plus growing technology services revenue | Limited diversification; primarily focused on core business segments |
| Profitability | Strong profitability: 22.74% net margin, 22.58% ROE, 13.43% ROIC; creating value | Lower profitability: 8.34% net margin, 3.42% ROE, -2.1% ROIC; currently shedding value |
| Innovation | Consistent investment in R&D and product development | Increasing profitability trend suggests improving innovation but still unprofitable |
| Global presence | Well-established global footprint with growing revenues | Smaller global footprint; financials suggest early growth stage |
| Market Share | Solid market share in electronic design automation | Emerging market presence with growth potential |
In summary, Cadence Design Systems exhibits strong profitability and a solid market position despite a recent decline in ROIC trend. Perfect Corp. is improving its profitability but remains unprofitable overall, indicating higher risk but potential for growth. Investors should balance Cadence’s stability against Perfect’s growth prospects while managing risk accordingly.
Risk Analysis
The table below summarizes key risk factors for Cadence Design Systems, Inc. (CDNS) and Perfect Corp. (PERF) based on their most recent financial and operational data for 2024.
| Metric | Cadence Design Systems, Inc. (CDNS) | Perfect Corp. (PERF) |
|---|---|---|
| Market Risk | Beta 1.02, moderate market volatility | Beta 0.45, lower market sensitivity |
| Debt level | Moderate, debt-to-equity 0.55 (neutral) | Very low, debt-to-equity 0.0 (favorable) |
| Regulatory Risk | US tech sector, subject to IP and export controls | Taiwan-based, exposure to regional regulatory changes |
| Operational Risk | Large scale, complex product lines with 12.8K employees | Smaller scale, 342 employees, dependency on AI tech innovation |
| Environmental Risk | Moderate, industry energy use but limited emissions | Low, software-based with limited physical footprint |
| Geopolitical Risk | US-based, sensitive to US-China tech tensions | Taiwan-based, exposed to cross-strait geopolitical tensions |
In synthesis, Cadence faces moderate market and operational risks due to its scale and exposure to US regulatory frameworks, with manageable debt levels. Perfect Corp. has lower market and debt risks but is more vulnerable to geopolitical tensions in Taiwan and operational risks tied to its smaller size and tech dependency. Investors should weigh geopolitical and operational risks carefully as they hold the most potential impact for these companies in 2026.
Which Stock to Choose?
Cadence Design Systems, Inc. (CDNS) shows a favorable income evolution with 13.48% revenue growth in 2024 and strong profitability metrics, including a 22.74% net margin and 22.58% ROE. Its debt levels are moderate, with a 28.8% debt-to-assets ratio, and it holds a very favorable B rating reflecting solid financial health.
Perfect Corp. (PERF) demonstrates favorable revenue growth of 12.52% in 2024 but struggles with profitability, evidenced by an 8.34% net margin and a low 3.42% ROE. It maintains very low debt and a strong A- rating, though its operating returns are slightly unfavorable, indicating challenges in value creation.
Investors focused on stable profitability and efficient capital use might find CDNS’s favorable financial ratios and strong rating more appealing, while those prioritizing growth potential despite profitability challenges may see PERF’s improving income and rating as indicative of possible future improvement.
Disclaimer: Investment carries a risk of loss of initial capital. The past performance is not a reliable indicator of future results. Be sure to understand risks before making an investment decision.
Go Further
I encourage you to read the complete analyses of Cadence Design Systems, Inc. and Perfect Corp. to enhance your investment decisions: