In the fast-evolving software application sector, Cadence Design Systems, Inc. and Pegasystems Inc. stand out as influential players with distinct yet overlapping market focuses. Cadence specializes in integrated circuit design and verification tools, while Pegasystems leads in enterprise customer engagement and automation software. Their innovation strategies and industry reach invite a detailed comparison. Join me as we explore which company offers the most compelling opportunity for investors in 2026.
Table of contents
Companies Overview
I will begin the comparison between Cadence Design Systems and Pegasystems by providing an overview of these two companies and their main differences.
Cadence Design Systems Overview
Cadence Design Systems, Inc. specializes in software, hardware, and services for integrated circuit design and verification. The company offers a broad portfolio including functional verification platforms, digital IC design tools, and custom IC simulation products. Serving sectors such as 5G communications, aerospace, automotive, and healthcare, Cadence is positioned as a key player in the semiconductor design industry with a market cap of $86.4B.
Pegasystems Overview
Pegasystems Inc. develops enterprise software applications focused on customer engagement, digital process automation, and intelligent automation. Its offerings include Pega Platform, Pega Infinity, and cloud services, catering primarily to financial services, healthcare, government, and manufacturing sectors. With a market cap of $8.9B, Pegasystems operates globally, providing software and support through direct sales and partnerships.
Key similarities and differences
Both Cadence and Pegasystems operate in the software application industry but differ in focus and scale. Cadence targets semiconductor design and verification with a large market cap and extensive hardware integration, while Pegasystems centers on enterprise software for customer relationship management and automation, with a smaller market cap. Each serves diverse industries, yet their core business models address distinct technological needs.
Income Statement Comparison
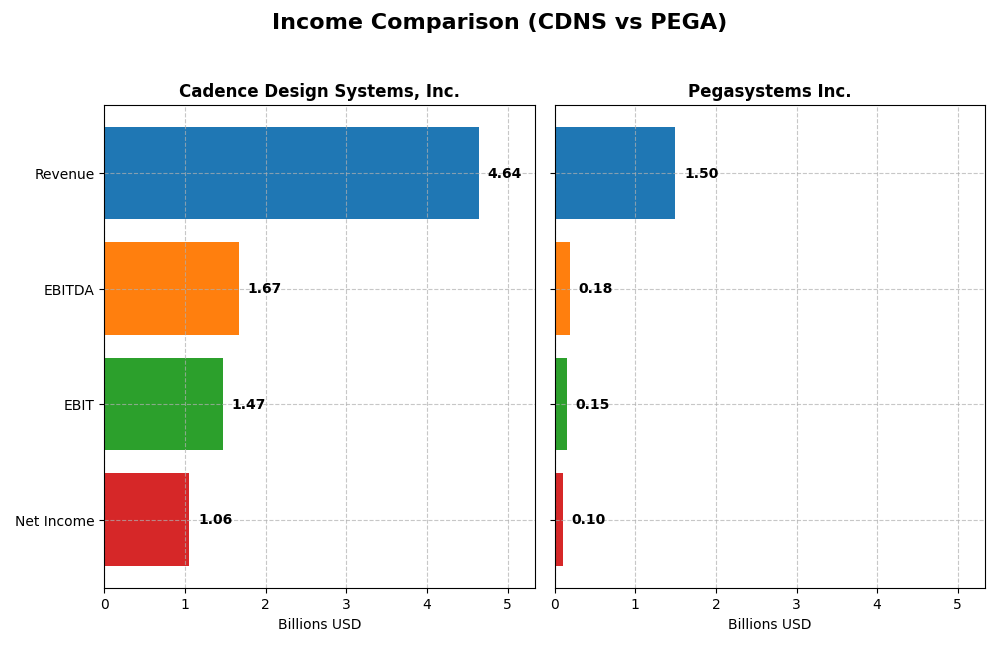
This table provides a side-by-side comparison of key income statement metrics for Cadence Design Systems, Inc. and Pegasystems Inc. for the fiscal year 2024.
| Metric | Cadence Design Systems, Inc. | Pegasystems Inc. |
|---|---|---|
| Market Cap | 86.4B | 8.9B |
| Revenue | 4.64B | 1.50B |
| EBITDA | 1.67B | 185M |
| EBIT | 1.47B | 149M |
| Net Income | 1.06B | 99M |
| EPS | 3.89 | 0.58 |
| Fiscal Year | 2024 | 2024 |
Income Statement Interpretations
Cadence Design Systems, Inc.
Cadence Design Systems experienced strong revenue growth from 2020 to 2024, rising from $2.68B to $4.64B, with net income increasing from $591M to $1.06B. Margins remained robust, supported by a favorable gross margin of 86.05% and an EBIT margin of 31.71%. In 2024, revenue growth accelerated to 13.5%, though net margin contracted slightly by 10.7%, indicating some pressure on profitability despite overall positive trends.
Pegasystems Inc.
Pegasystems showed steady revenue growth over the five-year period, from $1.02B in 2020 to $1.50B in 2024, with net income turning positive and climbing to $99M from negative territory. Its gross margin remained favorable at 73.91%, while EBIT margin was neutral at 9.98%. The latest year saw moderate revenue growth of 4.5%, with strong improvements in net margin by nearly 40%, reflecting enhanced operational efficiency and profitability.
Which one has the stronger fundamentals?
Both companies exhibit favorable income statement fundamentals, with Cadence demonstrating stronger absolute revenue and net income growth and higher margins, highlighting operational strength. Pegasystems, while smaller, shows remarkable net income and margin improvements from losses, signaling a turnaround. Cadence’s higher margins contrast with Pegasystems’ rapid profitability gains, presenting different but favorable financial profiles.
Financial Ratios Comparison
Below is a comparison of key financial ratios for Cadence Design Systems, Inc. (CDNS) and Pegasystems Inc. (PEGA) based on the most recent fiscal year 2024 data.
| Ratios | Cadence Design Systems, Inc. (CDNS) | Pegasystems Inc. (PEGA) |
|---|---|---|
| ROE | 22.58% | 16.94% |
| ROIC | 13.43% | 7.40% |
| P/E | 77.20 | 80.12 |
| P/B | 17.44 | 13.57 |
| Current Ratio | 2.93 | 1.23 |
| Quick Ratio | 2.74 | 1.23 |
| D/E (Debt-to-Equity) | 0.55 | 0.94 |
| Debt-to-Assets | 28.80% | 31.09% |
| Interest Coverage | 17.77 | 18.12 |
| Asset Turnover | 0.52 | 0.85 |
| Fixed Asset Turnover | 7.68 | 14.36 |
| Payout Ratio | 0% | 10.28% |
| Dividend Yield | 0% | 0.13% |
Interpretation of the Ratios
Cadence Design Systems, Inc.
Cadence’s ratios are generally strong, with favorable net margin (22.74%), ROE (22.58%), and ROIC (13.43%), supported by a solid current ratio of 2.93 and low debt-to-assets at 28.8%. However, high PE (77.2) and PB (17.44) ratios are unfavorable, indicating a potentially expensive valuation. The company does not pay dividends, likely reinvesting profits for growth and maintaining financial flexibility.
Pegasystems Inc.
Pegasystems shows a mixed ratio profile, with favorable ROE (16.94%) and interest coverage (21.87), but neutral net margin (6.63%) and ROIC (7.4%). Its valuation ratios, PE (80.12) and PB (13.57), are unfavorable, and liquidity ratios are mostly neutral except for a favorable quick ratio (1.23). PEGA pays a small dividend yield of 0.13%, suggesting modest shareholder returns amid cautious payout sustainability.
Which one has the best ratios?
Cadence Design Systems exhibits a more favorable overall ratio set, with stronger profitability, liquidity, and lower leverage concerns compared to Pegasystems. While both companies face high valuation multiples and some neutral metrics, Cadence’s broader favorable financial indicators and reinvestment strategy contrast with Pegasystems’ mixed performance and small dividend payout.
Strategic Positioning
This section compares the strategic positioning of Cadence Design Systems, Inc. and Pegasystems Inc., including market position, key segments, and exposure to technological disruption:
Cadence Design Systems, Inc.
- Leading in software for IC design and verification, facing competition in tech-heavy markets.
- Key segments include IC design tools, functional verification, and IP products driving growth.
- Operates in established chip design tech with ongoing innovation in hardware and software platforms.
Pegasystems Inc.
- Focused on enterprise software applications with direct sales and technology partnerships globally.
- Main drivers are Pega Platform, customer engagement, cloud services, and consulting in various sectors.
- Exposed to digital automation and cloud technology disruption through its Pega Cloud and automation tools.
Cadence Design Systems, Inc. vs Pegasystems Inc. Positioning
Cadence has a diversified product portfolio spanning software, hardware, and IP for chip design, offering broad market exposure. Pegasystems focuses on enterprise software and cloud solutions, with a more concentrated segment approach and service-driven model.
Which has the best competitive advantage?
Cadence shows a slightly favorable moat with value creation despite declining ROIC, indicating sustainable competitive advantages. Pegasystems has a slightly unfavorable moat, losing value but improving profitability, reflecting a less stable competitive position.
Stock Comparison
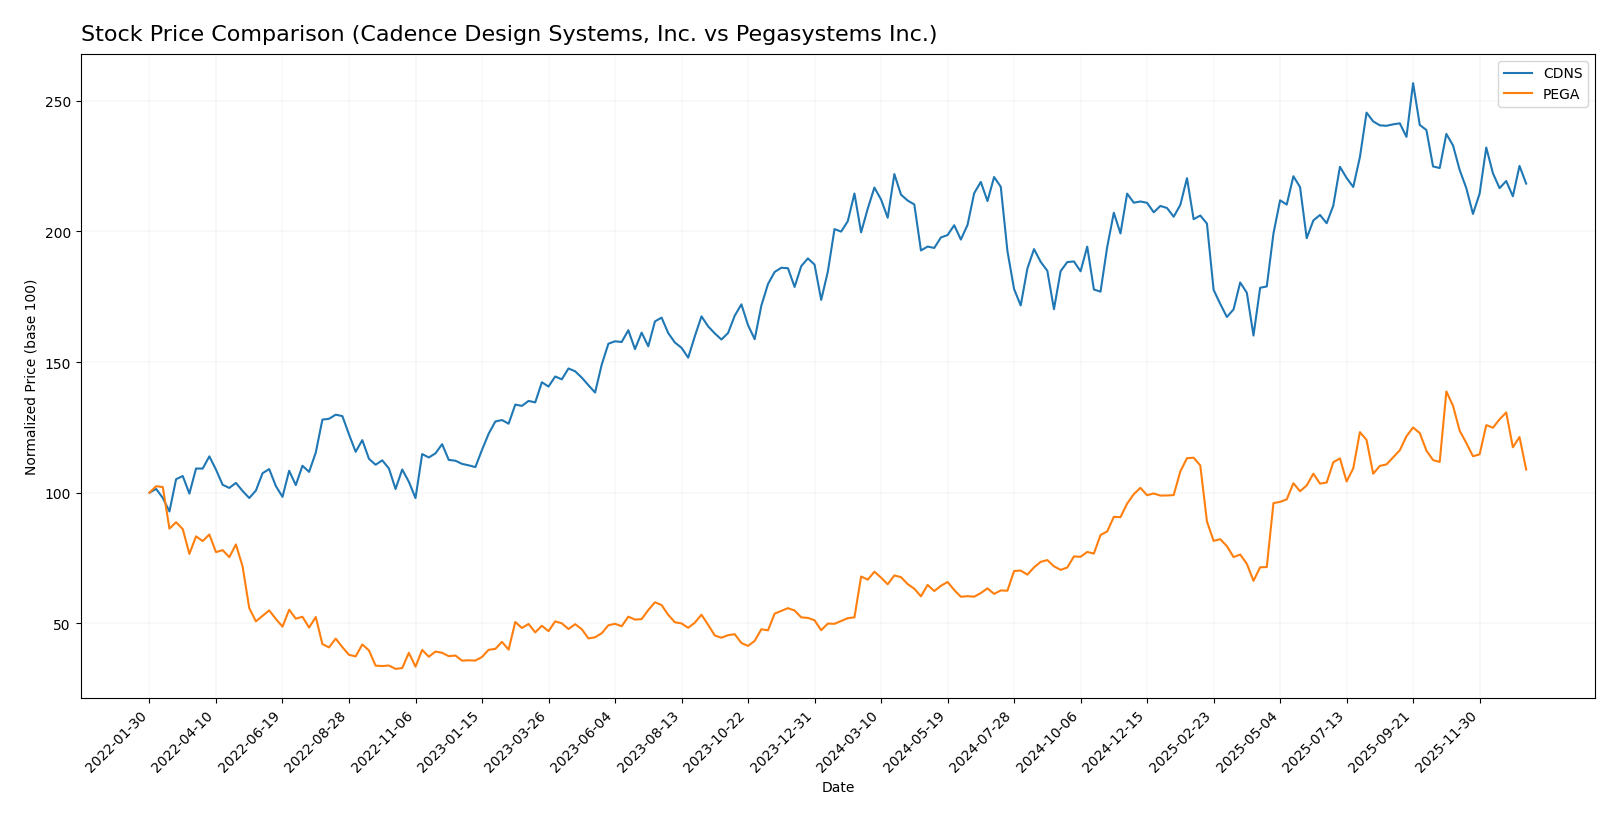
The stock prices of Cadence Design Systems, Inc. and Pegasystems Inc. have shown significant movements over the past 12 months, with both experiencing bullish trends but recent declines indicating short-term selling pressure.
Trend Analysis
Cadence Design Systems, Inc. (CDNS) recorded a 4.59% price increase over the past year, indicating a bullish trend with deceleration. The stock hit a high of 373.35 and a low of 232.88, but recent months show a -6.27% decline reflecting short-term weakness.
Pegasystems Inc. (PEGA) exhibited a strong 63.18% price gain over the last year, also bullish with deceleration. Its price ranged from 28.73 to 66.27, though recent performance weakened by -18.32%, signaling notable short-term selling pressure.
Comparing both stocks, Pegasystems Inc. delivered the highest market performance over the past year, outperforming Cadence Design Systems by a wide margin despite recent downward corrections.
Target Prices
The current analyst consensus reflects a generally positive outlook for both Cadence Design Systems, Inc. and Pegasystems Inc.
| Company | Target High | Target Low | Consensus |
|---|---|---|---|
| Cadence Design Systems, Inc. | 418 | 275 | 381 |
| Pegasystems Inc. | 80 | 67 | 74 |
Analysts expect Cadence’s stock to appreciate from its current price of $317.45 to a consensus target of $381, indicating upside potential. Pegasystems shows room to grow as well, with a consensus target of $74 versus its current price of $51.99.
Analyst Opinions Comparison
This section compares analysts’ ratings and grades for Cadence Design Systems, Inc. and Pegasystems Inc.:
Rating Comparison
CDNS Rating
- Rating: B, considered Very Favorable overall.
- Discounted Cash Flow Score: 3, indicating a Moderate valuation based on future cash flows.
- ROE Score: 4, showing a Favorable efficiency in generating profit from equity.
- ROA Score: 5, demonstrating Very Favorable asset utilization to generate earnings.
- Debt To Equity Score: 2, reflecting a Moderate financial risk due to higher leverage.
- Overall Score: 3, assessed as Moderate financial standing.
PEGA Rating
- Rating: B+, considered Very Favorable overall.
- Discounted Cash Flow Score: 3, indicating a Moderate valuation based on future cash flows.
- ROE Score: 5, showing a Very Favorable efficiency in generating profit from equity.
- ROA Score: 5, demonstrating Very Favorable asset utilization to generate earnings.
- Debt To Equity Score: 3, reflecting a Moderate financial risk with somewhat better leverage.
- Overall Score: 3, assessed as Moderate financial standing.
Which one is the best rated?
Pegasystems holds a slightly higher rating of B+ versus Cadence’s B, driven by superior scores in return on equity and debt to equity. Both companies share the same overall and discounted cash flow scores, indicating comparable moderate financial standing.
Scores Comparison
Here is a comparison of the Altman Z-Score and Piotroski Score for Cadence Design Systems and Pegasystems:
CDNS Scores
- Altman Z-Score: 14.51, indicating a safe zone, very low bankruptcy risk.
- Piotroski Score: 7, classified as strong financial health.
PEGA Scores
- Altman Z-Score: 10.31, indicating a safe zone, very low bankruptcy risk.
- Piotroski Score: 8, classified as very strong financial health.
Which company has the best scores?
Pegasystems holds a higher Piotroski Score of 8 compared to Cadence’s 7, indicating stronger financial health. Both have Altman Z-Scores well above 3, showing very low bankruptcy risk, with Cadence slightly higher numerically.
Grades Comparison
Here is the comparison of recent grades and ratings issued by verified grading companies for the two companies:
Cadence Design Systems, Inc. Grades
The following table shows recent grades and rating actions from established financial institutions for Cadence Design Systems, Inc.:
| Grading Company | Action | New Grade | Date |
|---|---|---|---|
| Needham | Maintain | Buy | 2025-12-22 |
| Wells Fargo | Maintain | Overweight | 2025-10-28 |
| Baird | Maintain | Outperform | 2025-10-28 |
| Needham | Maintain | Buy | 2025-10-28 |
| JP Morgan | Maintain | Overweight | 2025-10-28 |
| Oppenheimer | Maintain | Underperform | 2025-10-28 |
| Rosenblatt | Maintain | Neutral | 2025-10-28 |
| Rosenblatt | Maintain | Neutral | 2025-10-22 |
| Needham | Maintain | Buy | 2025-07-29 |
| Loop Capital | Maintain | Buy | 2025-07-29 |
Grades indicate a generally positive outlook, with most institutions maintaining Buy or Outperform ratings, although a single Underperform rating from Oppenheimer provides some caution.
Pegasystems Inc. Grades
The following table shows recent grades and rating actions from established financial institutions for Pegasystems Inc.:
| Grading Company | Action | New Grade | Date |
|---|---|---|---|
| JP Morgan | Maintain | Overweight | 2025-12-05 |
| Wedbush | Maintain | Outperform | 2025-10-23 |
| RBC Capital | Maintain | Outperform | 2025-10-23 |
| Barclays | Maintain | Equal Weight | 2025-10-23 |
| Rosenblatt | Maintain | Buy | 2025-10-23 |
| DA Davidson | Upgrade | Buy | 2025-10-22 |
| Rosenblatt | Maintain | Buy | 2025-10-15 |
| Rosenblatt | Maintain | Buy | 2025-07-24 |
| DA Davidson | Maintain | Neutral | 2025-07-24 |
| Wedbush | Maintain | Outperform | 2025-07-24 |
The grades for Pegasystems show a positive consensus with multiple Buy and Outperform ratings, and an upgrade from Neutral to Buy, reflecting improving analyst sentiment.
Which company has the best grades?
Both companies hold a consensus rating of “Buy,” but Cadence Design Systems exhibits a higher number of Buy ratings and Outperform designations, while Pegasystems has a mix of Buy, Outperform, and Equal Weight ratings. Investors may interpret Cadence’s stronger grade concentration as a signal of more consistent positive analyst confidence.
Strengths and Weaknesses
The following table compares key strengths and weaknesses of Cadence Design Systems, Inc. (CDNS) and Pegasystems Inc. (PEGA) based on recent financial and operational data.
| Criterion | Cadence Design Systems, Inc. (CDNS) | Pegasystems Inc. (PEGA) |
|---|---|---|
| Diversification | Focused product segments with strong growth in product & maintenance (4.21B in 2024) and technology services; moderate diversification | Diverse revenue streams including Pega Cloud (1.13B), subscription, maintenance, and consulting, but lower absolute scale |
| Profitability | High net margin (22.74%) and ROE (22.58%); ROIC 13.43% exceeding WACC (8.49%), indicating value creation but declining ROIC trend | Moderate profitability with net margin 6.63%, ROE 16.94%, ROIC 7.4% below WACC (8.58%), implying value destruction but improving ROIC trend |
| Innovation | Strong investment in technology services; robust fixed asset turnover (7.68) suggests efficient asset use | Growing ROIC and high fixed asset turnover (14.36) reflect improving innovation and operational efficiency |
| Global presence | Well-established global market presence in electronic design automation | Growing cloud-based offerings and subscription models indicate expanding global footprint |
| Market Share | Leading position in semiconductor design tools with steady revenue growth | Competitive in business process management and customer engagement software but smaller market share compared to CDNS |
In summary, Cadence Design Systems demonstrates solid profitability and value creation despite a declining ROIC trend, supported by strong product focus and operational efficiency. Pegasystems shows improving profitability trends and innovation but currently faces challenges in overall value creation. Investors should weigh stable returns from CDNS against growth potential in PEGA’s evolving business model.
Risk Analysis
Below is a comparative overview of key risks for Cadence Design Systems, Inc. (CDNS) and Pegasystems Inc. (PEGA) based on the 2024 financial data and recent market conditions:
| Metric | Cadence Design Systems, Inc. (CDNS) | Pegasystems Inc. (PEGA) |
|---|---|---|
| Market Risk | Moderate (Beta 1.02, tech sector cyclicality) | Moderate (Beta 1.08, competitive software market) |
| Debt Level | Moderate (D/E 0.55, debt-to-assets 28.8%) | Moderate to High (D/E 0.94, debt-to-assets 31.1%) |
| Regulatory Risk | Moderate (US-based, global tech regulations) | Moderate (US-based, global software compliance) |
| Operational Risk | Moderate (Complex IC design software) | Moderate (Enterprise software delivery and cloud services) |
| Environmental Risk | Low (Software sector, limited direct impact) | Low (Software sector, limited direct impact) |
| Geopolitical Risk | Moderate (Global supply chains, US-China tech tensions) | Moderate (Global operations, geopolitical instability impacts) |
The most impactful and likely risks for both companies revolve around market volatility and operational challenges inherent to the technology software sector. Cadence’s moderate debt level and strong financial stability (Altman Z-score in safe zone) mitigate bankruptcy risk despite a high valuation. Pegasystems shows slightly higher leverage and moderate profitability, which may increase sensitivity to market downturns. Geopolitical tensions affecting global tech supply chains remain a shared concern.
Which Stock to Choose?
Cadence Design Systems, Inc. (CDNS) shows favorable income growth with a 13.48% revenue increase in the last year and strong profitability metrics, including a 22.74% net margin. Its financial ratios are mostly favorable, though valuation multiples like P/E and P/B appear stretched. The company maintains manageable debt and holds a very favorable overall rating of B with a slightly favorable economic moat despite a declining ROIC trend.
Pegasystems Inc. (PEGA) exhibits moderate income growth of 4.51% last year but demonstrates a significant net income growth of 261.62% over the period. Profitability is moderate with a 6.63% net margin and mixed financial ratios. Debt levels are higher compared to CDNS, and the company holds a very favorable rating of B+ with a slightly unfavorable moat, reflecting improving but still challenged profitability metrics.
From a rating and income perspective, CDNS’s strong profitability and mostly favorable ratios might appeal to investors prioritizing stable quality and value creation, while PEGA’s rapid income growth and improving profitability could attract more growth-oriented or risk-tolerant investors. The differing economic moats and financial health suggest that the choice could depend on whether an investor prefers established value or potential growth.
Disclaimer: Investment carries a risk of loss of initial capital. The past performance is not a reliable indicator of future results. Be sure to understand risks before making an investment decision.
Go Further
I encourage you to read the complete analyses of Cadence Design Systems, Inc. and Pegasystems Inc. to enhance your investment decisions: