In the dynamic world of software applications, Cadence Design Systems, Inc. (CDNS) and Paycom Software, Inc. (PAYC) stand out as innovative leaders in their respective niches. Cadence focuses on advanced integrated circuit design and verification, while Paycom specializes in cloud-based human capital management solutions. Both companies drive technological progress but target different markets, making this comparison crucial for investors seeking growth and stability. Join me as we explore which company offers the most compelling investment opportunity in 2026.
Table of contents
Companies Overview
I will begin the comparison between Cadence Design Systems and Paycom Software by providing an overview of these two companies and their main differences.
Cadence Design Systems Overview
Cadence Design Systems, Inc. is a provider of software, hardware, services, and reusable integrated circuit design blocks worldwide. The company focuses on functional verification, digital IC design, and physical implementation tools to support chip and system design. Serving diverse markets including 5G, aerospace, automotive, and healthcare, Cadence holds a strong position in the semiconductor design software industry with a market cap of 86.4B USD.
Paycom Software Overview
Paycom Software, Inc. offers cloud-based human capital management (HCM) solutions delivered as software-as-a-service, targeting small to mid-sized U.S. companies. Its platform covers the employment lifecycle from recruitment to retirement, including payroll, talent management, and compliance functions. Founded in 1998 and publicly traded since 2014, Paycom has a market cap of 8.3B USD and focuses exclusively on the HCM software application industry.
Key similarities and differences
Both Cadence and Paycom operate in the software application industry but serve distinctly different markets—semiconductor design versus human capital management. Cadence provides a broad portfolio of hardware and software tools for chip design, while Paycom offers cloud-based SaaS solutions for workforce management. Their market caps and employee counts also differ significantly, reflecting their scale and industry focus. Both companies trade on major U.S. exchanges and maintain active trading status.
Income Statement Comparison
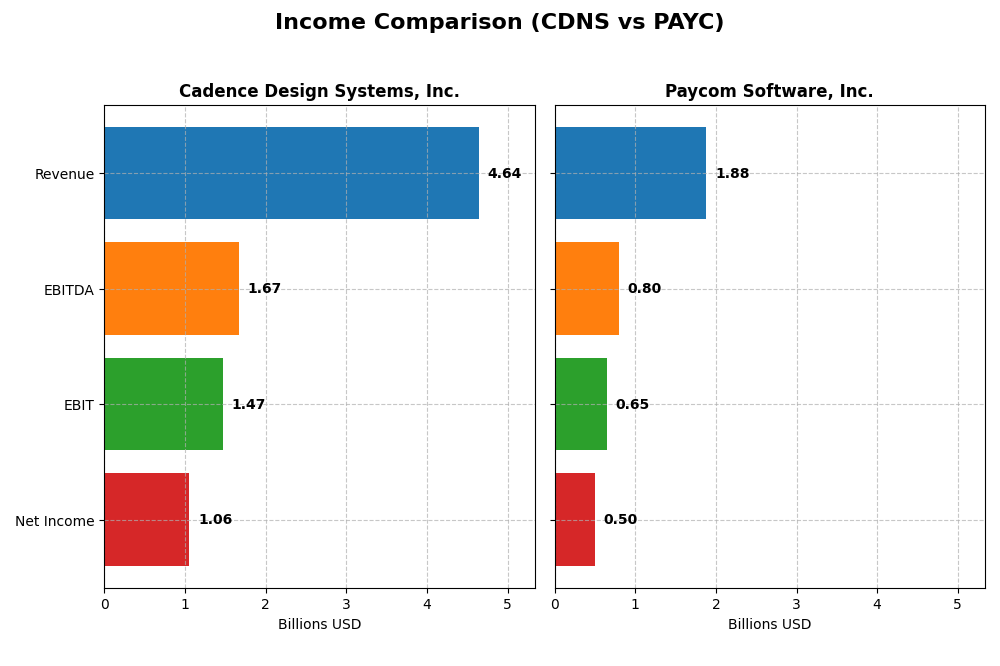
Below is a side-by-side comparison of key income statement metrics for Cadence Design Systems, Inc. and Paycom Software, Inc. for the fiscal year 2024.
| Metric | Cadence Design Systems, Inc. (CDNS) | Paycom Software, Inc. (PAYC) |
|---|---|---|
| Market Cap | 86.4B | 8.3B |
| Revenue | 4.64B | 1.88B |
| EBITDA | 1.67B | 798M |
| EBIT | 1.47B | 652M |
| Net Income | 1.06B | 502M |
| EPS | 3.89 | 8.93 |
| Fiscal Year | 2024 | 2024 |
Income Statement Interpretations
Cadence Design Systems, Inc.
Cadence Design Systems showed strong revenue growth from $2.68B in 2020 to $4.64B in 2024, with net income rising from $591M to $1.06B. Margins remained robust, with a gross margin around 86% and net margin near 23%. The 2024 year saw continued revenue growth at 13.5%, though net margin slightly declined by 10.7%, reflecting stable profitability overall.
Paycom Software, Inc.
Paycom’s revenue nearly doubled from $841M in 2020 to $1.88B in 2024, with net income surging from $143M to $502M. Margins improved consistently, with a 2024 gross margin of 82.2% and a net margin of 26.7%. The latest year showed strong momentum, including an 11.2% revenue increase and a notable 32.5% expansion in net margin, highlighting accelerating profitability.
Which one has the stronger fundamentals?
Both companies display favorable income statement fundamentals with sustained revenue and net income growth. Cadence excels in gross margin stability and scale, while Paycom leads in net margin expansion and higher growth rates over the period. Paycom’s consistent margin improvements and rapid earnings growth contrast with Cadence’s more moderate net margin contraction, suggesting differing strengths in profitability dynamics.
Financial Ratios Comparison
Below is a comparison of key financial ratios for Cadence Design Systems, Inc. (CDNS) and Paycom Software, Inc. (PAYC) based on their most recent fiscal year data ending 2024.
| Ratios | Cadence Design Systems, Inc. (CDNS) | Paycom Software, Inc. (PAYC) |
|---|---|---|
| ROE | 22.58% | 31.85% |
| ROIC | 13.43% | 24.86% |
| P/E | 77.20 | 22.95 |
| P/B | 17.44 | 7.31 |
| Current Ratio | 2.93 | 1.10 |
| Quick Ratio | 2.74 | 1.10 |
| D/E (Debt-to-Equity) | 0.55 | 0.05 |
| Debt-to-Assets | 28.80% | 1.42% |
| Interest Coverage | 17.77 | 186.56 |
| Asset Turnover | 0.52 | 0.32 |
| Fixed Asset Turnover | 7.68 | 2.93 |
| Payout ratio | 0% | 16.89% |
| Dividend yield | 0% | 0.74% |
Interpretation of the Ratios
Cadence Design Systems, Inc.
Cadence shows strong profitability with favorable net margin (22.74%) and return on equity (22.58%), supported by a healthy current ratio of 2.93 indicating good liquidity. However, valuation ratios like PE (77.2) and PB (17.44) are unfavorable, suggesting a high market price relative to earnings and book value. The company does not pay dividends, reflecting a reinvestment strategy likely focused on R&D and growth.
Paycom Software, Inc.
Paycom also reports favorable profitability metrics, with a net margin of 26.66% and a robust return on equity of 31.85%. Its weighted average cost of capital (7.66%) is favorable, but asset turnover is weak (0.32), indicating less efficient asset use. Paycom pays a small dividend with a 0.74% yield, but the payout may be modest given the company’s focus on growth and capital preservation.
Which one has the best ratios?
Both companies have 57.14% favorable ratios, signaling solid financial health. Cadence boasts stronger liquidity and fixed asset turnover, while Paycom excels in return on invested capital and interest coverage. Paycom’s dividend yield is higher but still low, reflecting a cautious approach. Overall, their ratio profiles are favorable but reflect different operational focuses and market valuations.
Strategic Positioning
This section compares the strategic positioning of Cadence Design Systems, Inc. and Paycom Software, Inc. based on market position, key segments, and exposure to technological disruption:
Cadence Design Systems, Inc.
- Leading provider in software and hardware for IC design, facing strong competition in technology sector.
- Serves diverse markets including 5G, aerospace, automotive, industrial, healthcare, and consumer electronics.
- Exposure to disruption through advanced IC design verification and system design tools, adapting to semiconductor evolution.
Paycom Software, Inc.
- Focused on cloud-based HCM SaaS for US small to mid-sized companies, operating in a competitive HR software market.
- Concentrates on human capital management solutions with comprehensive recruitment, payroll, and labor management tools.
- Faces disruption risks in cloud HR tech but leverages proprietary features like Microfence Bluetooth and analytics tools.
Cadence Design Systems, Inc. vs Paycom Software, Inc. Positioning
Cadence has a diversified approach serving multiple tech and industrial sectors, offering hardware and software solutions. Paycom is more concentrated on cloud-based HR management for SMEs in the US, with specialized SaaS applications. Diversification may mitigate sector risks; concentration may enable focused innovation.
Which has the best competitive advantage?
Paycom demonstrates a very favorable moat with growing ROIC and durable profitability, indicating a strong competitive advantage. Cadence shows a slightly favorable moat with declining ROIC, suggesting moderate value creation but less durability.
Stock Comparison
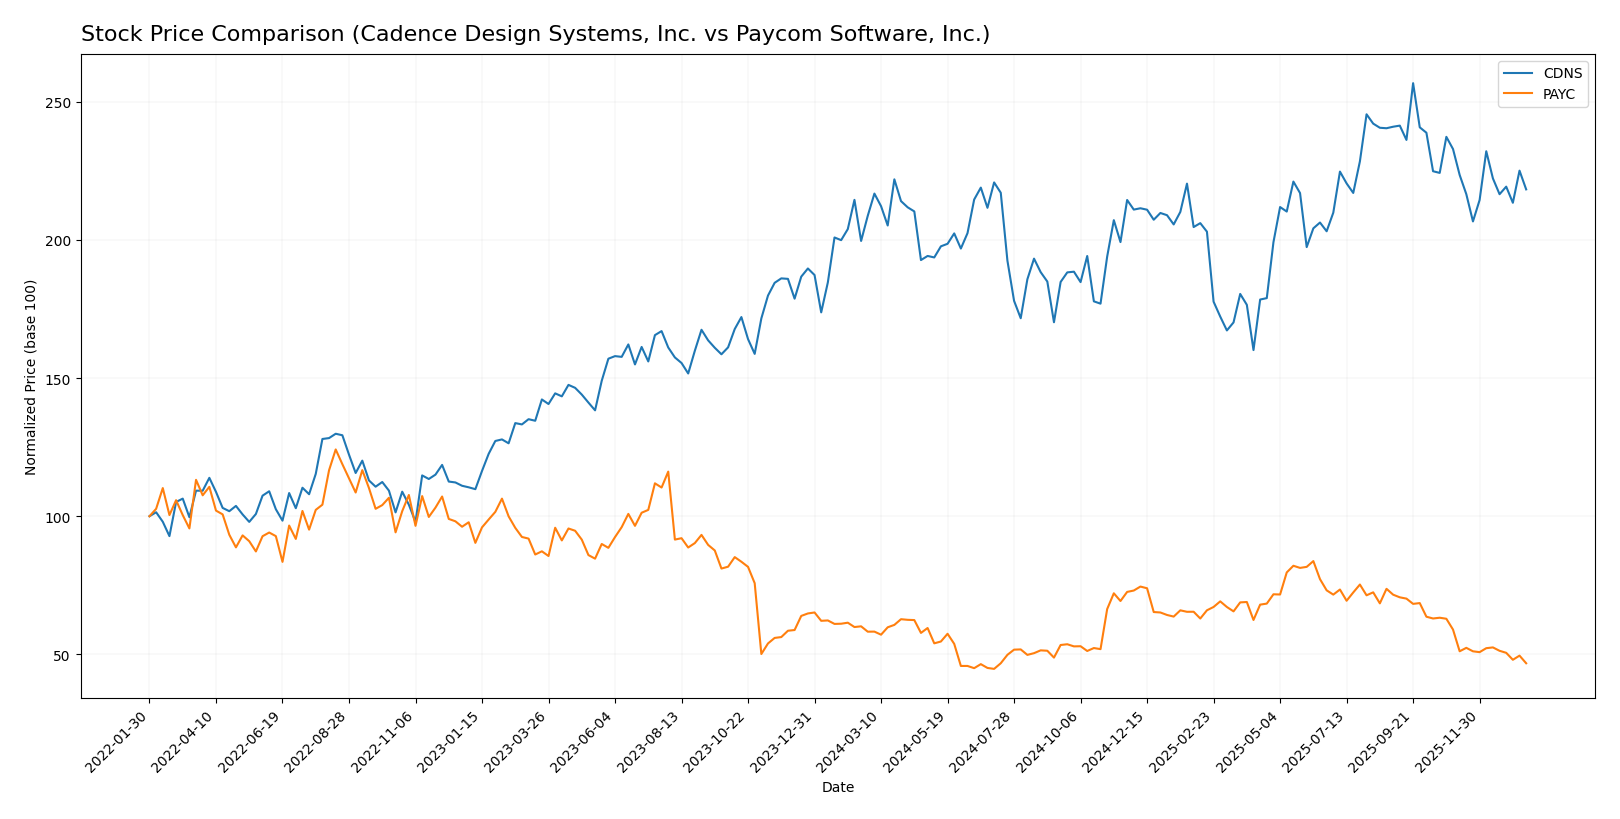
The past year revealed contrasting price dynamics between Cadence Design Systems, Inc. and Paycom Software, Inc., with Cadence showing a moderate bullish trend, while Paycom experienced a pronounced bearish trajectory.
Trend Analysis
Cadence Design Systems, Inc. exhibited a 4.59% price increase over the past 12 months, indicating a bullish trend with decelerating momentum. The stock ranged between 232.88 and 373.35, reflecting considerable volatility (std deviation 29.12).
Paycom Software, Inc. registered a -19.64% price change over the same period, confirming a bearish trend with deceleration. Its price fluctuated between 141.96 and 265.71, showing even higher volatility (std deviation 31.92).
Comparing the two, Cadence delivered the highest market performance with a positive return, whereas Paycom’s stock declined significantly, underperforming Cadence throughout the year.
Target Prices
The current analyst consensus offers a promising outlook for both Cadence Design Systems, Inc. and Paycom Software, Inc.
| Company | Target High | Target Low | Consensus |
|---|---|---|---|
| Cadence Design Systems, Inc. | 418 | 275 | 381 |
| Paycom Software, Inc. | 290 | 165 | 215 |
Analysts expect Cadence’s stock to appreciate above its current price of $317.45, while Paycom’s consensus target of $215 suggests significant upside from its current $148.41.
Analyst Opinions Comparison
This section compares analysts’ ratings and grades for Cadence Design Systems, Inc. and Paycom Software, Inc.:
Rating Comparison
CDNS Rating
- Rating: B, evaluated as Very Favorable by analysts.
- Discounted Cash Flow Score: 3, indicating a moderate valuation based on cash flow projections.
- ROE Score: 4, showing favorable efficiency in generating profit from equity.
- ROA Score: 5, very favorable use of assets to generate earnings.
- Debt To Equity Score: 2, moderate financial risk with some reliance on debt.
- Overall Score: 3, considered moderate in overall financial standing.
PAYC Rating
- Rating: A, evaluated as Very Favorable by analysts.
- Discounted Cash Flow Score: 5, reflecting a very favorable cash flow valuation.
- ROE Score: 5, indicating very favorable profit generation from shareholders’ equity.
- ROA Score: 5, also very favorable asset utilization for earnings.
- Debt To Equity Score: 4, favorable balance sheet with lower financial risk.
- Overall Score: 4, favorable overall financial health and performance.
Which one is the best rated?
Based strictly on the provided data, Paycom Software, Inc. holds a better rating and higher scores across key metrics including discounted cash flow, return on equity, and debt-to-equity, compared to Cadence Design Systems, Inc.
Scores Comparison
Here is a comparison of the Altman Z-Score and Piotroski Score for Cadence Design Systems and Paycom Software:
Cadence Scores
- Altman Z-Score: 14.5, indicating a safe zone with very low bankruptcy risk
- Piotroski Score: 7, reflecting strong financial health and investment potential
Paycom Scores
- Altman Z-Score: 3.8, indicating a safe zone with low bankruptcy risk
- Piotroski Score: 5, reflecting average financial strength and investment potential
Which company has the best scores?
Cadence Design Systems has higher scores overall, with a significantly stronger Altman Z-Score and a more robust Piotroski Score compared to Paycom Software, based strictly on the data provided.
Grades Comparison
This section compares the most recent grades assigned to Cadence Design Systems, Inc. and Paycom Software, Inc.:
Cadence Design Systems, Inc. Grades
Below is a summary of recent grades from notable financial institutions for Cadence Design Systems, Inc.:
| Grading Company | Action | New Grade | Date |
|---|---|---|---|
| Needham | Maintain | Buy | 2025-12-22 |
| Wells Fargo | Maintain | Overweight | 2025-10-28 |
| Baird | Maintain | Outperform | 2025-10-28 |
| Needham | Maintain | Buy | 2025-10-28 |
| JP Morgan | Maintain | Overweight | 2025-10-28 |
| Oppenheimer | Maintain | Underperform | 2025-10-28 |
| Rosenblatt | Maintain | Neutral | 2025-10-28 |
| Rosenblatt | Maintain | Neutral | 2025-10-22 |
| Needham | Maintain | Buy | 2025-07-29 |
| Loop Capital | Maintain | Buy | 2025-07-29 |
Cadence Design Systems shows a strong bias towards positive ratings, with multiple “Buy,” “Outperform,” and “Overweight” grades, alongside a few neutral and one underperform rating.
Paycom Software, Inc. Grades
Below is a summary of recent grades from notable financial institutions for Paycom Software, Inc.:
| Grading Company | Action | New Grade | Date |
|---|---|---|---|
| Barclays | Maintain | Equal Weight | 2026-01-12 |
| TD Cowen | Maintain | Buy | 2026-01-08 |
| Citigroup | Maintain | Neutral | 2025-12-23 |
| Keybanc | Maintain | Overweight | 2025-11-06 |
| TD Cowen | Maintain | Buy | 2025-11-06 |
| UBS | Maintain | Buy | 2025-11-06 |
| Jefferies | Maintain | Hold | 2025-11-06 |
| JP Morgan | Maintain | Neutral | 2025-11-06 |
| Mizuho | Maintain | Neutral | 2025-11-06 |
| Barclays | Maintain | Equal Weight | 2025-11-06 |
Paycom Software’s grades reflect a more mixed consensus, with several “Buy” and “Overweight” ratings counterbalanced by multiple “Neutral,” “Equal Weight,” and a “Hold.”
Which company has the best grades?
Cadence Design Systems has received stronger and more consistent positive grades, primarily “Buy” and “Outperform,” compared to Paycom Software’s more mixed ratings centered on “Buy,” “Hold,” and “Neutral.” This difference may influence investors seeking clearer upward potential signals.
Strengths and Weaknesses
Below is a comparison table highlighting the key strengths and weaknesses of Cadence Design Systems, Inc. (CDNS) and Paycom Software, Inc. (PAYC) based on the most recent data available.
| Criterion | Cadence Design Systems, Inc. (CDNS) | Paycom Software, Inc. (PAYC) |
|---|---|---|
| Diversification | Moderate diversification in product and technology services with $4.2B in product/maintenance and $428M in technology services revenue (2024) | Highly focused on recurring revenue ($1.73B) with smaller implementation segment ($24M) |
| Profitability | Solid profitability: net margin 22.7%, ROIC 13.4%, ROE 22.6% | Strong profitability: net margin 26.7%, ROIC 24.9%, ROE 31.9% |
| Innovation | Consistent product upgrades with a large R&D footprint but declining ROIC trend (-29.7%) signals caution | Demonstrates durable competitive advantage with growing ROIC (+54.4%) and strong innovation culture |
| Global presence | Established multinational presence with broad industry applications | Growing but more US-focused SaaS provider; limited global footprint |
| Market Share | Leader in EDA software with expanding market share in design tools | Significant presence in US HR software market, but smaller global market share |
Key takeaways: Both companies exhibit favorable financial health and profitability, but Paycom stands out with a very favorable and growing economic moat, indicating stronger value creation and innovation momentum. Cadence, while profitable, faces challenges with declining ROIC and a less focused revenue base. Investors should consider Paycom for growth and durability, and Cadence for diversification and established market position, balancing risk accordingly.
Risk Analysis
Below is a comparison of key risks for Cadence Design Systems, Inc. (CDNS) and Paycom Software, Inc. (PAYC) based on the most recent 2024 data:
| Metric | Cadence Design Systems, Inc. (CDNS) | Paycom Software, Inc. (PAYC) |
|---|---|---|
| Market Risk | Beta 1.02, moderate market sensitivity | Beta 0.82, lower volatility |
| Debt level | Debt-to-Equity 0.55, moderate leverage | Debt-to-Equity 0.05, very low debt |
| Regulatory Risk | Moderate, tech industry regulations | Moderate, payroll and data privacy regulations |
| Operational Risk | Complex semiconductor design process | Cloud-based HCM service delivery risks |
| Environmental Risk | Low direct impact, some supply chain exposure | Low, mainly data center energy use |
| Geopolitical Risk | Exposure via global semiconductor supply chains | Mostly US-focused, limited global risk |
The most impactful risks currently are market fluctuations for CDNS due to its beta near 1, and operational risks for PAYC linked to cloud service reliability and data security. CDNS’s moderate debt and exposure to semiconductor supply chains also require caution, while PAYC’s low debt and strong financial stability reduce its financial risk significantly.
Which Stock to Choose?
Cadence Design Systems, Inc. (CDNS) shows favorable income evolution with 13.5% revenue growth in 2024 and strong profitability metrics, including a 22.7% net margin. Its financial ratios are mostly favorable, though valuation ratios like P/E and P/B appear high. Debt levels are moderate with a net debt to EBITDA slightly negative, and its overall rating is very favorable with a “B” grade.
Paycom Software, Inc. (PAYC) exhibits robust income growth with 11.2% revenue increase in 2024 and highly favorable profitability, including a 26.7% net margin. Financial ratios reflect strong operational efficiency and low debt, with a very favorable overall rating of “A”. Its valuation ratios are more moderate, though price-to-book remains unfavorable.
Investors focused on growth and durable competitive advantage might find PAYC’s very favorable rating and rising ROIC trend more appealing, while those valuing stability and consistent profitability may view CDNS’s solid income and balanced ratios as advantageous. The choice could depend on individual risk tolerance and investment strategy.
Disclaimer: Investment carries a risk of loss of initial capital. The past performance is not a reliable indicator of future results. Be sure to understand risks before making an investment decision.
Go Further
I encourage you to read the complete analyses of Cadence Design Systems, Inc. and Paycom Software, Inc. to enhance your investment decisions: