In today’s fast-evolving technology landscape, Cadence Design Systems, Inc. (CDNS) and PagerDuty, Inc. (PD) stand out as influential players in the software application sector. Cadence specializes in advanced electronic design automation, while PagerDuty leads in digital operations management with AI-driven insights. Their overlapping focus on innovation and software solutions makes this comparison essential. Join me as we explore which company offers the most compelling investment opportunity in 2026.
Table of contents
Companies Overview
I will begin the comparison between Cadence Design Systems and PagerDuty by providing an overview of these two companies and their main differences.
Cadence Design Systems Overview
Cadence Design Systems, Inc. specializes in software, hardware, and services for integrated circuit (IC) design and verification. It offers a wide range of platforms and tools for digital IC design, physical implementation, and system analysis, serving industries like 5G communications, aerospace, automotive, and healthcare. Headquartered in San Jose, CA, Cadence is a well-established player with a market cap of 86.4B USD.
PagerDuty Overview
PagerDuty, Inc. operates a digital operations management platform that uses machine learning to process and predict issues from data collected across software-enabled systems. The company serves diverse sectors including technology, telecommunications, retail, and financial services. Founded in 2009 and based in San Francisco, CA, PagerDuty is smaller with a market cap of approximately 1B USD and focuses on incident management.
Key similarities and differences
Both companies operate within the technology sector focusing on software applications but address different market needs. Cadence provides comprehensive design and verification tools for hardware and ICs, targeting high-tech manufacturing sectors. PagerDuty delivers cloud-based operational intelligence and incident response solutions, emphasizing real-time data analytics across multiple industries. Their business models differ primarily in product scope and customer base scale.
Income Statement Comparison
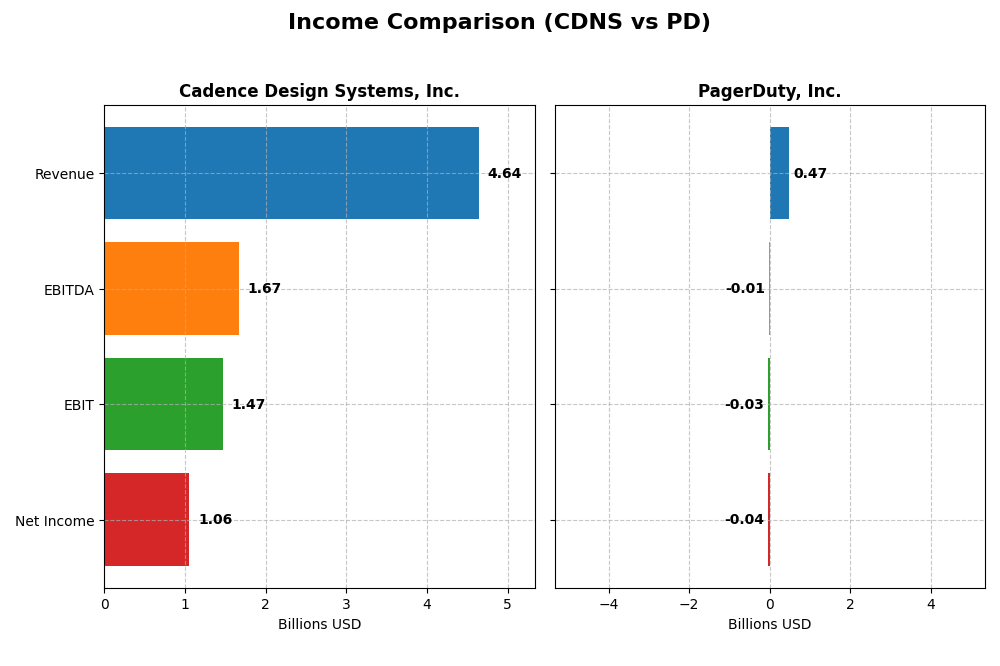
This table compares the most recent fiscal year income statement figures for Cadence Design Systems, Inc. and PagerDuty, Inc., highlighting key financial metrics for investor analysis.
| Metric | Cadence Design Systems, Inc. | PagerDuty, Inc. |
|---|---|---|
| Market Cap | 86.4B | 1.03B |
| Revenue | 4.64B | 467.5M |
| EBITDA | 1.67B | -11.9M |
| EBIT | 1.47B | -32.5M |
| Net Income | 1.06B | -54.5M |
| EPS | 3.89 | -0.59 |
| Fiscal Year | 2024 | 2025 |
Income Statement Interpretations
Cadence Design Systems, Inc.
Cadence Design Systems saw consistent growth in revenue and net income from 2020 to 2024, with revenue rising from $2.68B to $4.64B and net income from $591M to $1.06B. Margins remain strong, with a gross margin of 86.05% and net margin at 22.74% in 2024. The latest year showed favorable revenue growth of 13.48%, though net margin slightly declined.
PagerDuty, Inc.
PagerDuty experienced steady revenue growth from $214M in 2021 to $467M in 2025, alongside improving net losses, narrowing from -$69M to -$43M. Gross margin was favorable at 82.96%, but the net margin remained negative at -9.14% in 2025. The recent year displayed robust improvements in EBIT and net margin growth, indicating operational progress despite losses.
Which one has the stronger fundamentals?
Both companies show favorable income statement evaluations, with PagerDuty demonstrating faster revenue growth (119% vs. Cadence’s 73%) and improving profitability metrics, though still posting net losses. Cadence Design Systems delivers stronger absolute profitability and margin stability, with higher net income and positive net margins. The fundamentals suggest Cadence exhibits more consistent profitability, while PagerDuty shows promising growth but remains unprofitable.
Financial Ratios Comparison
The table below presents the most recent key financial ratios for Cadence Design Systems, Inc. and PagerDuty, Inc., reflecting their fiscal year 2024 and 2025 results respectively.
| Ratios | Cadence Design Systems, Inc. (2024) | PagerDuty, Inc. (2025) |
|---|---|---|
| ROE | 22.6% | -32.9% |
| ROIC | 13.4% | -9.7% |
| P/E | 77.2 | -39.9 |
| P/B | 17.4 | 13.1 |
| Current Ratio | 2.93 | 1.87 |
| Quick Ratio | 2.74 | 1.87 |
| D/E | 0.55 | 3.57 |
| Debt-to-Assets | 28.8% | 50.0% |
| Interest Coverage | 17.8 | -6.5 |
| Asset Turnover | 0.52 | 0.50 |
| Fixed Asset Turnover | 7.68 | 16.61 |
| Payout ratio | 0 | 0 |
| Dividend yield | 0 | 0 |
Interpretation of the Ratios
Cadence Design Systems, Inc.
Cadence Design Systems demonstrates strong profitability and efficiency with favorable net margin (22.74%), ROE (22.58%), and ROIC (13.43%), supported by a solid current ratio (2.93) and interest coverage (19.37). However, high valuation multiples such as PE (77.2) and PB (17.44) raise concerns. The company does not pay dividends, likely reflecting reinvestment in growth.
PagerDuty, Inc.
PagerDuty shows weakness in profitability and returns, with negative net margin (-9.14%), ROE (-32.92%), and ROIC (-9.66%), alongside unfavorable leverage ratios including debt-to-equity (3.57) and interest coverage (-3.51). The current and quick ratios are favorable at 1.87. PagerDuty also does not pay dividends, indicating a focus on reinvestment and growth amid ongoing losses.
Which one has the best ratios?
Cadence Design Systems presents a more favorable overall ratio profile, excelling in profitability, liquidity, and coverage metrics, despite high valuation multiples. PagerDuty’s ratios reflect profitability challenges and higher leverage risks, resulting in an unfavorable overall evaluation. Thus, Cadence’s ratios are comparatively stronger and more stable than PagerDuty’s.
Strategic Positioning
This section compares the strategic positioning of Cadence Design Systems, Inc. and PagerDuty, Inc. in terms of market position, key segments, and exposure to technological disruption:
Cadence Design Systems, Inc.
- Leading in software and hardware for IC design with strong competitive pressure in tech industry.
- Key segments include IC design software, hardware, IP products, and services across multiple industries.
- Exposure includes advanced chip verification and design tools, addressing evolving semiconductor technologies.
PagerDuty, Inc.
- Operates a digital operations platform with moderate competition in software application sector.
- Focuses on digital operations management platform serving diverse sectors like telecom, retail, and finance.
- Uses machine learning for digital signal processing, adapting to software-driven operational changes.
Cadence Design Systems, Inc. vs PagerDuty, Inc. Positioning
Cadence has a diversified portfolio spanning hardware, software, and services primarily in semiconductor design, offering broad industry reach. PagerDuty is concentrated on a digital operations platform focused on software-enabled systems, with a narrower but growing market scope.
Which has the best competitive advantage?
Cadence exhibits a slightly favorable moat by creating value despite declining profitability, reflecting efficient capital use. PagerDuty shows a slightly unfavorable moat, destroying value but improving profitability trends, indicating a less secure competitive advantage currently.
Stock Comparison
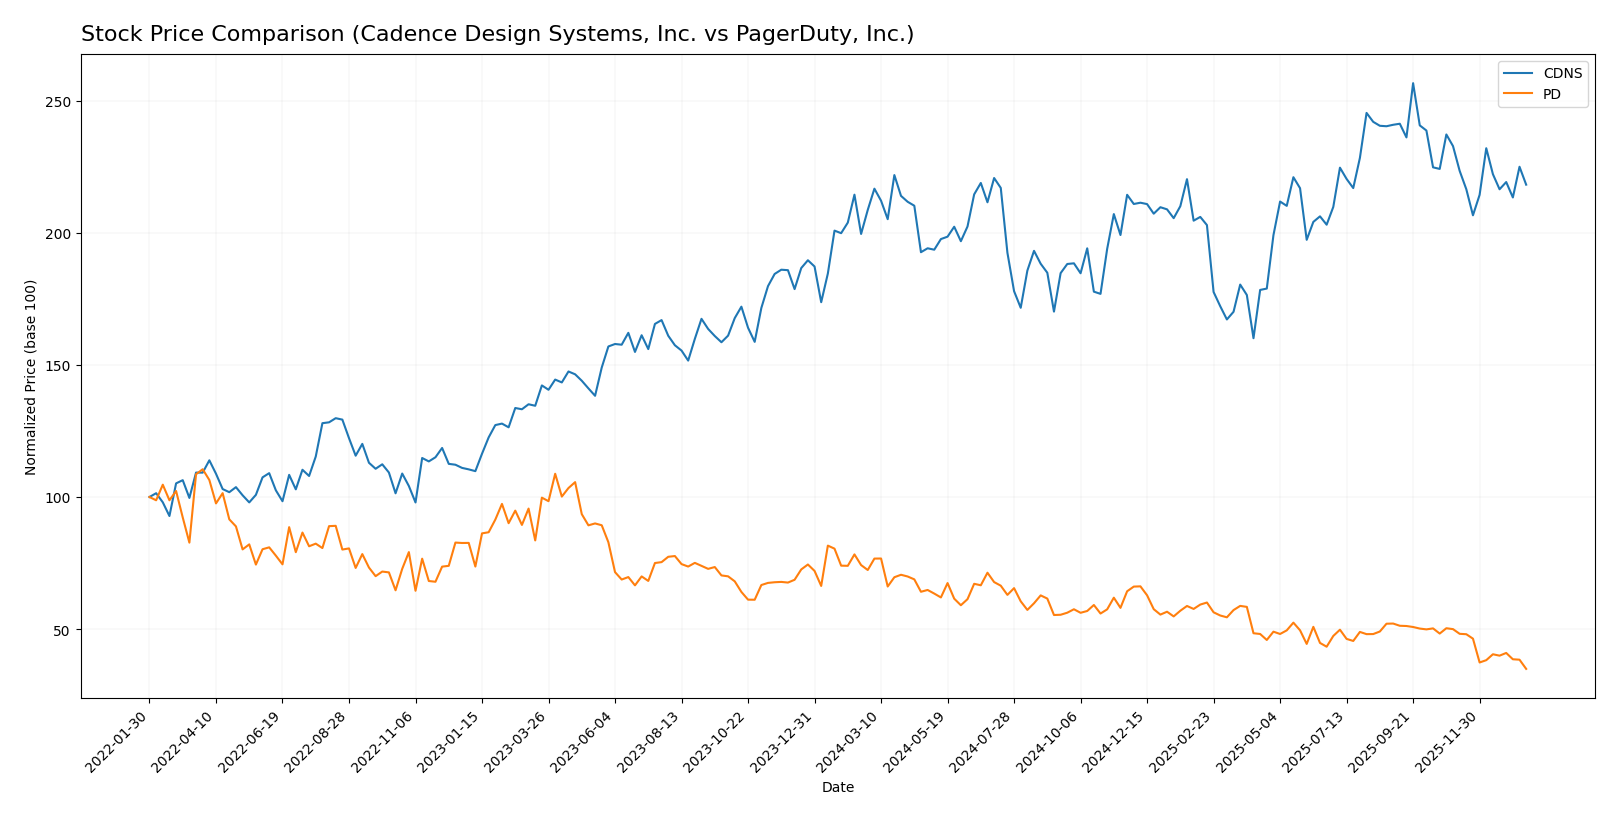
The stock price movements of Cadence Design Systems, Inc. (CDNS) and PagerDuty, Inc. (PD) over the past 12 months reveal contrasting trends, with CDNS showing moderate gains amid decelerating momentum, while PD experiences a pronounced decline accompanied by seller dominance in recent trading.
Trend Analysis
Cadence Design Systems, Inc. (CDNS) displays a bullish trend over the past 12 months with a 4.59% price increase, though the trend is decelerating. The stock fluctuated between a low of 232.88 and a high of 373.35, with volatility measured by a 29.12 std deviation.
PagerDuty, Inc. (PD) exhibits a bearish trend over the same period, with a steep 51.76% price decline and decelerating momentum. Its price ranged from 11.22 to 24.66, reflecting low volatility with a 2.92 std deviation.
Comparing both stocks, CDNS outperformed PD significantly in market performance over the last year, maintaining a positive trend while PD suffered a notable loss.
Target Prices
The consensus target prices reflect moderate upside potential for Cadence Design Systems, Inc. and more limited growth expectations for PagerDuty, Inc.
| Company | Target High | Target Low | Consensus |
|---|---|---|---|
| Cadence Design Systems, Inc. | 418 | 275 | 381 |
| PagerDuty, Inc. | 19 | 15 | 16.2 |
Analysts expect Cadence’s stock to rise from its current price of $317.45 toward a consensus target of $381, indicating solid growth potential. PagerDuty’s consensus target of $16.2 is closer to its current price of $11.22, suggesting more cautious optimism.
Analyst Opinions Comparison
This section compares analysts’ ratings and grades for Cadence Design Systems, Inc. (CDNS) and PagerDuty, Inc. (PD):
Rating Comparison
CDNS Rating
- Rating: B, considered very favorable by analysts.
- Discounted Cash Flow Score: Moderate at 3 out of 5.
- ROE Score: Favorable with a score of 4 out of 5.
- ROA Score: Very favorable with highest score of 5 out of 5.
- Debt To Equity Score: Moderate risk with a score of 2.
- Overall Score: Moderate at 3 out of 5.
PD Rating
- Rating: A-, considered very favorable by analysts.
- Discounted Cash Flow Score: Very favorable at 5 out of 5.
- ROE Score: Very favorable at 5 out of 5.
- ROA Score: Very favorable with highest score of 5 out of 5.
- Debt To Equity Score: Very unfavorable risk at 1 out of 5.
- Overall Score: Favorable at 4 out of 5.
Which one is the best rated?
PagerDuty (PD) is better rated overall with a higher rating of A- and superior scores in discounted cash flow, ROE, and overall assessment. Cadence (CDNS) shows moderate standing but stronger debt-to-equity stability.
Scores Comparison
Here is a comparison of the financial scores for Cadence Design Systems, Inc. and PagerDuty, Inc.:
CDNS Scores
- Altman Z-Score: 14.51, indicating a safe zone.
- Piotroski Score: 7, reflecting strong financial health.
PD Scores
- Altman Z-Score: 1.26, indicating distress zone.
- Piotroski Score: 7, reflecting strong financial health.
Which company has the best scores?
Cadence Design Systems has a significantly higher Altman Z-Score, placing it in the safe zone, while PagerDuty is in the distress zone. Both have the same Piotroski Score of 7, indicating equally strong financial health by that measure.
Grades Comparison
The following tables present the latest reliable grades for Cadence Design Systems, Inc. and PagerDuty, Inc.:
Cadence Design Systems, Inc. Grades
This table summarizes recent grades from well-known grading companies for Cadence Design Systems, Inc.
| Grading Company | Action | New Grade | Date |
|---|---|---|---|
| Needham | Maintain | Buy | 2025-12-22 |
| Wells Fargo | Maintain | Overweight | 2025-10-28 |
| Baird | Maintain | Outperform | 2025-10-28 |
| Needham | Maintain | Buy | 2025-10-28 |
| JP Morgan | Maintain | Overweight | 2025-10-28 |
| Oppenheimer | Maintain | Underperform | 2025-10-28 |
| Rosenblatt | Maintain | Neutral | 2025-10-28 |
| Rosenblatt | Maintain | Neutral | 2025-10-22 |
| Needham | Maintain | Buy | 2025-07-29 |
| Loop Capital | Maintain | Buy | 2025-07-29 |
Cadence Design Systems shows predominantly positive grades, with most firms maintaining Buy or Outperform ratings, indicating a generally favorable analyst view.
PagerDuty, Inc. Grades
This table summarizes recent grades from well-known grading companies for PagerDuty, Inc.
| Grading Company | Action | New Grade | Date |
|---|---|---|---|
| Truist Securities | Maintain | Buy | 2026-01-07 |
| RBC Capital | Downgrade | Sector Perform | 2026-01-05 |
| TD Cowen | Maintain | Buy | 2025-11-26 |
| Craig-Hallum | Downgrade | Hold | 2025-11-26 |
| Morgan Stanley | Maintain | Equal Weight | 2025-11-26 |
| RBC Capital | Maintain | Outperform | 2025-11-26 |
| Truist Securities | Maintain | Buy | 2025-11-19 |
| Baird | Maintain | Neutral | 2025-09-04 |
| RBC Capital | Maintain | Outperform | 2025-09-04 |
| Canaccord Genuity | Maintain | Buy | 2025-09-04 |
PagerDuty’s grades reflect a mixed outlook with multiple downgrades from Buy to Hold or Sector Perform, showing greater caution among analysts.
Which company has the best grades?
Cadence Design Systems has consistently received stronger and more positive grades compared to PagerDuty, which faces recent downgrades and more Hold ratings. This difference may influence investors seeking stocks with stronger analyst support and perceived stability.
Strengths and Weaknesses
Below is a comparative overview of key strengths and weaknesses for Cadence Design Systems, Inc. (CDNS) and PagerDuty, Inc. (PD) based on the latest financial and strategic data.
| Criterion | Cadence Design Systems, Inc. (CDNS) | PagerDuty, Inc. (PD) |
|---|---|---|
| Diversification | Strong focus on product and maintenance with steady revenue growth; limited service diversification | Primarily software incident response platform; less diversification |
| Profitability | High net margin (22.74%), ROIC (13.43%) above WACC, creating value | Negative net margin (-9.14%), ROIC (-9.66%), shedding value |
| Innovation | Consistent investment in technology services; moderate ROIC decline indicates pressure | Improving ROIC trend (+3.3%), signaling growing innovation potential |
| Global presence | Established global footprint in semiconductor design software | Growing but smaller global footprint compared to CDNS |
| Market Share | Strong market position in electronic design automation software | Niche player in incident management with competitive market |
Key takeaways: Cadence Design Systems shows robust profitability and a strong market position with some concerns about declining ROIC. PagerDuty, while currently unprofitable and shedding value, is improving profitability trends and growing its innovation capacity, though with higher risks due to financial weakness. Investors should weigh stability against growth potential carefully.
Risk Analysis
Below is a comparative table presenting key risk metrics for Cadence Design Systems, Inc. (CDNS) and PagerDuty, Inc. (PD) as of the most recent fiscal years.
| Metric | Cadence Design Systems, Inc. (CDNS) | PagerDuty, Inc. (PD) |
|---|---|---|
| Market Risk | Beta 1.02 (moderate volatility) | Beta 0.63 (lower volatility) |
| Debt level | Debt/Equity 0.55 (moderate) | Debt/Equity 3.57 (high) |
| Regulatory Risk | Moderate (technology sector norms) | Moderate (tech & data privacy) |
| Operational Risk | Low (stable operations, 12.8K employees) | Moderate (smaller scale, 1.2K employees) |
| Environmental Risk | Low (software focus, minimal footprint) | Low (software platform) |
| Geopolitical Risk | Moderate (global supply chains) | Moderate (international exposure) |
Synthesizing these risks, PagerDuty faces significant financial risk due to its high leverage (debt/equity 3.57) and negative profitability metrics, increasing bankruptcy risk (Altman Z-score 1.26, distress zone). Cadence Design Systems shows moderate market volatility but strong financial health and low bankruptcy risk (Altman Z-score 14.5, safe zone). Investors should weigh PagerDuty’s operational growth potential against its financial instability, while Cadence offers a more stable, lower-risk profile.
Which Stock to Choose?
Cadence Design Systems, Inc. (CDNS) shows a favorable income evolution with 13.48% revenue growth in 2024 and strong profitability metrics, including a 22.74% net margin and 22.58% ROE. Its debt levels are moderate with a favorable debt-to-assets ratio of 28.8%, and its overall rating is very favorable with a “B” grade, despite some high valuation multiples.
PagerDuty, Inc. (PD) exhibits positive income growth trends with 8.54% revenue increase and improving net margin growth of 51.84% in 2025, yet it remains unprofitable with a -9.14% net margin and negative returns on equity and capital. The company has higher leverage and an unfavorable debt profile, but its rating stands at very favorable “A-” due to strong returns on equity and assets scores.
Investors prioritizing stable profitability and value creation might find CDNS more favorable given its consistent income quality and creation of value despite a declining ROIC trend. Conversely, those with a growth or turnaround profile could interpret PD’s improving profitability and rising ROIC as potential for future gains, though accompanied by higher financial risk and a bearish price trend.
Disclaimer: Investment carries a risk of loss of initial capital. The past performance is not a reliable indicator of future results. Be sure to understand risks before making an investment decision.
Go Further
I encourage you to read the complete analyses of Cadence Design Systems, Inc. and PagerDuty, Inc. to enhance your investment decisions: