In the dynamic world of software applications, Cadence Design Systems, Inc. and monday.com Ltd. stand out as innovators shaping different facets of the industry. Cadence excels in electronic design automation for integrated circuits, while monday.com revolutionizes work management with its cloud-based platform. Both companies compete in technology but address distinct market needs and innovation strategies. This article will help you decide which stock is the more compelling addition to your investment portfolio.
Table of contents
Companies Overview
I will begin the comparison between Cadence Design Systems, Inc. and monday.com Ltd. by providing an overview of these two companies and their main differences.
Cadence Design Systems, Inc. Overview
Cadence Design Systems, Inc. is a leading provider in the software and hardware design sector, focusing on integrated circuit (IC) design and verification. The company offers a broad portfolio including emulation, prototyping, and digital IC design tools, serving markets such as 5G, aerospace, automotive, and healthcare. Headquartered in San Jose, California, Cadence employs over 12K people and has a market cap of approximately 86B USD.
monday.com Ltd. Overview
monday.com Ltd. develops cloud-based work operating systems designed to improve work management and collaboration. Its modular platform supports applications in marketing, CRM, project management, and software development, catering to organizations globally. Founded in 2012 and based in Tel Aviv, Israel, monday.com has about 2.5K employees and a market cap near 6.5B USD.
Key similarities and differences
Both companies operate in the software application industry and are listed on the NASDAQ Global Select market. Cadence focuses on specialized IC design and verification software with extensive hardware integration, targeting high-tech industries. In contrast, monday.com provides versatile cloud-based work management solutions for diverse sectors. The scale of operations differs significantly, with Cadence having a substantially larger workforce and market capitalization than monday.com.
Income Statement Comparison
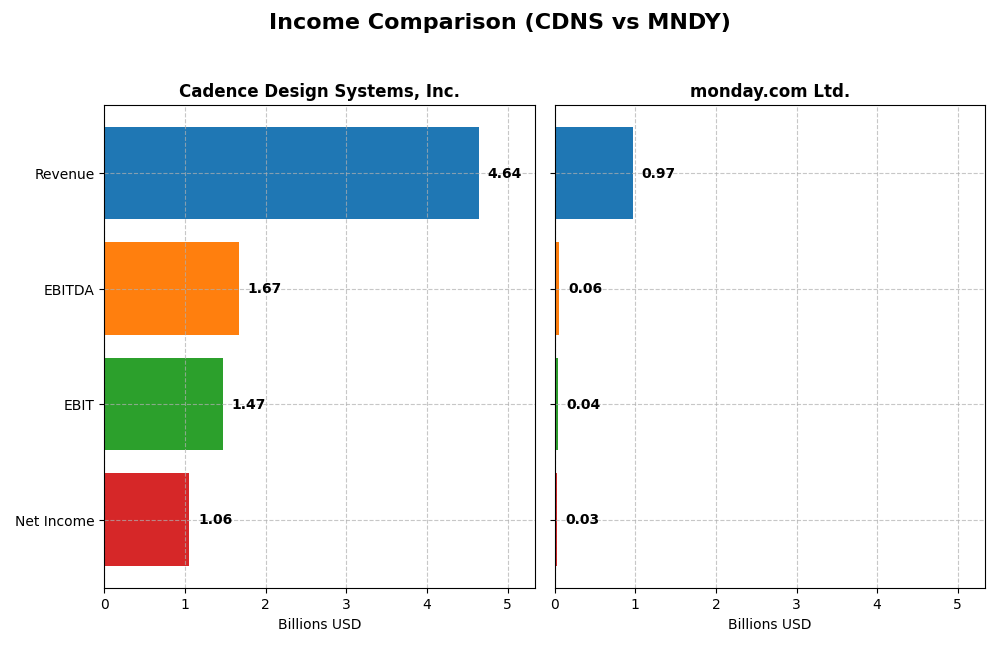
The table below compares key income statement metrics for Cadence Design Systems, Inc. and monday.com Ltd. for the fiscal year 2024, highlighting their financial performance.
| Metric | Cadence Design Systems, Inc. | monday.com Ltd. |
|---|---|---|
| Market Cap | 86.4B | 6.53B |
| Revenue | 4.64B | 972M |
| EBITDA | 1.67B | 58M |
| EBIT | 1.47B | 40M |
| Net Income | 1.06B | 32M |
| EPS | 3.89 | 0.65 |
| Fiscal Year | 2024 | 2024 |
Income Statement Interpretations
Cadence Design Systems, Inc.
Cadence Design Systems, Inc. exhibited consistent revenue growth from 2020 to 2024, rising from $2.68B to $4.64B, with net income increasing from $591M to $1.06B. Gross and EBIT margins remained strong and favorable, around 86% and 32% respectively, though net margin slightly declined in 2024. The latest year showed solid revenue growth of 13.5%, with stable operating expenses and a slight EPS increase.
monday.com Ltd.
monday.com Ltd. demonstrated rapid revenue growth, from $161M in 2020 to $972M in 2024, accompanied by a turnaround from net losses to a $32M net income profit. Gross margin improved to 89.3%, while EBIT and net margins remain modest at 4.1% and 3.3%. The latest year showed a strong 33.2% revenue increase and marked profitability gains, reflecting accelerating operational efficiency and margin expansion.
Which one has the stronger fundamentals?
Both companies present favorable income statement trends with strong revenue growth and improving profitability. Cadence maintains higher absolute profitability and stable margins, while monday.com shows rapid expansion and margin improvement from a smaller base. Cadence’s mature financials contrast with monday.com’s high growth trajectory, making their fundamentals distinct but both favorable in their respective contexts.
Financial Ratios Comparison
The table below presents key financial ratios for Cadence Design Systems, Inc. (CDNS) and monday.com Ltd. (MNDY) based on their latest fiscal year data, illustrating their financial performance and position.
| Ratios | Cadence Design Systems, Inc. (CDNS) | monday.com Ltd. (MNDY) |
|---|---|---|
| ROE | 22.6% | 3.1% |
| ROIC | 13.4% | -1.7% |
| P/E | 77.2 | 363.0 |
| P/B | 17.4 | 11.4 |
| Current Ratio | 2.93 | 2.66 |
| Quick Ratio | 2.74 | 2.66 |
| D/E (Debt-to-Equity) | 0.55 | 0.10 |
| Debt-to-Assets | 28.8% | 6.3% |
| Interest Coverage | 17.8 | 0 (not positive) |
| Asset Turnover | 0.52 | 0.58 |
| Fixed Asset Turnover | 7.68 | 7.13 |
| Payout Ratio | 0 | 0 |
| Dividend Yield | 0 | 0 |
Interpretation of the Ratios
Cadence Design Systems, Inc.
Cadence Design Systems exhibits mostly strong financial ratios, with favorable net margin (22.74%), ROE (22.58%), and ROIC (13.43%). Liquidity ratios such as current (2.93) and quick ratios (2.74) are solid, while valuation multiples like PE (77.2) and PB (17.44) appear stretched. The company does not pay dividends, likely focusing on growth and reinvestment.
monday.com Ltd.
monday.com shows mixed financial health with unfavorable net margin (3.33%), ROE (3.14%), and negative ROIC (-1.73%). Liquidity and leverage ratios remain favorable, including current ratio (2.66) and low debt-to-assets (6.29%). Despite no dividend payments, this likely reflects a high growth phase or reinvestment in operations rather than shareholder returns.
Which one has the best ratios?
Cadence Design Systems holds the advantage with a majority of favorable financial ratios and stronger profitability metrics, despite some valuation concerns. monday.com displays a more balanced profile with neutral overall opinion but weaker profitability and return ratios, reflecting its growth or reinvestment focus.
Strategic Positioning
This section compares the strategic positioning of Cadence Design Systems, Inc. and monday.com Ltd., including Market position, Key segments, and disruption:
Cadence Design Systems, Inc.
- Leading semiconductor software provider with significant market cap and moderate competition in software application industry.
- Focus on integrated circuit design software, hardware, and services targeting 5G, aerospace, automotive, industrial, and computing sectors.
- Exposed to semiconductor design tools disruption; innovation in emulation, prototyping, and verification platforms is key.
monday.com Ltd.
- Smaller market cap, growing presence in cloud-based work management software with higher beta and competitive pressure.
- Offers Work OS platform for modular software applications across marketing, CRM, and project management sectors.
- Faces cloud software disruption risks but benefits from modular, scalable SaaS approach in diverse organizational use cases.
Cadence Design Systems, Inc. vs monday.com Ltd. Positioning
Cadence has a diversified portfolio spanning hardware and software for multiple industries, offering stable revenue streams. monday.com’s concentrated focus on cloud-based work management solutions targets specific software application needs, with potential for scaling in varied sectors.
Which has the best competitive advantage?
Cadence Design Systems, Inc. shows a slightly favorable moat with value creation despite declining ROIC, indicating a more sustainable competitive advantage. monday.com Ltd. currently sheds value but improves profitability, reflecting a less stable competitive position.
Stock Comparison
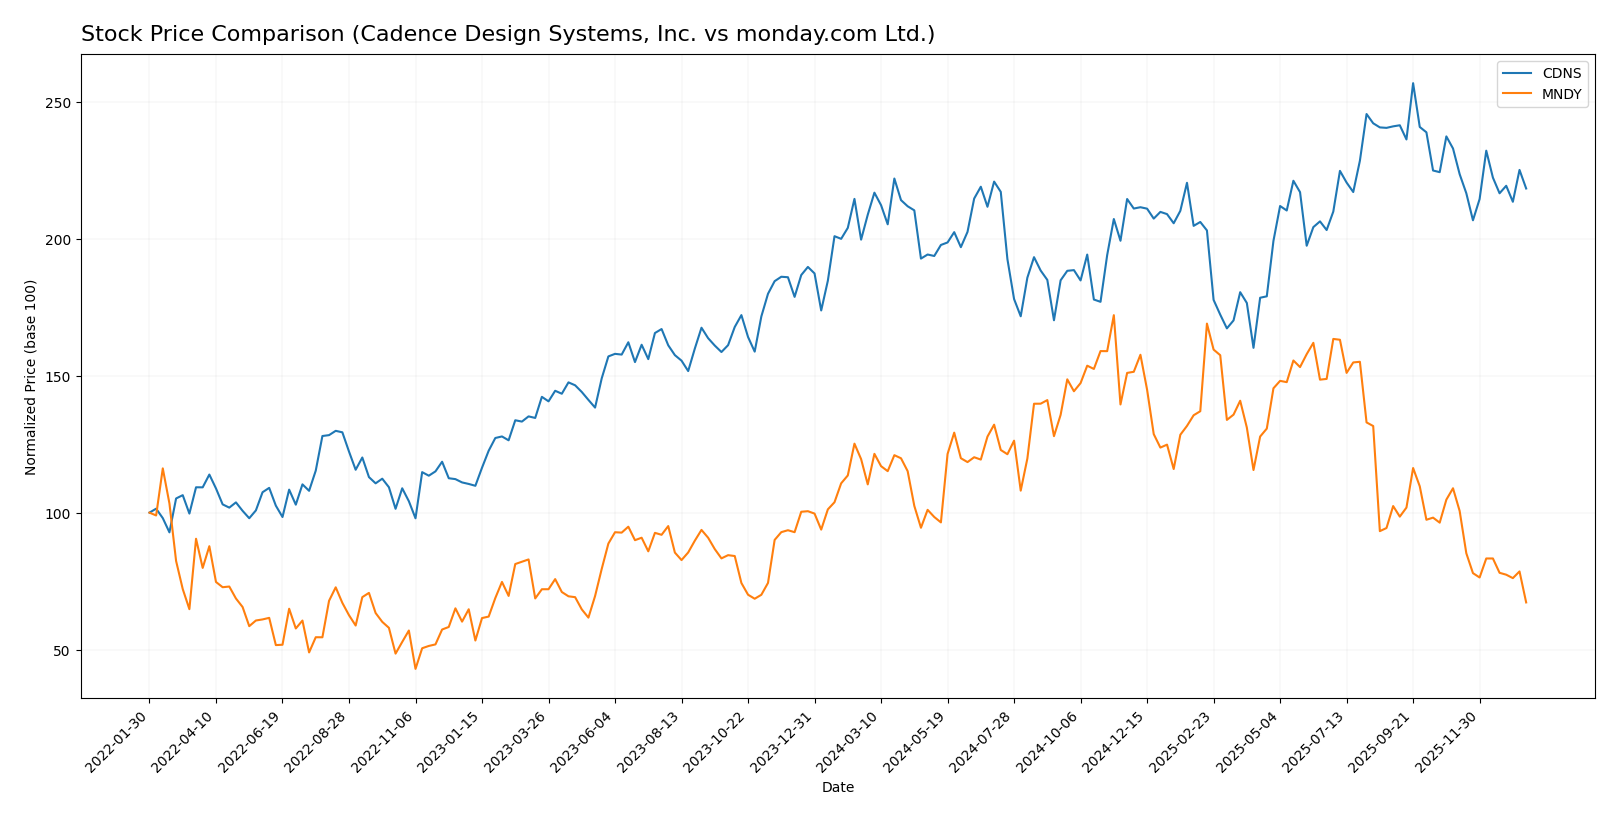
The stock prices of Cadence Design Systems, Inc. and monday.com Ltd. have shown contrasting dynamics over the past year, with Cadence exhibiting moderate gains amid decelerating momentum, while monday.com faced a significant decline with persistent downward pressure.
Trend Analysis
Cadence Design Systems, Inc. experienced a bullish trend over the past 12 months with a 4.59% price increase, despite deceleration in momentum. The stock ranged between 232.88 and 373.35, showing moderate volatility with a standard deviation of 29.12.
monday.com Ltd. displayed a bearish trend over the same period, with a 39.06% price decline and decelerating trend acceleration. The stock fluctuated between 126.7 and 324.31, with higher volatility reflected by a 47.32 standard deviation.
Comparing both stocks, Cadence Design Systems delivered the highest market performance with positive price appreciation, while monday.com experienced a substantial loss in value over the past year.
Target Prices
The current analyst consensus presents a varied but optimistic outlook for these technology software companies.
| Company | Target High | Target Low | Consensus |
|---|---|---|---|
| Cadence Design Systems, Inc. | 418 | 275 | 381 |
| monday.com Ltd. | 330 | 194 | 264.42 |
Analysts expect Cadence Design Systems’ stock to trade above its current price of $317.45, reflecting confidence in growth. For monday.com, the consensus target price is significantly higher than the current $126.7, indicating strong upside potential.
Analyst Opinions Comparison
This section compares analysts’ ratings and grades for Cadence Design Systems, Inc. and monday.com Ltd.:
Rating Comparison
CDNS Rating
- Rating: B, classified as Very Favorable by analysts.
- Discounted Cash Flow Score: Moderate, rated 3 out of 5.
- ROE Score: Favorable, rated 4 out of 5.
- ROA Score: Very Favorable, rated 5 out of 5.
- Debt To Equity Score: Moderate, rated 2 out of 5.
- Overall Score: Moderate, rated 3 out of 5.
MNDY Rating
- Rating: B-, also considered Very Favorable by analysts.
- Discounted Cash Flow Score: Favorable, rated 4 out of 5.
- ROE Score: Moderate, rated 3 out of 5.
- ROA Score: Moderate, rated 3 out of 5.
- Debt To Equity Score: Moderate, rated 3 out of 5.
- Overall Score: Moderate, rated 3 out of 5.
Which one is the best rated?
Based strictly on the available data, CDNS holds higher scores in return on equity and assets, indicating stronger profitability and asset use, while MNDY scores better on discounted cash flow and debt to equity. Overall ratings are similar.
Scores Comparison
The comparison of scores between Cadence Design Systems, Inc. and monday.com Ltd. is as follows:
CDNS Scores
- Altman Z-Score: 14.51, indicating a safe zone status
- Piotroski Score: 7, classified as strong
MNDY Scores
- Altman Z-Score: 6.33, indicating a safe zone status
- Piotroski Score: 5, classified as average
Which company has the best scores?
Based strictly on the provided data, CDNS has a higher Altman Z-Score and a stronger Piotroski Score compared to MNDY, indicating better financial stability and strength.
Grades Comparison
The following presents a comparison of recent reliable grades for Cadence Design Systems, Inc. and monday.com Ltd.:
Cadence Design Systems, Inc. Grades
This table summarizes the latest grades from established grading companies for Cadence Design Systems, Inc.
| Grading Company | Action | New Grade | Date |
|---|---|---|---|
| Needham | Maintain | Buy | 2025-12-22 |
| Wells Fargo | Maintain | Overweight | 2025-10-28 |
| Baird | Maintain | Outperform | 2025-10-28 |
| Needham | Maintain | Buy | 2025-10-28 |
| JP Morgan | Maintain | Overweight | 2025-10-28 |
| Oppenheimer | Maintain | Underperform | 2025-10-28 |
| Rosenblatt | Maintain | Neutral | 2025-10-28 |
| Rosenblatt | Maintain | Neutral | 2025-10-22 |
| Needham | Maintain | Buy | 2025-07-29 |
| Loop Capital | Maintain | Buy | 2025-07-29 |
The grades for Cadence Design Systems show a predominantly positive outlook, with multiple buy and overweight ratings, though a single underperform and neutral ratings indicate some caution.
monday.com Ltd. Grades
This table summarizes the latest grades from established grading companies for monday.com Ltd.
| Grading Company | Action | New Grade | Date |
|---|---|---|---|
| BTIG | Maintain | Buy | 2026-01-15 |
| Barclays | Maintain | Overweight | 2026-01-12 |
| Jefferies | Maintain | Buy | 2026-01-05 |
| Citigroup | Maintain | Buy | 2025-12-23 |
| Tigress Financial | Maintain | Buy | 2025-12-11 |
| Baird | Maintain | Outperform | 2025-11-11 |
| Wells Fargo | Maintain | Overweight | 2025-11-11 |
| DA Davidson | Maintain | Buy | 2025-11-11 |
| Morgan Stanley | Maintain | Overweight | 2025-11-11 |
| Piper Sandler | Maintain | Overweight | 2025-11-11 |
monday.com Ltd. has consistently received positive grades with a strong bias towards buy and overweight recommendations and no sell or underperform ratings.
Which company has the best grades?
Both companies have received predominantly positive grades, but monday.com Ltd. exhibits a more uniformly favorable pattern without any sell or underperform grades, potentially signaling stronger analyst confidence. This may influence investor sentiment by emphasizing monday.com’s perceived stability and growth prospects.
Strengths and Weaknesses
Below is a comparative overview of key strengths and weaknesses for Cadence Design Systems, Inc. (CDNS) and monday.com Ltd. (MNDY) based on the most recent financial and operational data.
| Criterion | Cadence Design Systems, Inc. (CDNS) | monday.com Ltd. (MNDY) |
|---|---|---|
| Diversification | Strong product and maintenance revenue base (4.21B USD in 2024); technology services growing | Limited diversification; relies heavily on core platform |
| Profitability | High net margin (22.74%) and ROE (22.58%), positive ROIC (13.43%) | Low profitability: net margin 3.33%, ROE 3.14%, negative ROIC (-1.73%) |
| Innovation | Robust innovation with favorable fixed asset turnover (7.68) | Improving innovation indicated by growing ROIC trend, but overall value destruction |
| Global presence | Established global footprint with steady revenue growth | Growing presence but smaller scale and less diversified markets |
| Market Share | Leading in electronic design automation with strong market share | Niche market player with expanding but smaller market share |
Key takeaways: Cadence demonstrates strong profitability, diversification, and a stable market position despite a slight decline in ROIC trend. monday.com is experiencing growing profitability trends but currently struggles with low margins and value destruction, signaling higher risk for investors.
Risk Analysis
Below is a risk comparison table for Cadence Design Systems, Inc. (CDNS) and monday.com Ltd. (MNDY) based on the latest 2024 data and market context:
| Metric | Cadence Design Systems, Inc. (CDNS) | monday.com Ltd. (MNDY) |
|---|---|---|
| Market Risk | Moderate (Beta 1.02, stable tech demand) | High (Beta 1.26, volatile SaaS sector) |
| Debt level | Moderate (D/E 0.55, manageable) | Low (D/E 0.10, low leverage) |
| Regulatory Risk | Moderate (US tech regulations) | Moderate to High (International, Israel-based) |
| Operational Risk | Low (Strong product diversification) | Moderate (Growth-stage with scaling challenges) |
| Environmental Risk | Low (Primarily software business) | Low (Cloud-based software) |
| Geopolitical Risk | Moderate (US-China tech tensions) | High (Exposed to Middle East and Europe) |
The most significant risks are market volatility for monday.com due to its high beta and regulatory/geopolitical exposure given its international footprint. Cadence’s valuation metrics indicate premium pricing, which could amplify market risk despite solid operational and financial health. Investors should weigh these factors carefully within a diversified portfolio.
Which Stock to Choose?
Cadence Design Systems, Inc. (CDNS) shows a favorable income evolution with a 13.48% revenue growth in 2024 and strong profitability metrics, including a 22.74% net margin and 22.58% ROE. Its debt profile is moderate with a 28.8% debt-to-assets ratio, and it holds a very favorable B rating, supported by a safe Altman Z-Score and strong Piotroski score.
monday.com Ltd. (MNDY) experiences robust revenue growth of 33.21% in 2024 but posts lower profitability with a 3.33% net margin and 3.14% ROE. The company maintains low debt levels (6.29% debt-to-assets) and a very favorable B- rating, though its Altman Z-Score is lower than CDNS and Piotroski score is average, reflecting moderate financial stability.
Investors focused on stable profitability and value creation may find CDNS’s strong financial ratios and favorable rating more aligned with their profile, while those prioritizing growth and rapid revenue expansion might see potential in MNDY, despite its lower profitability and neutral overall financial ratios.
Disclaimer: Investment carries a risk of loss of initial capital. The past performance is not a reliable indicator of future results. Be sure to understand risks before making an investment decision.
Go Further
I encourage you to read the complete analyses of Cadence Design Systems, Inc. and monday.com Ltd. to enhance your investment decisions: