Home > Comparison > Technology > CDNS vs MTCH
The strategic rivalry between Cadence Design Systems, Inc. and Match Group, Inc. shapes the evolving landscape of technology software applications. Cadence operates as a capital-intensive leader in electronic design automation, serving complex semiconductor markets. Match Group focuses on high-margin consumer software in online dating, leveraging brand diversification. This analysis pits industrial innovation against platform scalability to reveal which path offers superior risk-adjusted returns for a diversified portfolio in 2026.
Table of contents
Companies Overview
Cadence Design Systems and Match Group lead distinct segments within the technology software application market.
Cadence Design Systems, Inc.: Semiconductor Design Powerhouse
Cadence Design Systems dominates the semiconductor software space, generating revenue primarily through advanced IC design tools and verification platforms. Its 2026 strategy focuses on enhancing hardware emulation and formal verification to support 5G, aerospace, and automotive markets. Cadence’s integrated design solutions uniquely combine software, hardware, and IP blocks, driving innovation in chip manufacturing readiness.
Match Group, Inc.: Global Online Dating Leader
Match Group commands the online dating market with a diverse portfolio including Tinder and Hinge. It earns revenue through subscription services and premium features on its platforms. In 2026, the company emphasizes expanding user engagement and monetization across global brands. Match Group’s network effect and brand diversification sustain its competitive moat in a highly fragmented consumer software landscape.
Strategic Collision: Similarities & Divergences
Both companies operate in the software applications sector but pursue vastly different business models: Cadence targets B2B semiconductor design, while Match focuses on B2C social networking. Their primary battleground is market leadership—Cadence in high-tech chip design tools, Match in digital dating services. This divergence creates distinct investment profiles: Cadence offers exposure to technology infrastructure, Match to consumer internet trends.
Income Statement Comparison
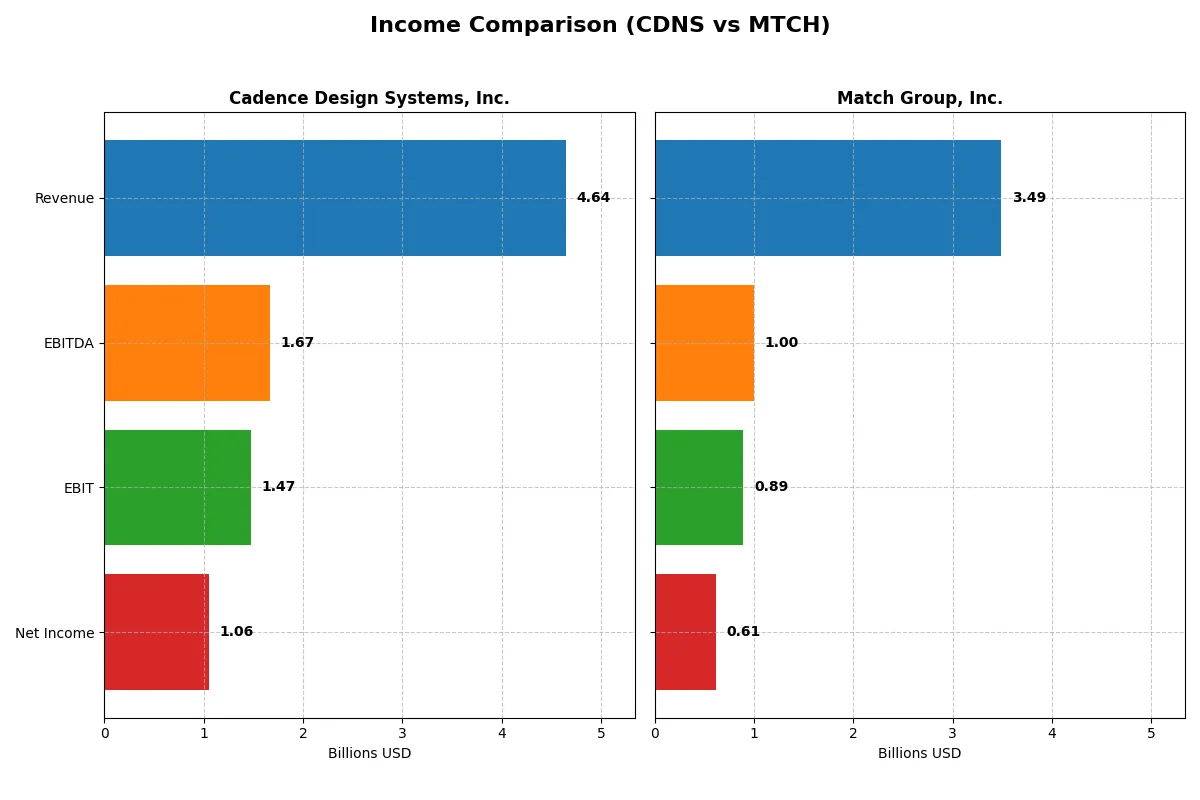
The following data dissects the core profitability and scalability of both corporate engines to reveal who dominates the bottom line:
| Metric | Cadence Design Systems, Inc. (CDNS) | Match Group, Inc. (MTCH) |
|---|---|---|
| Revenue | 4.64B | 3.49B |
| Cost of Revenue | 648M | 991M |
| Operating Expenses | 2.64B | 1.66B |
| Gross Profit | 3.99B | 2.49B |
| EBITDA | 1.67B | 952M |
| EBIT | 1.47B | 864M |
| Interest Expense | 76M | 160M |
| Net Income | 1.06B | 563M |
| EPS | 3.89 | 2.12 |
| Fiscal Year | 2024 | 2024 |
Income Statement Analysis: The Bottom-Line Duel
This income statement comparison reveals which company converts revenue into profit more efficiently and sustains margin strength over time.
Cadence Design Systems, Inc. Analysis
Cadence Design Systems grew revenue from $2.68B in 2020 to $4.64B in 2024, boosting net income from $591M to $1.06B. Its gross margin remains robust at 86%, reflecting strong cost control. The net margin sits at 22.7%, slightly dipping recently but still healthy. Rising R&D and operating expenses align with its growth momentum and innovation focus.
Match Group, Inc. Analysis
Match Group expanded revenue from $2.98B in 2021 to $3.49B in 2025, with net income climbing from $277M to $613M. It sustains a solid gross margin near 73%, though below Cadence’s level. The net margin improved to 17.6%, supported by controlled operating expenses and increased EPS growth. However, revenue growth slowed to near flat in the latest year, signaling momentum challenges.
Margin Dominance vs. Growth Consistency
Cadence outperforms with higher margins and stronger revenue growth, reflecting superior operational efficiency. Match Group shows impressive net margin and EPS expansion but at a smaller scale and with slowing top-line momentum. Investors seeking margin stability might favor Cadence, while those valuing EPS acceleration could consider Match’s profile.
Financial Ratios Comparison
These vital ratios act as a diagnostic tool to expose the underlying fiscal health, valuation premiums, and capital efficiency of each company:
| Ratios | Cadence Design Systems, Inc. (CDNS) | Match Group, Inc. (MTCH) |
|---|---|---|
| ROE | 22.58% | -2.42% |
| ROIC | 13.43% | 22.50% |
| P/E | 77.20 | 12.77 |
| P/B | 17.44 | -30.91 |
| Current Ratio | 2.93 | 1.42 |
| Quick Ratio | 2.74 | 1.42 |
| D/E | 0.55 | -15.67 |
| Debt-to-Assets | 28.80% | 89.06% |
| Interest Coverage | 17.77 | 5.91 |
| Asset Turnover | 0.52 | 0.78 |
| Fixed Asset Turnover | 7.68 | 26.59 |
| Payout ratio | 0 | 30.36% |
| Dividend yield | 0 | 2.38% |
| Fiscal Year | 2024 | 2025 |
Efficiency & Valuation Duel: The Vital Signs
Financial ratios serve as the company’s DNA, uncovering hidden risks and operational excellence that define its true performance and value.
Cadence Design Systems, Inc.
Cadence posts a strong 22.6% ROE and a solid net margin of 22.7%, signaling robust profitability. However, its valuation appears stretched with a P/E of 77.2 and a P/B of 17.4, reflecting high market expectations. It offers no dividends, instead reinvesting heavily in R&D, which supports sustained growth.
Match Group, Inc.
Match Group delivers a favorable net margin of 17.6% and an impressive 22.5% ROIC, but suffers from a deeply negative ROE, indicating shareholder equity struggles. Its valuation is attractive, with a P/E of 12.8 and a positive dividend yield of 2.38%. The firm balances growth investment with shareholder returns.
Premium Valuation vs. Operational Safety
Cadence trades at a premium due to strong profitability and reinvestment, while Match offers a more balanced valuation with dividend income despite ROE weakness. Investors seeking growth may lean toward Cadence; those favoring income and value might prefer Match.
Which one offers the Superior Shareholder Reward?
I observe that Cadence Design Systems (CDNS) pays no dividends but generates strong free cash flow (4.1/share in 2024), reinvesting heavily in R&D and growth. Match Group (MTCH) offers a 2.38% dividend yield with a 30% payout ratio, supported by solid free cash flow (4.2/share in 2025). CDNS lacks buybacks, focusing on growth, while MTCH shows moderate dividend and buyback activity, enhancing total return. Given CDNS’s sustainable reinvestment and superior margins, it likely delivers stronger long-term value despite no dividends. However, MTCH provides immediate income plus buyback support. For 2026, I favor CDNS for superior total shareholder reward, prioritizing growth sustainability over current yield.
Comparative Score Analysis: The Strategic Profile
The radar chart reveals the fundamental DNA and trade-offs of Cadence Design Systems and Match Group, highlighting their financial strengths and valuation challenges:
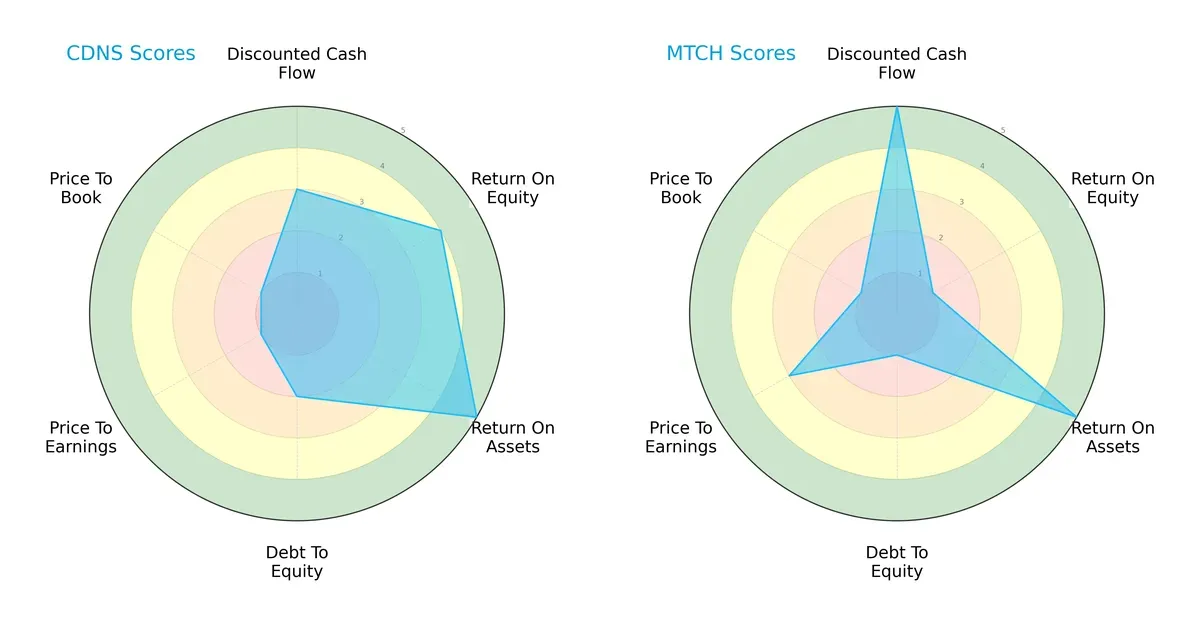
Cadence Design Systems leans on operational efficiency, with strong ROE (4) and ROA (5) scores but struggles with debt (2) and valuation metrics (PE and PB at 1). Match Group excels in discounted cash flow (5) and asset returns (5) but shows a weak ROE (1) and higher financial risk (debt-to-equity score 1). Cadence offers a more balanced profile, while Match relies heavily on its cash flow advantage.
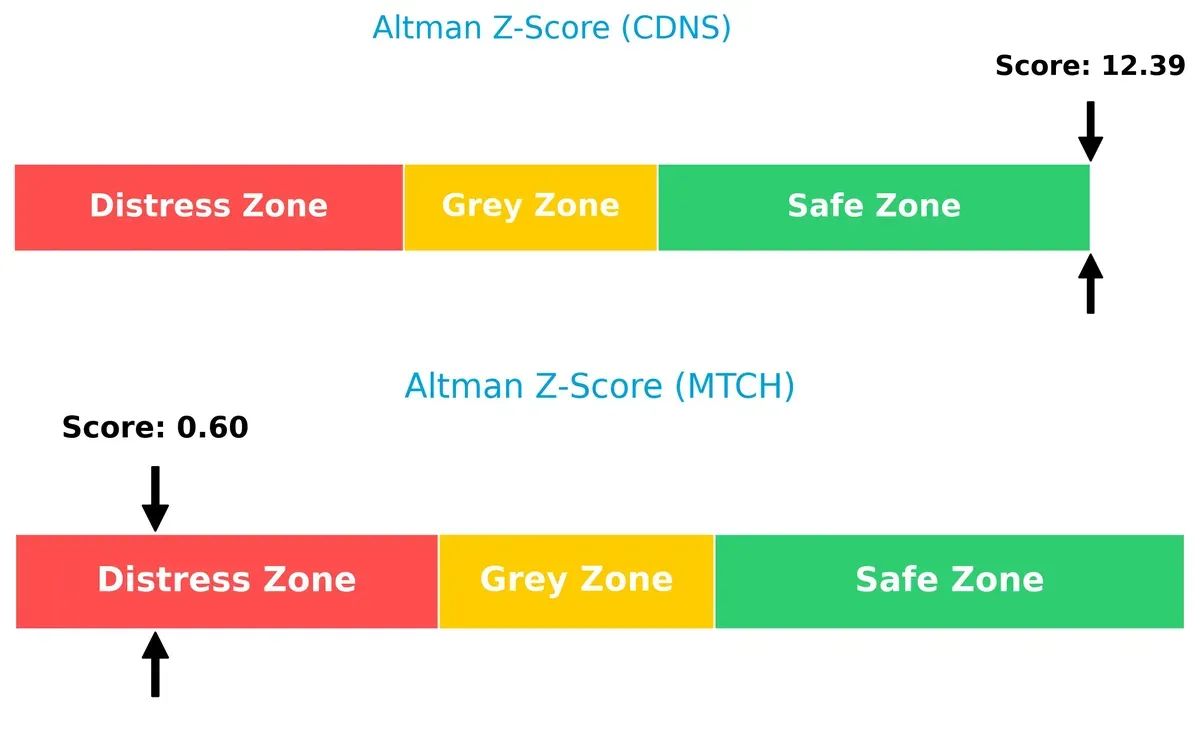
Bankruptcy Risk: Solvency Showdown
Cadence’s Altman Z-Score of 12.4 firmly places it in the safe zone, signaling robust financial stability. Match Group’s score of 0.6 in the distress zone raises significant bankruptcy concerns in this cycle:
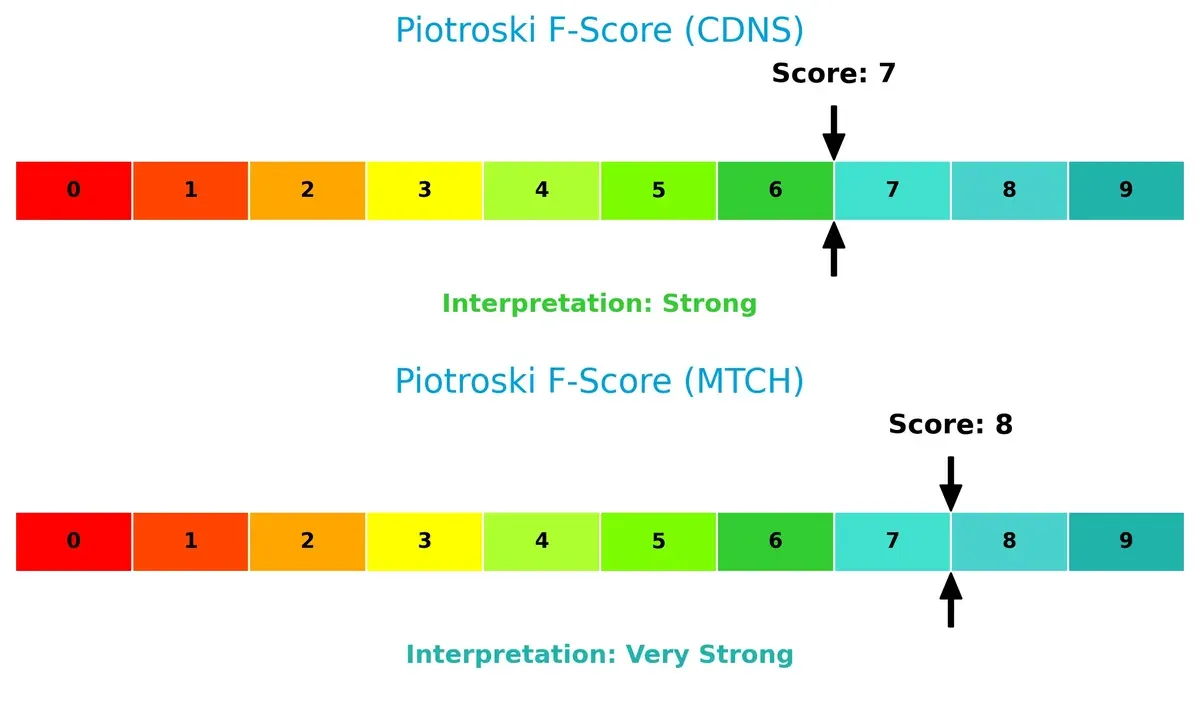
Financial Health: Quality of Operations
Match Group’s Piotroski score of 8 indicates very strong internal financial health, outperforming Cadence’s strong but lower score of 7. Match shows fewer red flags in profitability and efficiency metrics:
How are the two companies positioned?
This section dissects the operational DNA of Cadence Design Systems and Match Group by comparing their revenue distribution and internal dynamics. The goal is to confront their economic moats to identify which business model offers the most resilient, sustainable competitive advantage.
Revenue Segmentation: The Strategic Mix
This visual comparison dissects how Cadence Design Systems and Match Group diversify their income streams and where their primary sector bets lie:
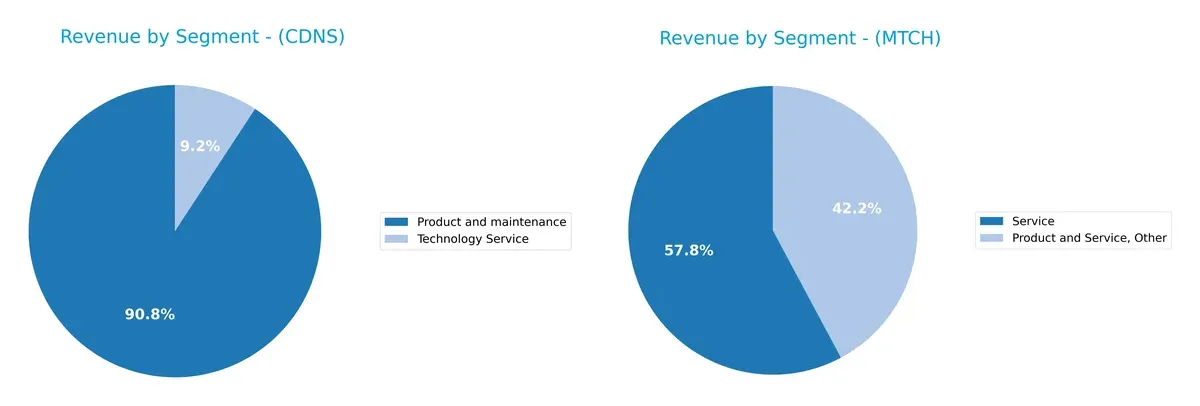
Cadence Design anchors revenue in “Product and maintenance” with $4.2B in 2024, while “Technology Service” contributes $428M, showing moderate diversification. Match Group’s latest data reveals a fragmented mix, but historically it pivots heavily on dating services, risking concentration. Cadence’s mix signals infrastructure dominance and ecosystem lock-in. Match’s reliance on dating segments exposes it to shifting consumer preferences and competitive disruption.
Strengths and Weaknesses Comparison
This table compares the strengths and weaknesses of Cadence Design Systems, Inc. and Match Group, Inc.:
Cadence Strengths
- Strong net margin at 22.74%
- Favorable ROE of 22.58%
- Robust ROIC of 13.43%
- High current and quick ratios indicate liquidity
- Favorable interest coverage of 19.37
- Global revenue spread across Americas, Asia, EMEA, Japan
Match Strengths
- Favorable net margin at 17.59%
- Very high ROIC of 22.5%
- Low WACC at 7.81% supports capital returns
- Favorable PE and PB ratios indicate valuation appeal
- Positive quick ratio and interest coverage
- Significant global revenue presence, especially Non-US and US markets
Cadence Weaknesses
- High PE (77.2) and PB (17.44) suggest overvaluation risk
- No dividend yield
- Moderate debt-to-equity ratio at 0.55
- Asset turnover neutral at 0.52
- Some ratios flagged neutral, indicating mixed efficiency
Match Weaknesses
- Negative ROE at -241.99% signals profitability issues
- Very high debt-to-assets ratio at 89.06% raises financial risk
- Negative debt-to-equity ratio unusual, may indicate accounting complexity
- Lower current ratio at 1.42 less conservative liquidity
- Some neutral asset turnover metrics
Cadence shows financial strength with solid profitability and liquidity but risks overvaluation and no dividend income. Match displays strong capital efficiency with favorable valuation and dividend yield but suffers from poor ROE and high leverage, requiring careful risk management.
The Moat Duel: Analyzing Competitive Defensibility
A structural moat is the only barrier protecting long-term profits from relentless competitive erosion in dynamic markets:
Cadence Design Systems, Inc.: Intangible Assets Powerhouse
I see Cadence’s moat rooted in proprietary software and hardware IP, reflected in high 86% gross margins and stable 31.7% EBIT margins. Despite a 30% declining ROIC trend, its entrenched tech and expanding 5G and automotive markets could sustain defensibility in 2026.
Match Group, Inc.: Network Effects Leader
Match Group thrives on network effects from its dating platforms, enabling scale and pricing power. Its 14.7% ROIC above WACC and rising trend highlight growing profitability, despite flat revenue growth. Expansion in new demographics and AI-driven matchmaking boosts its competitive edge.
The Moat Battle: Intangible Assets vs. Network Effects
Match Group exhibits a deeper, expanding moat driven by network effects and improving ROIC. Cadence’s intangible asset moat is solid but shows erosion risk. Match Group is better positioned to defend and grow market share amid evolving consumer tech.
Which stock offers better returns?
Stock prices for Cadence Design Systems, Inc. and Match Group, Inc. show bearish trends over the past year, with decelerating declines and distinct trading volume dynamics.
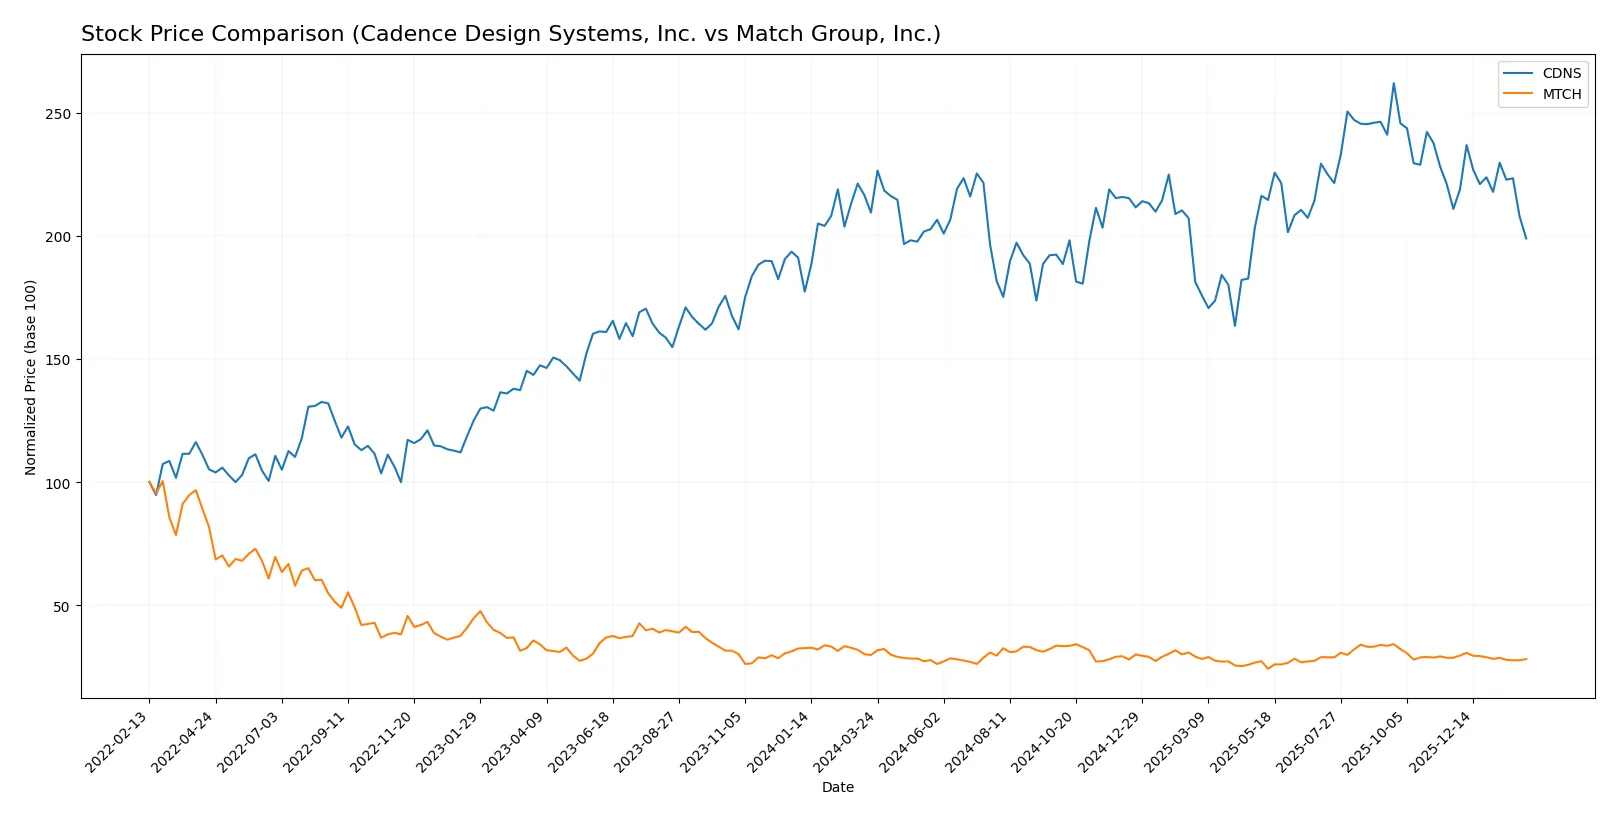
Trend Comparison
Cadence Design Systems, Inc. stock declined 5.0% over the past year, marking a bearish trend with decelerating losses. Price ranged from 232.88 to 373.35, showing high volatility (std dev 29.19).
Match Group, Inc. stock decreased 5.72% over the same period, also bearish with decelerating decline. The price fluctuated between 27.18 and 38.51, but with lower volatility (std dev 2.61).
Both stocks show bearish trends, but Cadence’s price drop is slightly less severe. Match Group exhibits lower volatility and a marginally larger percentage decline.
Target Prices
Analysts present a positive consensus for both Cadence Design Systems and Match Group with clear upside potential.
| Company | Target Low | Target High | Consensus |
|---|---|---|---|
| Cadence Design Systems, Inc. | 275 | 418 | 382.17 |
| Match Group, Inc. | 33 | 43 | 36 |
The consensus target prices for Cadence significantly exceed its current price of 283.52, signaling strong expected growth. Match Group’s targets also suggest modest upside above its current 31.63 price, reflecting steady market confidence.

Don’t Let Luck Decide Your Entry Point
Optimize your entry points with our advanced ProRealTime indicators. You’ll get efficient buy signals with precise price targets for maximum performance. Start outperforming now!
How do institutions grade them?
The following tables summarize recent institutional grades for Cadence Design Systems, Inc. and Match Group, Inc.:
Cadence Design Systems, Inc. Grades
Below are institutional grades assigned to Cadence Design Systems, Inc. over the past year.
| Grading Company | Action | New Grade | Date |
|---|---|---|---|
| Needham | Maintain | Buy | 2025-12-22 |
| Oppenheimer | Maintain | Underperform | 2025-10-28 |
| JP Morgan | Maintain | Overweight | 2025-10-28 |
| Needham | Maintain | Buy | 2025-10-28 |
| Rosenblatt | Maintain | Neutral | 2025-10-28 |
| Baird | Maintain | Outperform | 2025-10-28 |
| Wells Fargo | Maintain | Overweight | 2025-10-28 |
| Rosenblatt | Maintain | Neutral | 2025-10-22 |
| Mizuho | Maintain | Outperform | 2025-07-29 |
| JP Morgan | Maintain | Overweight | 2025-07-29 |
Match Group, Inc. Grades
These grades reflect recent institutional assessments of Match Group, Inc.
| Grading Company | Action | New Grade | Date |
|---|---|---|---|
| TD Cowen | Maintain | Buy | 2026-02-05 |
| JP Morgan | Maintain | Neutral | 2026-02-04 |
| Truist Securities | Maintain | Hold | 2026-02-04 |
| Morgan Stanley | Maintain | Equal Weight | 2026-01-13 |
| Truist Securities | Maintain | Hold | 2025-11-05 |
| Evercore ISI Group | Maintain | In Line | 2025-11-05 |
| Wells Fargo | Maintain | Equal Weight | 2025-11-05 |
| Morgan Stanley | Maintain | Equal Weight | 2025-10-20 |
| Susquehanna | Maintain | Positive | 2025-08-07 |
| JP Morgan | Maintain | Neutral | 2025-08-06 |
Which company has the best grades?
Cadence Design Systems generally receives stronger buy and outperform ratings. Match Group’s grades cluster around neutral and hold. Investors may view Cadence as having more bullish institutional sentiment.
Risks specific to each company
The following categories identify the critical pressure points and systemic threats facing both firms in the 2026 market environment:
1. Market & Competition
Cadence Design Systems, Inc.
- Dominates in IC design software with strong 5G and defense market presence but faces intense tech innovation pressure.
Match Group, Inc.
- Leads in online dating but faces fierce competition from new social platforms and changing consumer preferences.
2. Capital Structure & Debt
Cadence Design Systems, Inc.
- Maintains moderate debt levels (DE 0.55), strong interest coverage (19.37), signaling financial stability.
Match Group, Inc.
- High debt burden (debt to assets 89%), raising financial risk despite adequate interest coverage (6.06).
3. Stock Volatility
Cadence Design Systems, Inc.
- Beta near market average (1.005), indicating moderate volatility aligned with tech sector norms.
Match Group, Inc.
- Higher beta (1.315) suggests greater stock price swings and sensitivity to market shifts.
4. Regulatory & Legal
Cadence Design Systems, Inc.
- Faces typical software IP risks; regulatory environment stable but vigilance on export controls needed.
Match Group, Inc.
- Subject to increasing data privacy regulations and potential legal challenges over user data handling.
5. Supply Chain & Operations
Cadence Design Systems, Inc.
- Relies on complex hardware/software integration, vulnerable to semiconductor supply disruptions.
Match Group, Inc.
- Operates primarily digital platforms, less exposed to physical supply chain risks but dependent on cloud infrastructure.
6. ESG & Climate Transition
Cadence Design Systems, Inc.
- Growing pressure to improve energy efficiency of hardware offerings and reduce carbon footprint.
Match Group, Inc.
- Faces scrutiny on social governance, particularly user safety and data ethics.
7. Geopolitical Exposure
Cadence Design Systems, Inc.
- Exposure to US-China tech tensions affecting semiconductor markets and export controls.
Match Group, Inc.
- Global user base exposes it to regulatory and geopolitical risks across multiple jurisdictions.
Which company shows a better risk-adjusted profile?
Cadence’s strongest risk is market competition amid rapid tech evolution, but its solid capital structure and Altman Z-score (12.39, safe zone) underpin financial resilience. Match Group’s biggest concern is its heavy debt load and distress-level Altman Z-score (0.6), which raise solvency doubts despite strong operational metrics. Cadence presents a better risk-adjusted profile, reflecting prudent balance sheet management amid sector volatility.
Final Verdict: Which stock to choose?
Cadence Design Systems stands out for its unmatched operational efficiency and strong value creation, evidenced by a consistent ROIC above WACC. Its ability to generate high returns on invested capital underscores a durable competitive edge. However, investors should watch its declining profitability trend as a point of vigilance. This stock suits portfolios targeting aggressive growth with a tolerance for valuation premiums.
Match Group’s strategic moat lies in its sustained growth of ROIC and recurring revenue streams, supported by solid free cash flow yields. It offers a more attractive valuation and better income stability relative to Cadence, despite higher leverage risks. Match fits well in GARP (Growth at a Reasonable Price) portfolios seeking steady expansion with moderate risk exposure.
If you prioritize operational efficiency and long-term value creation, Cadence is the compelling choice due to its superior capital allocation and margin profile. However, if you seek growth balanced with better valuation and cash flow stability, Match offers better stability and a more favorable risk-reward tradeoff. Both present viable, but distinct, investment scenarios depending on your appetite for growth versus income stability.
Disclaimer: Investment carries a risk of loss of initial capital. The past performance is not a reliable indicator of future results. Be sure to understand risks before making an investment decision.
Go Further
I encourage you to read the complete analyses of Cadence Design Systems, Inc. and Match Group, Inc. to enhance your investment decisions: